Corporate Accounting: HVA and SGR
VerifiedAdded on 2023/06/05
|16
|3787
|290
AI Summary
The report analyses the financial statements of Harvey Norman Holdings Limited and The Star Entertainment Group for the year 2015, 2016 and 2017. It evaluates the changes in the owner’s equity, cash flow statement, other comprehensive income statement and corporate income tax. The report provides insights regarding the corporate accounting and its concepts in the businesses.
Contribute Materials
Your contribution can guide someone’s learning journey. Share your
documents today.
CA 1
RUNNING HEAD: CORPORATE ACCOUNTING
Corporate Accounting: HVA and SGR
RUNNING HEAD: CORPORATE ACCOUNTING
Corporate Accounting: HVA and SGR
Secure Best Marks with AI Grader
Need help grading? Try our AI Grader for instant feedback on your assignments.
CA 2
EXECUTIVE SUMMARY
The purpose of the report is to provide insights regarding the corporate accounting and its
concepts in the businesses. The report analyses the financial statements of the Harvey Norman
Holdings Limited and The star entertainment Group for the year 2015, 2016 and 2017. The
analysis of the annual reports of the companies is accessed for the comparison of Owners Equity,
Cash flow statement and other comprehensive income and Accounting for corporate income tax.
Owners equity consists of share capital, reserves and retained earnings. Owners equity of HVN
and SGR were $2812.907m and $3,275.6m in year 2017 respectively. The cash flow statement
indicates the three main categories of cash flows. it is identified that HVN and SGR have
increased operating cash inflows but due to investments in fixed assets the investing activities
significantly influences the over cash flows. The effective tax rates for HVN and SGR in year
2017 were 29.2 and 30.42%.
CA 3
Table of Contents
EXECUTIVE SUMMARY.............................................................................................................2
INTRODUCTION...........................................................................................................................4
OWNERS EQUITY.........................................................................................................................5
CASH FLOWS STATEMENT.......................................................................................................7
OTHER COMPREHENSIVE INCOME.......................................................................................10
ACCOUNTING FOR CORPORATE INCOME TAX.................................................................11
CONCLUSION..............................................................................................................................14
REFERENCES..............................................................................................................................15
CA 4
INTRODUCTION
The report will be prepared for the evaluation of the two public limited companies listed on
Australian stock Exchange (ASX). The companies are operating in the field of property
investments, Lessor of premises to franchise, hotel and other hospitality services. The names of
the companies are Harvey Norman Holdings Limited and The Star Entertainment Group.
Harvey Norman Holdings Ltd. (HVN) is successfully operating in diverse businesses such as
integrated retail, digital and franchise activity, property investments and offering wide range of
retail products through franchise model. The products it is offering are computerized
communications, kitchen appliances and other household items (Harvey Norman Holdings
Limited, 2018). It is also successfully operating in Ireland, New Zealand, Singapore and
Malaysia.
The Star Entertainment Group (SGR) owns several hotels in the name of The Star Gold Coast,
The Star in Sydney, Jupiters hotel and Casino on the Gold Coast. It also manages the Gold Coast
Convention and Exhibition centre (The Star Entertainment Group, 2018). There are several
upcoming projects with the company that will lead to achieve a vision to become Australia’s
leading integrated resort Company.
The report will evaluate the annual reports of both the companies for the year 2015, 2016 and
2017 and will analyse the changes in the owner’s equity, cash flow statement, other
comprehensive income statement and corporate income tax.
Secure Best Marks with AI Grader
Need help grading? Try our AI Grader for instant feedback on your assignments.
CA 5
OWNERS EQUITY
(i) It is one of the major components of business which represents the owner’s investment in the
business. This is the amount of the money that is introduced by the owners for carrying out the
establishment and commencement of the business (Dagwell, Wines, and Lambert, 2015). In
accounting owners equity can be obtained by deducting the amount of liabilities from the total
assets. The items listed under the equity head are as below:
Contributed equity/Share capital
The share capital is the amount of the money that is contributed by the shareholders of the
company in the exchange of the shares that are publically issues in the capital market. The
contributed equity of HVN in year 2015 was $380.328m which has increased to $385.296m in
the next year indicating issue of under executive share option plan worth $4.968m (HVN, 2016).
There is also an increase in the contributed equity of HVN to $386.309m in year 2017 (HVN,
2017). This change has occurred due to issue of shares under ESOP for amounting $1.013m. On
the other side, there is no change in the share capital of SGR 2580.5m in year 2015, 2016 and
2017 (SGR, 2017).
Reserves
Reserves are considered as the part of the profit that is retained for the purpose of meeting some
specific purpose. This is the amount held from the amount held for disbursement as dividends.
The reserves held with HVN in year 2015 were $113.290m which has increased to $155.814m
till the end of year 2016 (HVN, 2016). There are several heads that has resulted to increase in the
reserves of HVN the major contributors are Revaluation of land and building, unrealized gain on
CA 6
available for sale investments, reserve expired or realized cash flow hedge reserves (Dagwell,
Wines, and Lambert, 2015). There is significant increase in the reserves due to currency
translation differences that were (5.317m) in 2015 and have positive balance of $29.492m as on
30 June 2016. The amount of reserves again increases to $174.950m at the end of year on 30
June 2017. At the same time, SGR was having negative reserves of $(7.4m,) in year 2015 which
has improved to $5.4m in year 2016 (SGR, 2016). This improvement takes place due to
improved position of the hedging reserve and share based payment reserves. But again in year
2017 the reserves fell to negative figure of $(7.2m) (SGR, 2017).
Retained profits
Retained earnings are the profits of the company that are earned at the end of the financial year
after the distribution of the dividends or any other benefits to the investors. Large amount of
retained earning depicts healthy financial position of the companies. At the time of analysis the
retained profits of HVN it is identified that the reserves were 2043.463m in year 2015 that
increased to 2125.186m in year 2016 and again improved to 2229.200m in year 2017 (HVN,
2016). The major contribution was due to increase in profits. The company also declared
dividends of 344.962m in year 2017 (HVN, 2017). Similarly, SGR is also having increased
retained earnings in year $462.3m in 2015 which has increase to 561.8m in year 2015 (SGR,
2016). The increased profits in the next year lead to improvement in the retained earnings of the
company to $702.3m (SGR, 2017).
(ii) Debt and equity position
From the available information in the annual reports of both the companies, it is identified that
the total equity of HVN was 2556.860m in 2015 which was increased to 2688.674m in year 2016
CA 7
(HVN, 2016). On the other side, the debt position of the company was 518.605m in year 2015
which are paid to some extent lead to a balance of 464.114m in year 2016. In year 2017 the
equity position of HVN is 2812.907m and the debts were also increased and reached to
$633.412m (HVN, 2017). The main reason for this increase in the debt was due to increase in the
interest bearing loans and borrowings and deferred income tax liabilities. At the same time, SGR
was having equity of $3035.4 which has improved to $3147.7m in year 2015 and 2016
respectively. The debt position in the period was $989.20m and $1068.00m. In the next year,
2017 the equity of SGR was again improved and resulted to $3275.6m and debts were also
increased to $1150.4m (SGR, 2016). The major increase in the debts was interest bearing
liabilities reached to 915.0m in year 2017 in comparison to that of 813.5m in 2016.
CASH FLOWS STATEMENT
(iii) Cash flow comprises of three activities first head is operating activities related to the core
operations followed by investing activities related with purchase and sale of fixed assets and
other capital investments and sales (Wilson, Freeman, and Freeman, 2015). At last, it consists of
financing activities that leads to complete the finance needs of the company such as issue of
share capital, borrowings and so on.
As per the analysis of cash flow statement of HVN and SGR is identified that the cash flow
statement of HVN records net receipts from franchise, receipts from customers, payments to the
suppliers and employees, distribution received form joint ventures, GST paid, interest received,
interest and other financial costs paid, income tax paid and dividends received (Armstrong,
Blouin, Jagolinzer, and Larcker, 2015). There is an increase in the cash flow from operating
activities from $340.488m in year 2015 to $437.691m in year 2016 but there is slight decline in
Paraphrase This Document
Need a fresh take? Get an instant paraphrase of this document with our AI Paraphraser
CA 8
the net inflows in year 2017 to $425.140m the main reason for the decline was due to decrease in
the net receipts from franchise and increase in the income taxes paid by the company (HVN,
2017).
On the other side, SGR is having the net cash receipts from customers. This is the proceeds of
the cash sales from the various activities of the company. Payments to the suppliers and
employees indicate the expenses actually incurred during the year and paid to the various
creditors and salaries to the employees and other staff. This also includes the taxes and levies for
the various facilities to the customers paid to the government (Wilson, Freeman, and Freeman,
2015). The last two heads are interest received it will be the income on investments or savings.
The income taxes paid is the actual paid tax for the current year.
The next head is the cash flow from investing activities; HVN has made investments in the
plants, property and intangible assets since purchase leads to outflow of cash this is the reason it
is deducted from the cash inflows or shown in negative figures. Next is the purchase of
investment properties that again leads to decrease in the cash position of the firm. Thereafter, the
proceeds of the sales of the assets recorded which leads to increase the cash of the company.
There is a significant increase in the investment properties in the current year from 64.338m in
2016 to 114.752m in year 2017 (HVN, 2017). On the other side, the investing activities of SGR
indicate purchase of the property, plant, equipment and investments in associate and joint
venture activities. The purchase of property, plant and equipments are 407.6m in year 2017 and
investments in associate and joint venture entities are 183.9m (SGR, 2017).
While analysing the investing activities it is identified that HVN has significant decline in the
proceeds from the shares from $4.968m to 1.013m in year 2017. There is also proceeds from
CA 9
syndicated facility amounting to $70.00m. The other activities include dividends paid, loans
received and repayments or proceeds from other borrowings that helps in boosting or leveraging
the business (HVN, 2016). On the other side, SGR is having financing activities such as interest
bearing liabilities $434.5m (SGR, 2017). The outflow in financing activities includes repayment
interest, dividends and finance costs.
(iv) Comparison of the three broad categories
The cash flow from operating activities of HVN in year 2015 were 340.448m which has
increased to 437.691m in year 2016 but there is downfall in the proceeds from operating income
in year 2017 to 425.140m (HVN, 2016). On the other hand, the proceeds of the operating
activities of SGR were, 485.5m, 377.9m and 473.3m in years 2015, 2016 and 2017 respectively
(SGR, 2017). The main factor contributing to the increase in year 2017 was proceeds of the net
cash receipts which are increased by 60.7m (2348.3-2287.6).
Investing activities of HVN indicates that there is more outflow of cash in year 2015 amounting
$81.803m and 179.853$ in year 2016. There is also an increase in outflow in 2017 by $198.765
the main contribution in this outflow is purchase of investment properties and plant/property
contributing $114.752 and 89.366 respectively (HVN, 2017). Similarly, SGR is also have
negative figures from investing activities 140.2m, 321.8m and 591.5m in years 2015, 2016 and
2017 respectively (SGR, 2017). The main investment was in property, plant, equipment and
intangibles amounting to 407.5m. The company has also increase the investments significantly
during the periods of the assessment.
Proceeds of the financing activities indicate that HVN is having negative cash inflows from
financing activities. $220.597m was the outflow in year 2015 which is again increased and
CA 10
$307.427m were paid as dividends and loans repayments under financing activities in year 2016.
The financing activity outflow was $287.124m in year 2017 (HVN, 2017). At the same time,
SGR were having more cash outflow similar to HVN. The outflow for year 2015 was $297.7m
and 93.7m in year 2016. There is proceed from the interest bearing liabilities amounting
$434.5m that leads to raising more funds and the company net inflow was 72.9m in year 2017.
At the end the overall cash position of the HVN was 153.220m, 103.631m and 42.882m in year
2015, 2016 and 2017 respectively(HVN, 2016). On the other side, the overall cash position of
SGR is better amounting to 196.6m, 159.0m and 113.7m in the same period (SGR, 2017).
(v) While analysing the cash flow statements of both the companies, it is identified that HVN
and SGR are investing majority of the amounts in investing among the various assets indicating
the continuous focus towards enhancing the opportunities. It is also indentified that HVN is
continuously issuing shares for financing the business where as SGR is having focus towards
bank loans and private placements (Gitman, Juchau, and Flanagan, 2015). The investment in
property, plant and other equipments were financed by interest bearing liabilities to leverage the
business. In addition to this HVN and SGR are paying dividends the dividends for year 2017
were 344.962m and 123.9m respectively.
OTHER COMPREHENSIVE INCOME
(vi) The statement of comprehensive income of HVN records asset revaluation reserve,
available-for-sale reserve, foreign currency translation reserve, income tax effect on cash flow
hedge reserve and non-controlling interests. It also includes items that were not reclassified to
profit/loss such as fair value revaluation of building and land and income tax effect on fair value
revaluation of buildings and land (Robinson, Henry, Pirie, and Cope, 2015). On the other side,
Secure Best Marks with AI Grader
Need help grading? Try our AI Grader for instant feedback on your assignments.
CA 11
SGR records net loss/gains on cash flow hedges, transfer of hedging reserve to income statement
and taxes on both the accounts.
(vii) This statement records the items that are not realised till the date of the preparation of the
accounts but as per the needs and requirements of IFRS, AAS and IASB it is needed to disclose
the information (Wilson, Freeman, and Freeman, 2015). Along with this, it is also needed
provide the information to the investors and creditors so these are recorded in other
comprehensive income statement. This is the reason these above mentioned items are not
recorded in Income statement and need of other comprehensive income arise.
(viii) In case these transactions were attribute to income statement then the profits of the current
years for HVN will be increased from 452.966m to 470.191m (HVN, 2017). Similarly, the
profits of SGR will decrease from $264.4 to 251.0 in year 2017 (SGR, 2017).
(ix) It is identified that the other comprehensive income should be included in the evaluation of
the performance of managers as the activities that are carried out such as investments and foreign
exchange transactions hedging etc. it helps to get more accurate measure of the fair value of the
companies investments so this is suggested to take care of the other comprehensive income for
the purpose of evaluating the performance (Gitman, Juchau, and Flanagan, 2015).
ACCOUNTING FOR CORPORATE INCOME TAX
(x) As per the information available in the annual report for year 2017, the tax expenses of HVN
were$186.840m and the taxes paid were $152.454m and the income tax expenses paid by SGR
were $115.6m and tax paid were 95.6m.
(xi) Effective rate calculation
CA 12
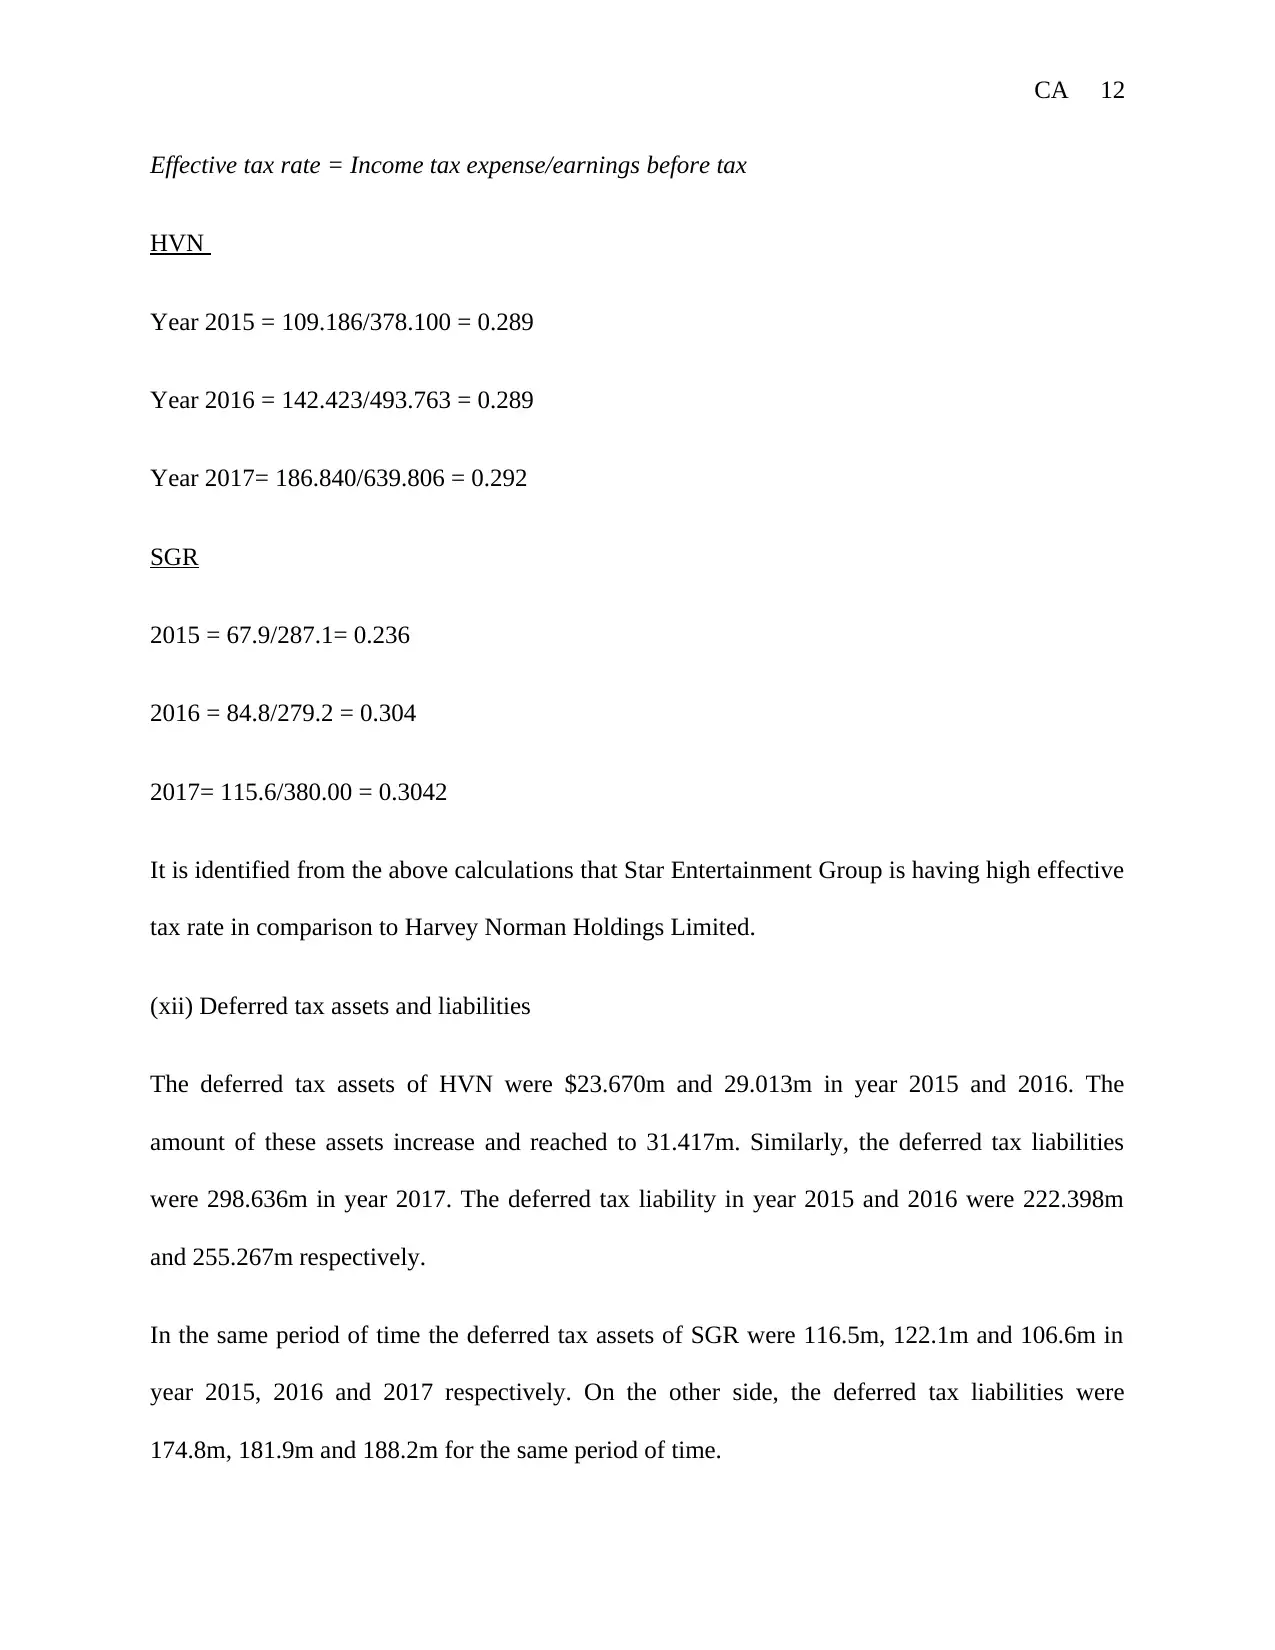
Effective tax rate = Income tax expense/earnings before tax
HVN
Year 2015 = 109.186/378.100 = 0.289
Year 2016 = 142.423/493.763 = 0.289
Year 2017= 186.840/639.806 = 0.292
SGR
2015 = 67.9/287.1= 0.236
2016 = 84.8/279.2 = 0.304
2017= 115.6/380.00 = 0.3042
It is identified from the above calculations that Star Entertainment Group is having high effective
tax rate in comparison to Harvey Norman Holdings Limited.
(xii) Deferred tax assets and liabilities
The deferred tax assets of HVN were $23.670m and 29.013m in year 2015 and 2016. The
amount of these assets increase and reached to 31.417m. Similarly, the deferred tax liabilities
were 298.636m in year 2017. The deferred tax liability in year 2015 and 2016 were 222.398m
and 255.267m respectively.
In the same period of time the deferred tax assets of SGR were 116.5m, 122.1m and 106.6m in
year 2015, 2016 and 2017 respectively. On the other side, the deferred tax liabilities were
174.8m, 181.9m and 188.2m for the same period of time.
CA 13
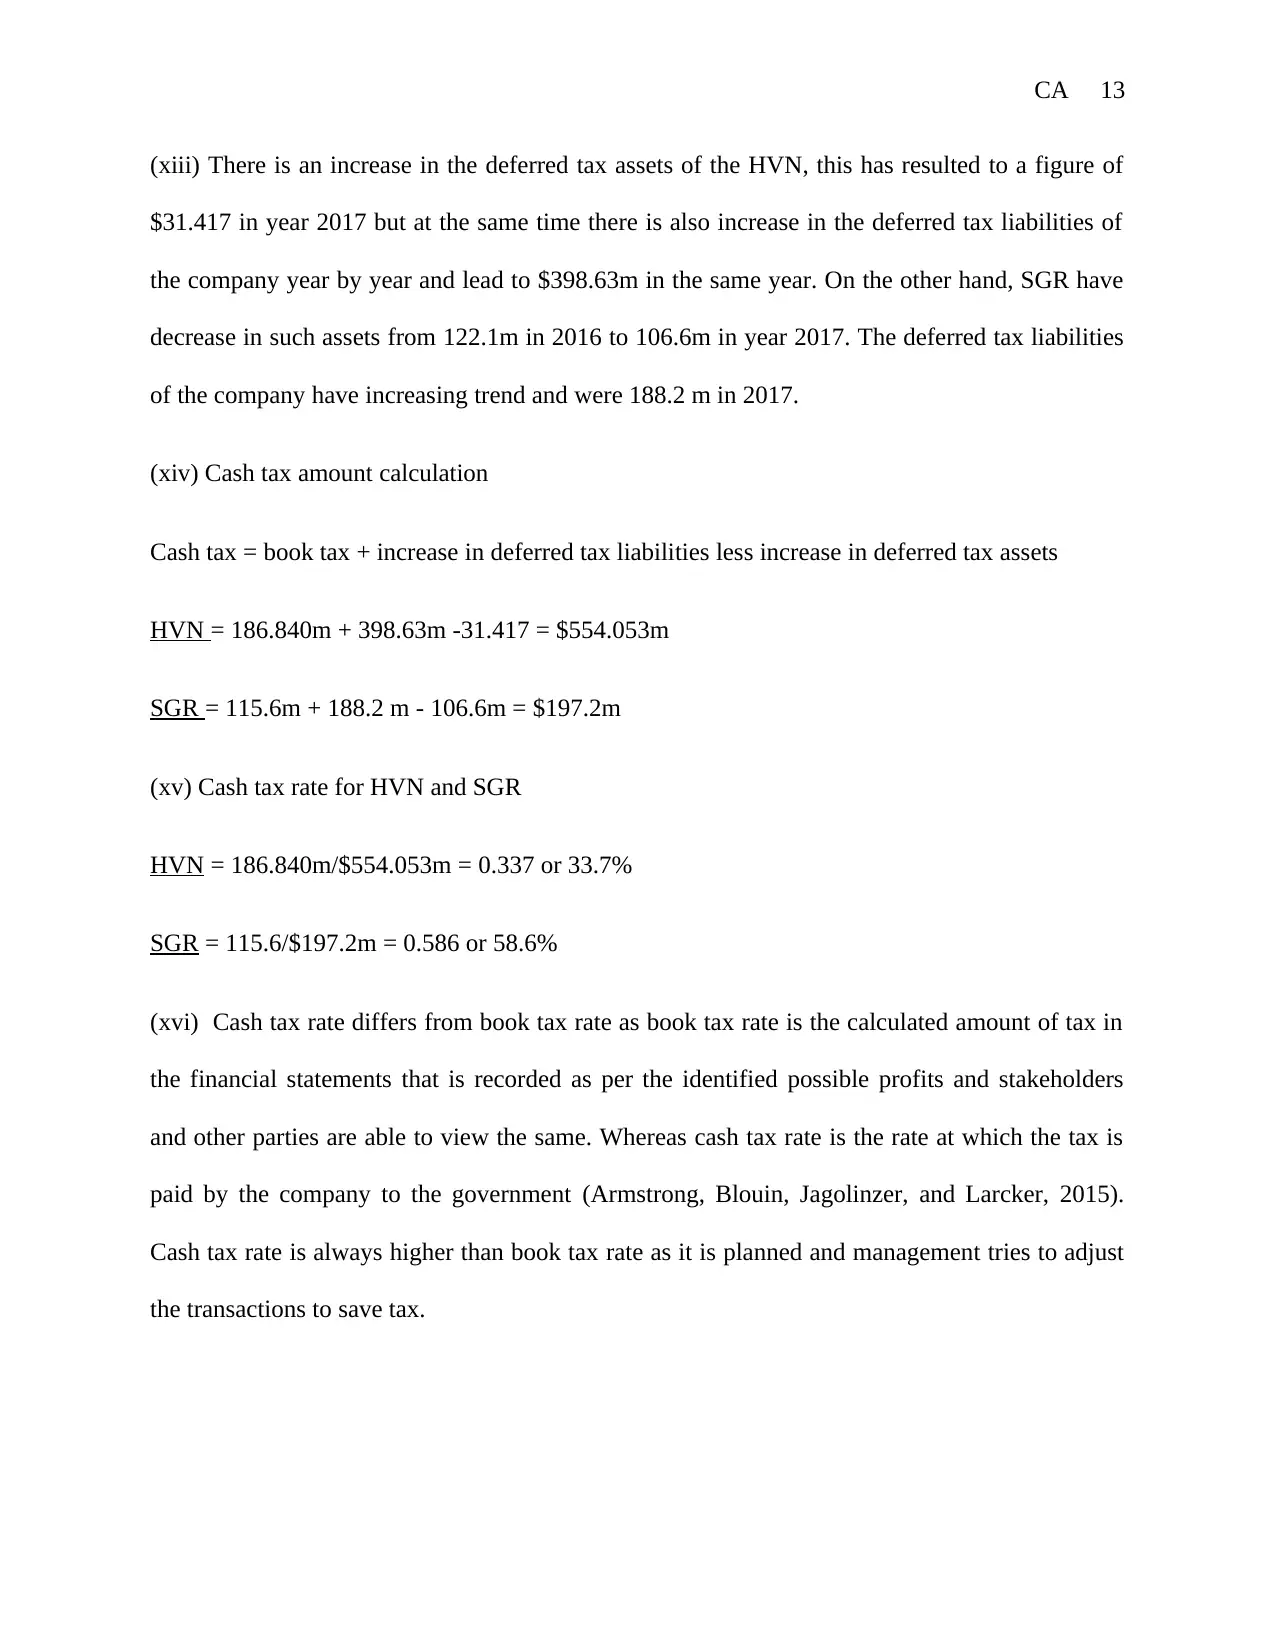
(xiii) There is an increase in the deferred tax assets of the HVN, this has resulted to a figure of
$31.417 in year 2017 but at the same time there is also increase in the deferred tax liabilities of
the company year by year and lead to $398.63m in the same year. On the other hand, SGR have
decrease in such assets from 122.1m in 2016 to 106.6m in year 2017. The deferred tax liabilities
of the company have increasing trend and were 188.2 m in 2017.
(xiv) Cash tax amount calculation
Cash tax = book tax + increase in deferred tax liabilities less increase in deferred tax assets
HVN = 186.840m + 398.63m -31.417 = $554.053m
SGR = 115.6m + 188.2 m - 106.6m = $197.2m
(xv) Cash tax rate for HVN and SGR
HVN = 186.840m/$554.053m = 0.337 or 33.7%
SGR = 115.6/$197.2m = 0.586 or 58.6%
(xvi) Cash tax rate differs from book tax rate as book tax rate is the calculated amount of tax in
the financial statements that is recorded as per the identified possible profits and stakeholders
and other parties are able to view the same. Whereas cash tax rate is the rate at which the tax is
paid by the company to the government (Armstrong, Blouin, Jagolinzer, and Larcker, 2015).
Cash tax rate is always higher than book tax rate as it is planned and management tries to adjust
the transactions to save tax.
Paraphrase This Document
Need a fresh take? Get an instant paraphrase of this document with our AI Paraphraser
CA 14
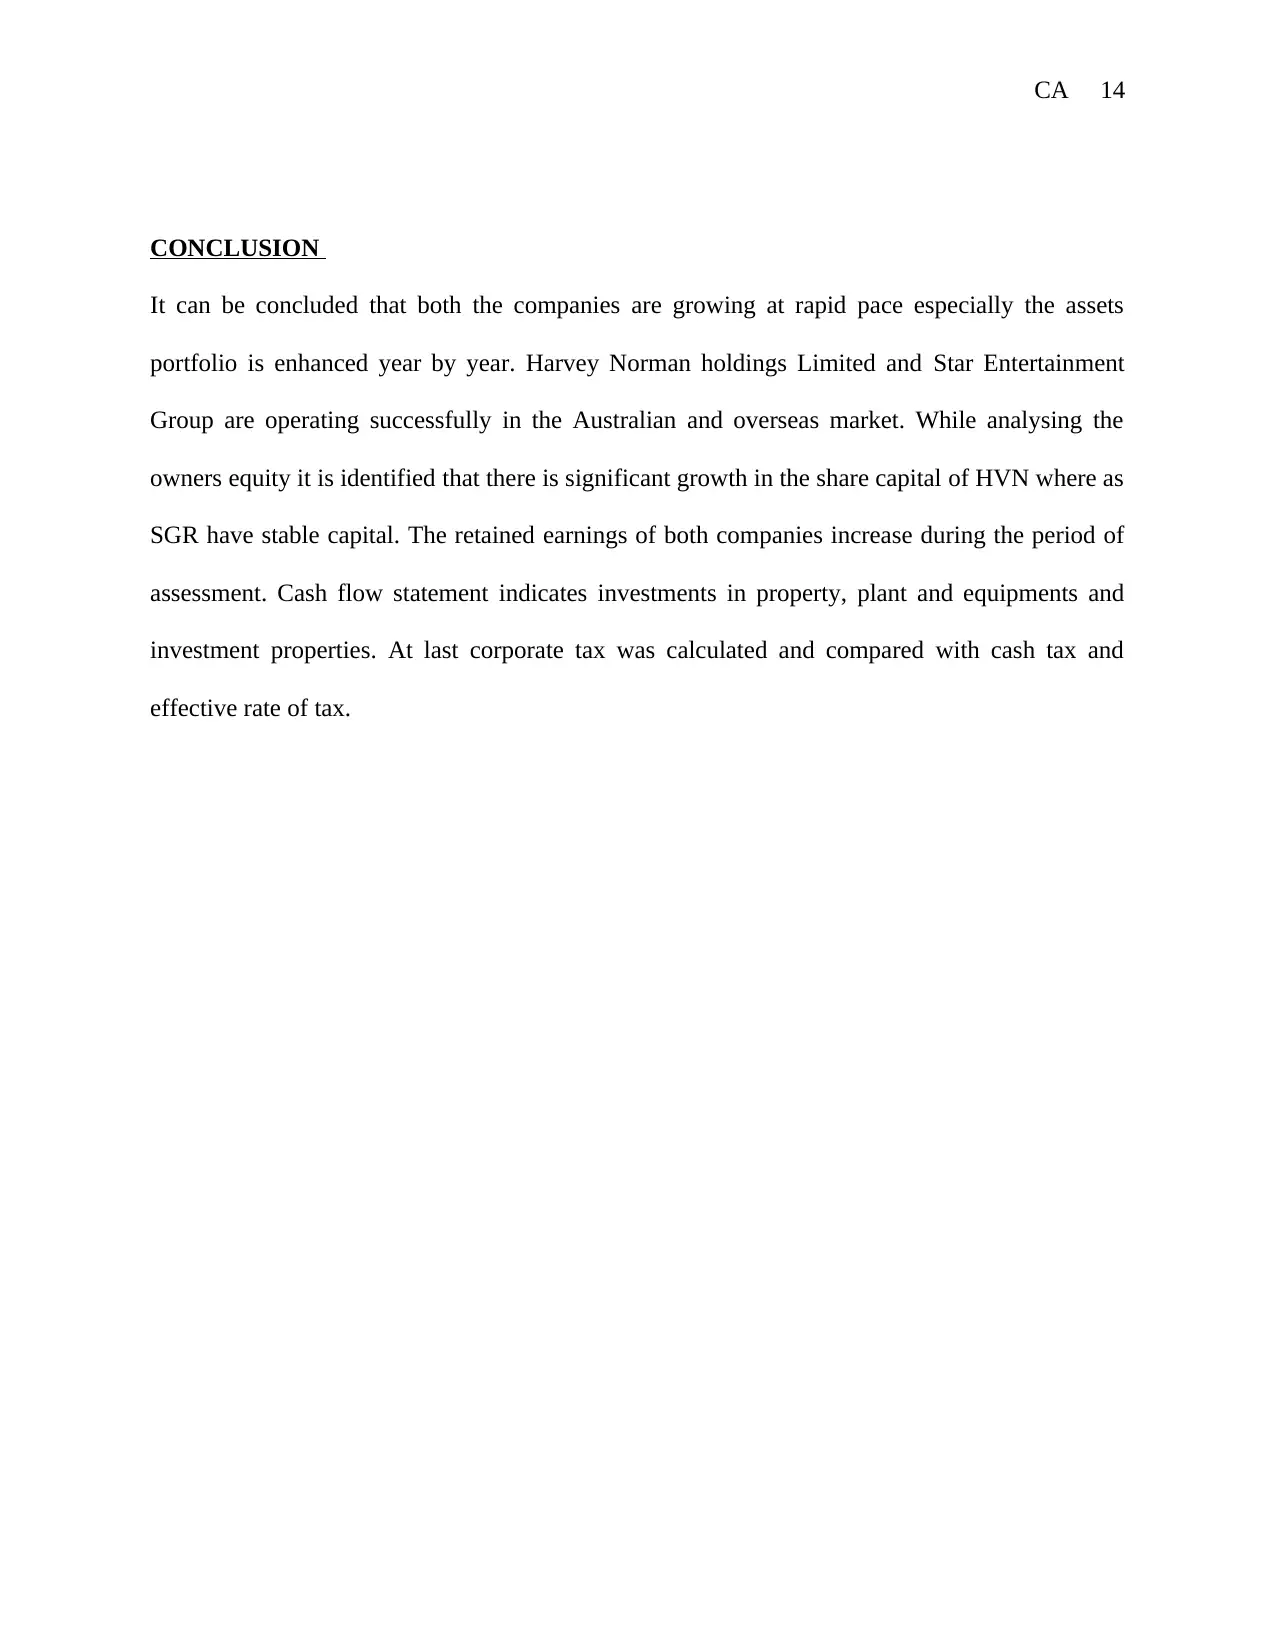
CONCLUSION
It can be concluded that both the companies are growing at rapid pace especially the assets
portfolio is enhanced year by year. Harvey Norman holdings Limited and Star Entertainment
Group are operating successfully in the Australian and overseas market. While analysing the
owners equity it is identified that there is significant growth in the share capital of HVN where as
SGR have stable capital. The retained earnings of both companies increase during the period of
assessment. Cash flow statement indicates investments in property, plant and equipments and
investment properties. At last corporate tax was calculated and compared with cash tax and
effective rate of tax.
CA 15
REFERENCES
Armstrong, C. S., Blouin, J. L., Jagolinzer, A. D., & Larcker, D. F. (2015). Corporate
governance, incentives, and tax avoidance. Journal of Accounting and Economics, 60(1),
1-17.
Dagwell, R., Wines, G. & Lambert, C. (2015). Corporate Accounting in Australia. Australia:
Pearson Higher Education.
Gitman, L. J., Juchau, R., & Flanagan, J. (2015). Principles of managerial finance. AU: Pearson
Higher Education.
Harvey Norman Holdings Limited (2018). COMPANY OVERVIEW. Retrieved from:
http://www.harveynormanholdings.com.au/company/
Higgins, R. C. (2012). Analysis for financial management. USA: McGraw-Hill/Irwin
HVN (2016). 2016 ANNUAL REPORT. Retrieved from:
http://clients.weblink.com.au/news/pdf/01784649.pdf
HVN (2017). 2017 ANNUAL REPORT. Retrieved from:
https://static1.squarespace.com/static/54803162e4b08e1b8a472201/t/
59cded6780bd5e4dbeef7f83/1506667916831/2017-Annual-Report.pdf
Robinson, T., Henry, E., Pirie, W., & Cope, A. (2015). International Financial Statement
Analysis. USA: John Wiley and Sons.
SGR (2016). ANNUAL REPORT 2016. Retrieved from:
https://static1.squarespace.com/static/55f76728e4b0799db9586a8d/t/
59c4910f2aeba5101ca0028e/1506054434087/Star+Annual+Report+2016.pdf
CA 16
SGR (2017). ANNUAL REPORT 2017. Retrieved from:
https://static1.squarespace.com/static/55f76728e4b0799db9586a8d/t/
59c4a45412abd9135d4971c8/1506059366596/2017.09.22_SGR+2017+Annual+Report.p
df
The Star Entertainment Group (2018). THE STAR ENTERTAINMENT GROUP. Retrieved from:
https://www.starentertainmentgroup.com.au/starentertainmentgroup/
Wilson, V., Freeman, S. & Freeman, J., (2015). Accounting: A Practical Approach. Australia:
Pearson Higher Education.
1 out of 16


Your All-in-One AI-Powered Toolkit for Academic Success.
+13062052269
info@desklib.com
Available 24*7 on WhatsApp / Email
![[object Object]](/_next/static/media/star-bottom.7253800d.svg)
Unlock your academic potential
© 2024 | Zucol Services PVT LTD | All rights reserved.