Portfolio Standard Deviation and Correlation

Verified

Added on  2020/05/11

|6
|1280
|67
AI Summary
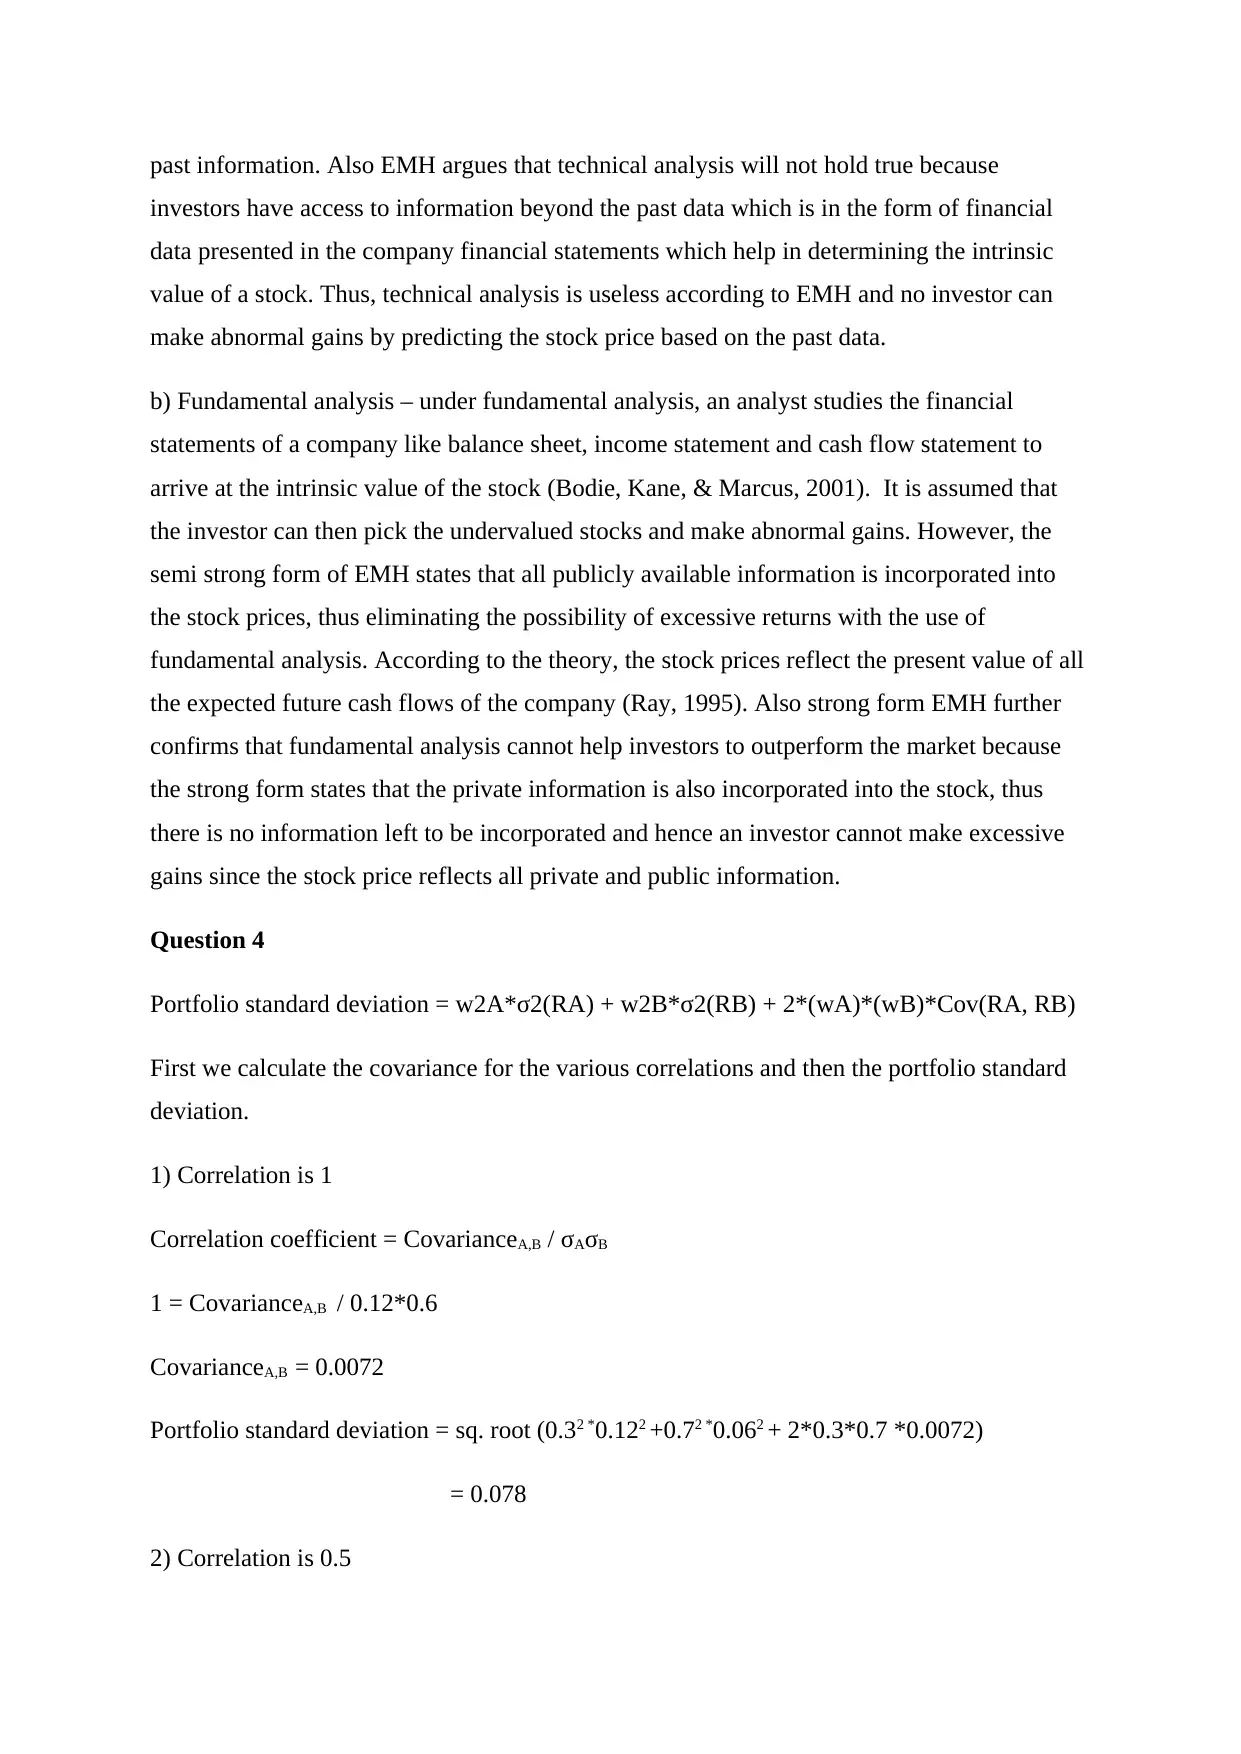
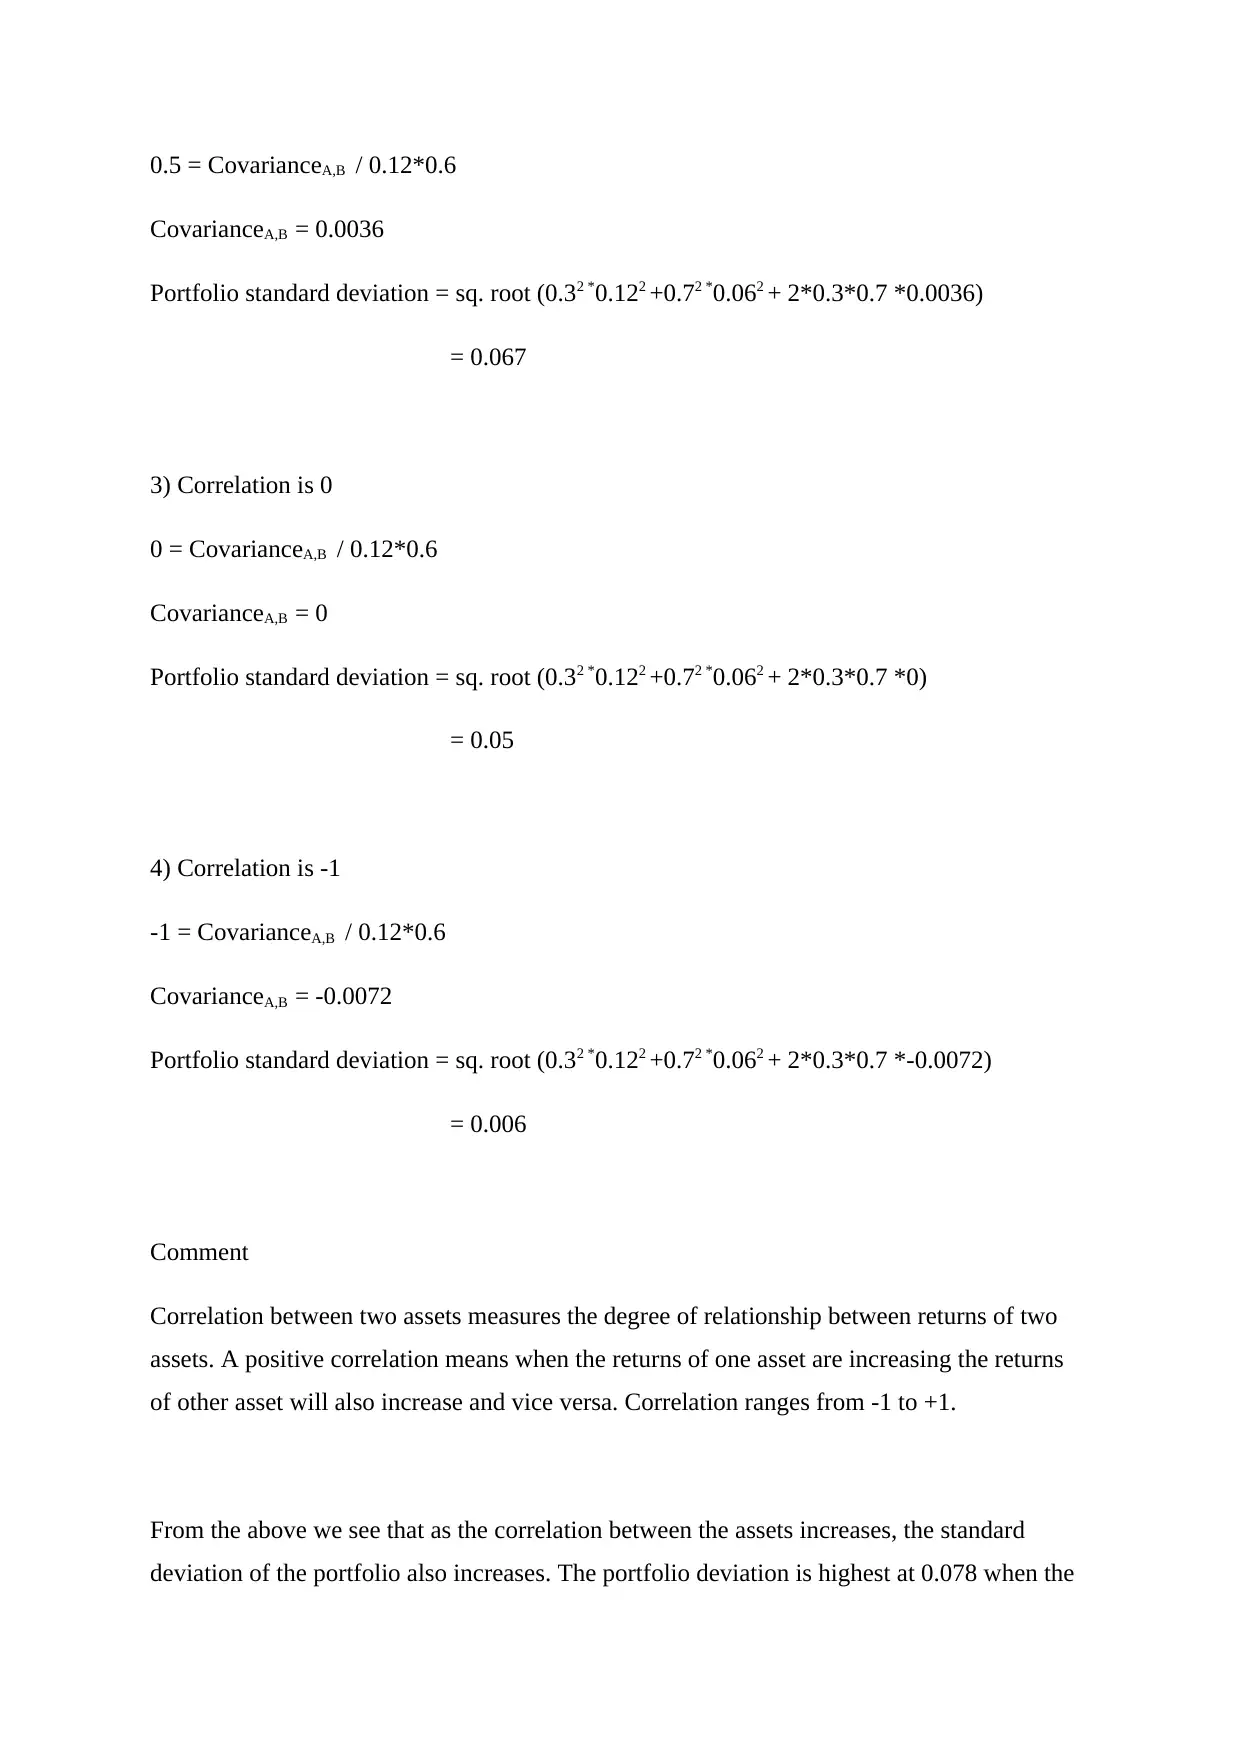
This assignment examines the relationship between asset correlation and portfolio risk (standard deviation). It demonstrates how to calculate portfolio standard deviation using weights and variances of individual assets, along with the impact of covariance due to correlation. Calculations are shown for correlations ranging from +1 (perfect positive) to -1 (perfect negative), illustrating the varying levels of risk associated with different correlation scenarios.
tabler-icon-diamond-filled.svg

Contribute Materials

Your contribution can guide someone’s learning journey. Share your documents today.
Document Page
Corporate Finance
[Type the abstract of the document here. The abstract is typically a short summary of the contents
of the document. Type the abstract of the document here. The abstract is typically a short
summary of the contents of the document.]
tabler-icon-diamond-filled.svg

Secure Best Marks with AI Grader

Need help grading? Try our AI Grader for instant feedback on your assignments.
Document Page
Question 1
a) Ending portfolio value = $12.72 million
Dividends paid = $255000
Beginning portfolio value = $12.13 million
Return on the portfolio = [dividends + (ending portfolio value – beginning portfolio value)] /
beginning portfolio value
= [$0.255+($12.72-$12.13)] / $12.13
= 6.96%
b) Ending value of all ordinary index = $5695
Beginning value of all ordinary index = $5226
Return on all ordinary index = (Ending value of all ordinary index - Beginning value of all
ordinary index) / Beginning value of all ordinary index
= ($5695 - $5226) / $5226
= 8.97%
c) Ending share price of BHP = $27.42
Beginning share price of BHP = $23.45
Dividends paid = $1.13
Return on share of BHP = [dividends + (ending share value – beginning share value)] /
beginning share value
= [$1.13 + ($27.42 - $23.45)] / $23.45
= 21.74%
Document Page
Question 2
Present value of the lump sum amount = FV * [1/(1+i)t ]
FV = $100,000 , I = 11% , t = 15 years
Therefore present value of lump sum amount = 100000* [1/(1+0.11)15 ]
= $20,900
Now $209,00 is the first annual cash flow in the beginning of the 4th year of the perpetuity.
This becomes a delayed perpetuity. From the delayed perpetuity, we calculate the annual cash
flow of perpetuity.
Delayed perpetuity = (annual cash flow / r) * (1/1+i)t
20900 = (annual cash flow / 0.11) * (1/1.11)4
Therefore annual cash flow of perpetuity = $3490.04
Question 3
Efficient Market Hypothesis (EMH) states that for efficient markets, the share prices are
always accurate and they reflect all the available information about the stock (Sewell, 2012).
Three forms of EMH are said to exist which are weak form of EMH, semi strong form and
strong form of EMH. According to the theory, since the share prices reflect all the available
information about the stock, it is impossible for any individual investor or trader to make
abnormal gains from selling or buying the shares because even if a stock is under-priced or
overpriced, the buying and selling activities will bring the share back to its intrinsic value.
However, analysts believe that with the use of technical analysis and fundamental analysis, it
is possible for an investor to make abnormal gains.
a) Technical analysis – It is assumed by analysts that the stock prices and the sentiments of
the investors follow a specific pattern and by analysing this pattern using technical analysis,
the future stock prices can be predicted and thereby gains which are above the market returns
can be made. However, the weak form of EMH states that all the past information of the
stock is incorporated in the stock prices and it is not possible to make gains by analysing the
Document Page
past information. Also EMH argues that technical analysis will not hold true because
investors have access to information beyond the past data which is in the form of financial
data presented in the company financial statements which help in determining the intrinsic
value of a stock. Thus, technical analysis is useless according to EMH and no investor can
make abnormal gains by predicting the stock price based on the past data.
b) Fundamental analysis – under fundamental analysis, an analyst studies the financial
statements of a company like balance sheet, income statement and cash flow statement to
arrive at the intrinsic value of the stock (Bodie, Kane, & Marcus, 2001). It is assumed that
the investor can then pick the undervalued stocks and make abnormal gains. However, the
semi strong form of EMH states that all publicly available information is incorporated into
the stock prices, thus eliminating the possibility of excessive returns with the use of
fundamental analysis. According to the theory, the stock prices reflect the present value of all
the expected future cash flows of the company (Ray, 1995). Also strong form EMH further
confirms that fundamental analysis cannot help investors to outperform the market because
the strong form states that the private information is also incorporated into the stock, thus
there is no information left to be incorporated and hence an investor cannot make excessive
gains since the stock price reflects all private and public information.
Question 4
Portfolio standard deviation = w2A*σ2(RA) + w2B*σ2(RB) + 2*(wA)*(wB)*Cov(RA, RB)
First we calculate the covariance for the various correlations and then the portfolio standard
deviation.
1) Correlation is 1
Correlation coefficient = CovarianceA,B / σAσB
1 = CovarianceA,B / 0.12*0.6
CovarianceA,B = 0.0072
Portfolio standard deviation = sq. root (0.32 *0.122 +0.72 *0.062 + 2*0.3*0.7 *0.0072)
= 0.078
2) Correlation is 0.5
tabler-icon-diamond-filled.svg

Secure Best Marks with AI Grader

Need help grading? Try our AI Grader for instant feedback on your assignments.
Document Page
0.5 = CovarianceA,B / 0.12*0.6
CovarianceA,B = 0.0036
Portfolio standard deviation = sq. root (0.32 *0.122 +0.72 *0.062 + 2*0.3*0.7 *0.0036)
= 0.067
3) Correlation is 0
0 = CovarianceA,B / 0.12*0.6
CovarianceA,B = 0
Portfolio standard deviation = sq. root (0.32 *0.122 +0.72 *0.062 + 2*0.3*0.7 *0)
= 0.05
4) Correlation is -1
-1 = CovarianceA,B / 0.12*0.6
CovarianceA,B = -0.0072
Portfolio standard deviation = sq. root (0.32 *0.122 +0.72 *0.062 + 2*0.3*0.7 *-0.0072)
= 0.006
Comment
Correlation between two assets measures the degree of relationship between returns of two
assets. A positive correlation means when the returns of one asset are increasing the returns
of other asset will also increase and vice versa. Correlation ranges from -1 to +1.
From the above we see that as the correlation between the assets increases, the standard
deviation of the portfolio also increases. The portfolio deviation is highest at 0.078 when the
Document Page
correlation between assets A and B is 1 and the lowest at 0.006 when the correlation is -1.
Investors use correlation between assets to diversify their portfolio. A diversified portfolio
will have assets with negative correlation so that when the prices of one asset falls, the price
of the other asset should increase in order to maximize the total returns and minimize the
losses (Harvey, 2001). Diversification helps in minimizing the risk.
Bibliography
Harvey, C. (2001, February 27). Global Financial Management.
Ray, B. (1995). The Theory of Stock Market Efficiency: Accomplishments and Limitations. Journal of
Corporate Finance.
Sewell, M. (2012). Efficienct Market Hypothesis: An Empirical Evidence. International Journal of
Statistics and Probability.
chevron_up_icon
1 out of 6
circle_padding
hide_on_mobile
zoom_out_icon
[object Object]

Your All-in-One AI-Powered Toolkit for Academic Success.

Available 24*7 on WhatsApp / Email

[object Object]