Evaluating CSR Limited's Dividend Policy and Financial Performance

Verified

Added on  2022/11/17

|7
|1737
|430
Report
AI Summary
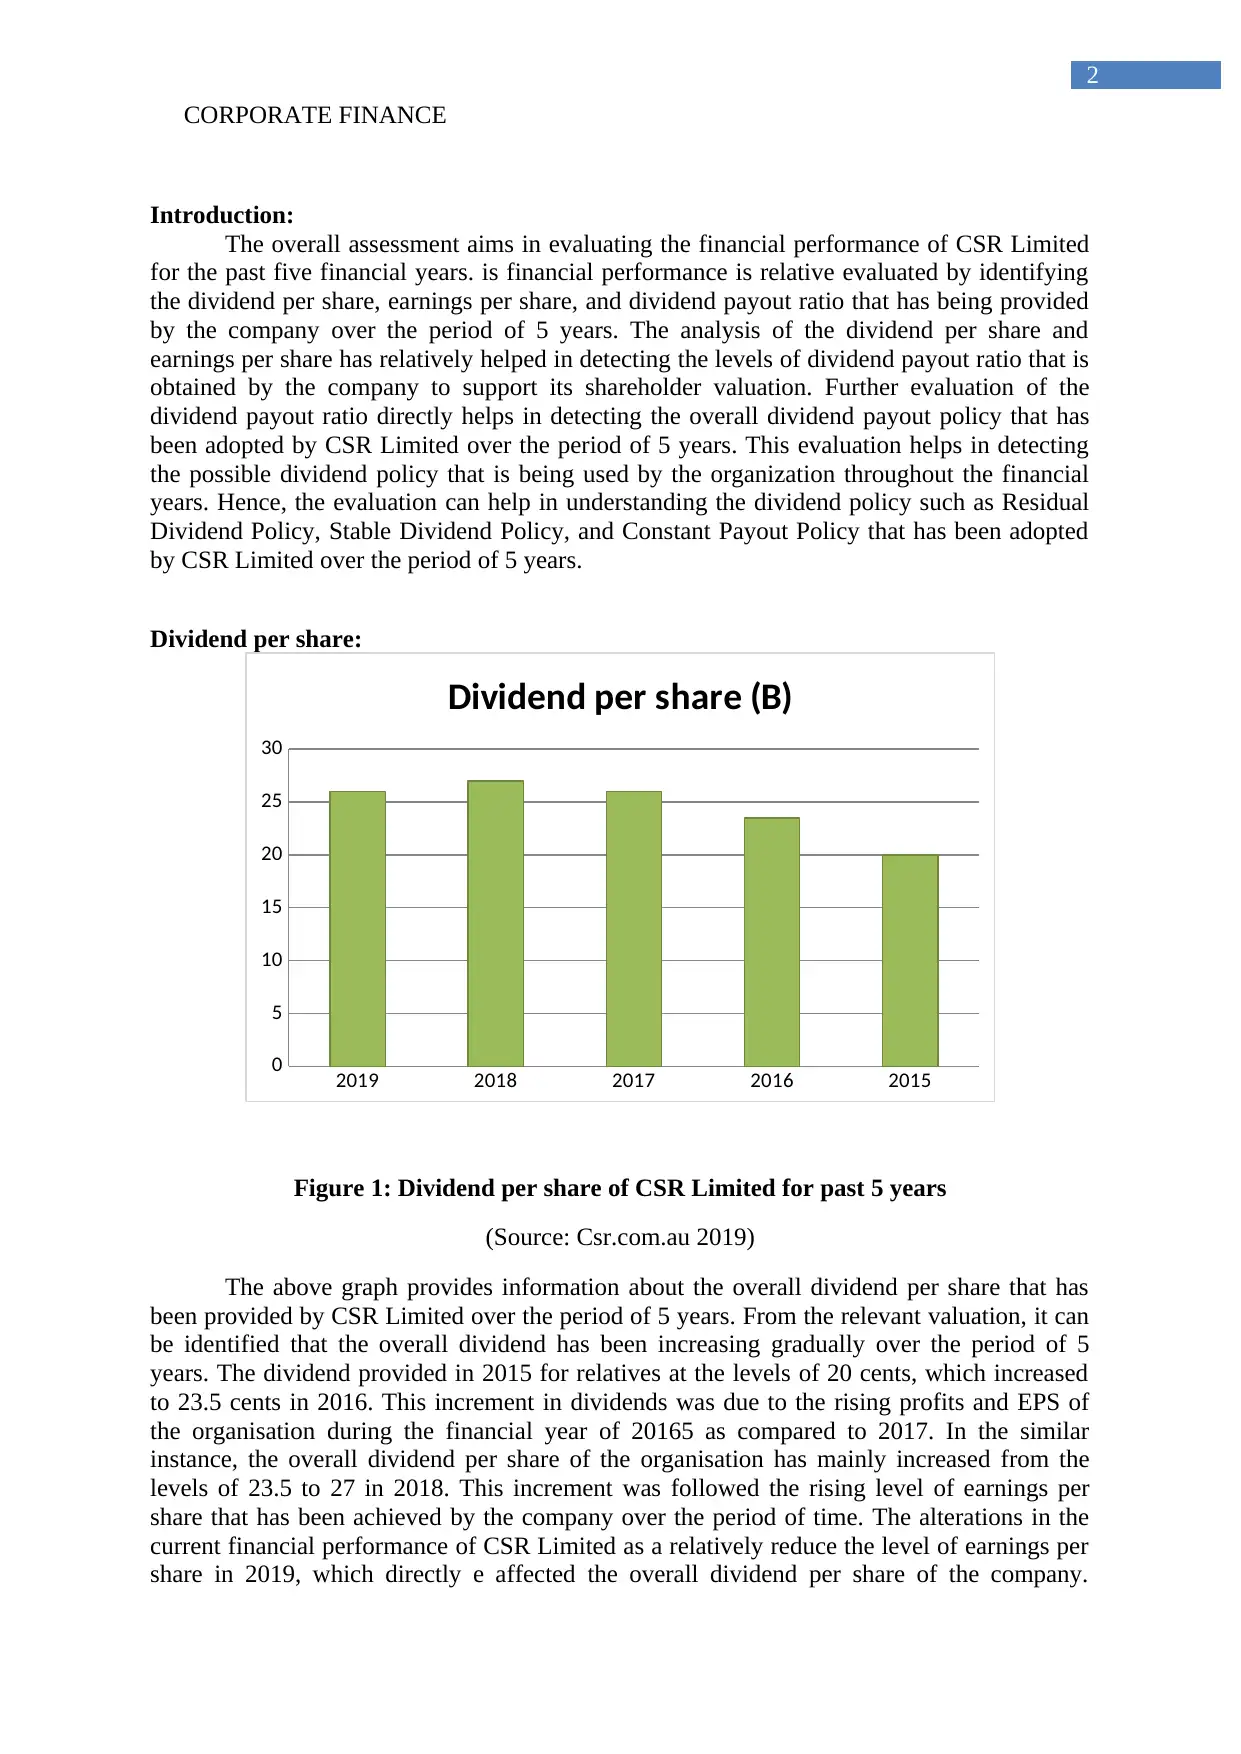
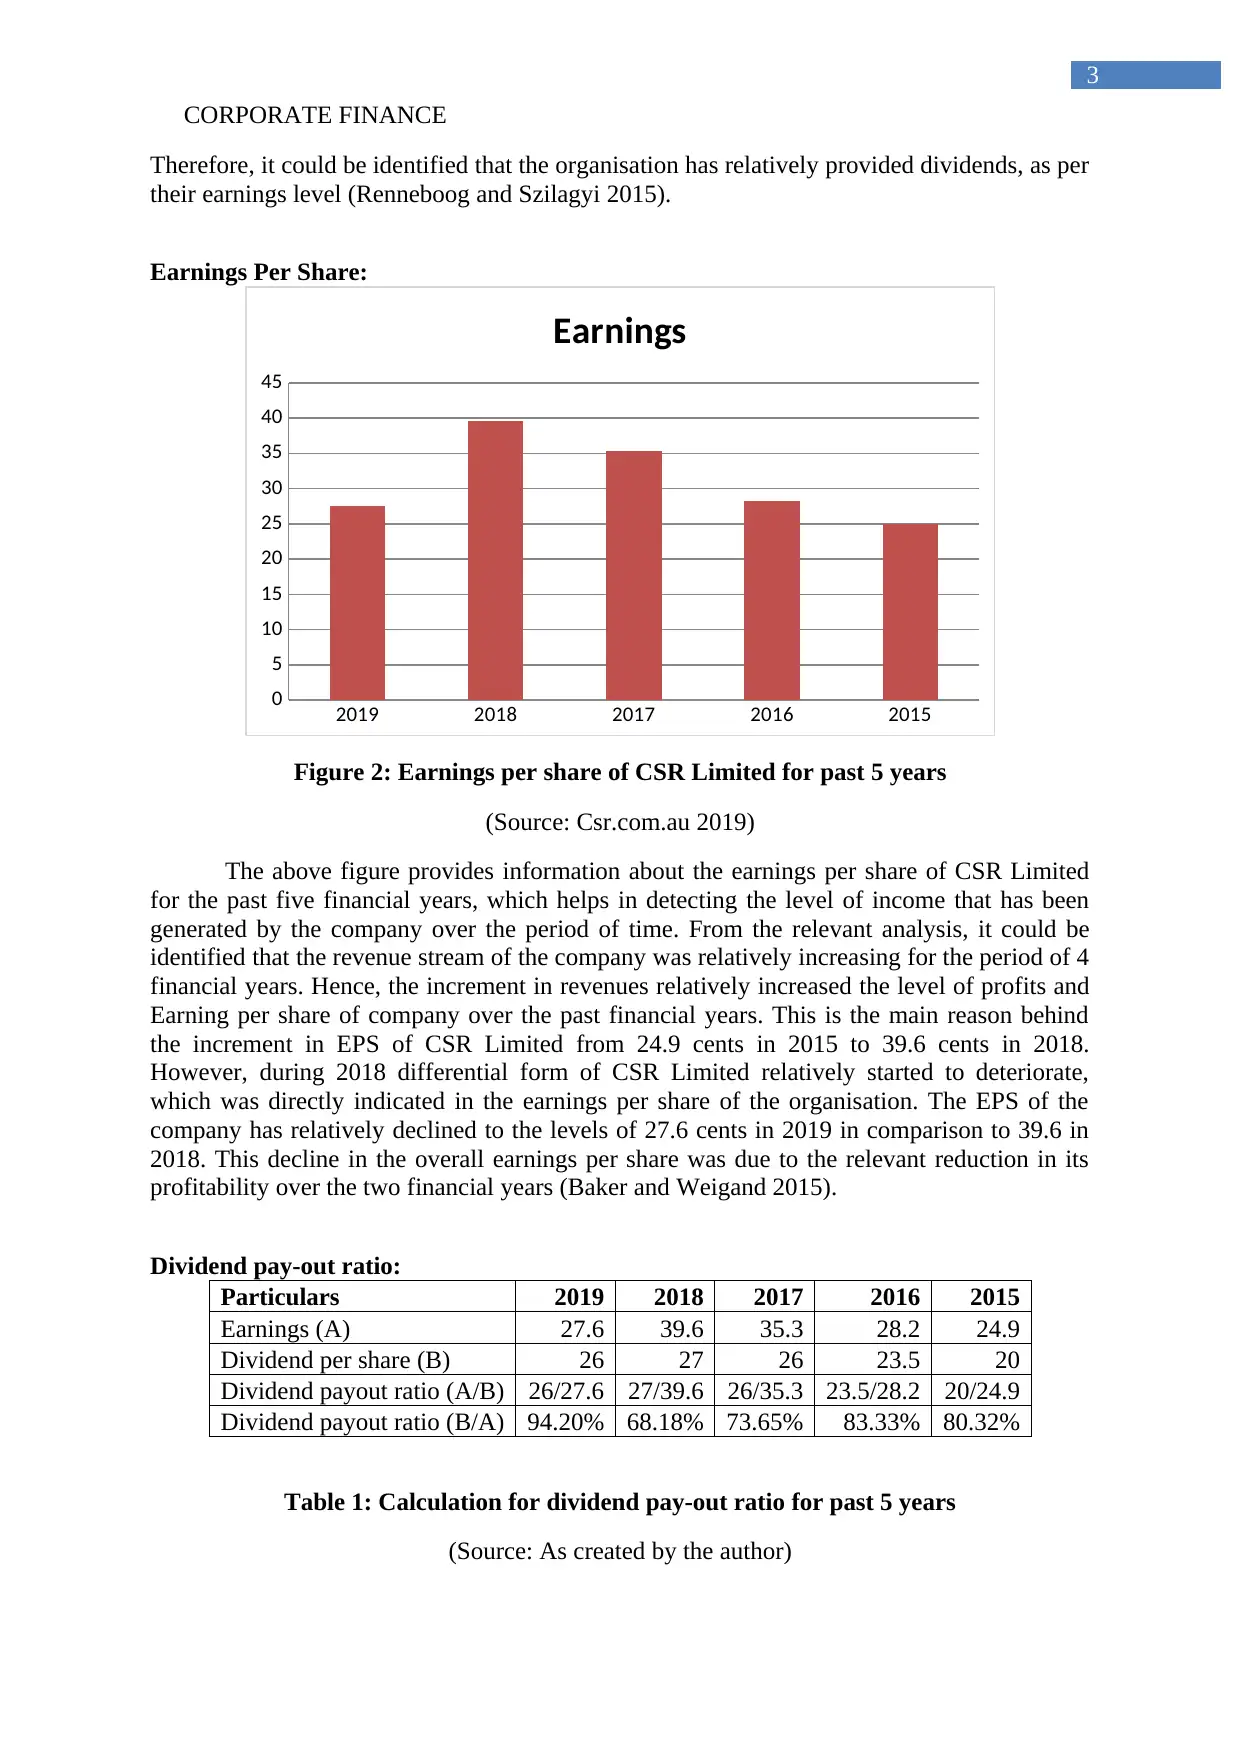
This report provides a financial analysis of CSR Limited over a five-year period, focusing on dividend policy and its relationship to the company's financial performance. The analysis includes an evaluation of dividend per share, earnings per share, and the dividend payout ratio. The study reveals that CSR Limited has consistently increased its dividends, reflecting a stable dividend policy. The report examines how the company's earnings influence dividend decisions and assesses the implications of the dividend payout ratio. The report also discusses the dividend policy adopted by CSR Limited, concluding that the company likely follows a stable dividend policy, as evidenced by its consistent dividend payments despite fluctuations in earnings. The report uses data from the company's annual reports and provides a comprehensive overview of CSR Limited's financial strategy and its impact on shareholder value.
Document Page
Running head: CORPORATE FINANCE
Corporate Finance
Name of the Student:
Name of the University:
Authors Note:
tabler-icon-diamond-filled.svg

Paraphrase This Document

Need a fresh take? Get an instant paraphrase of this document with our AI Paraphraser
Document Page
CORPORATE FINANCE
1
Table of Contents
Introduction:...............................................................................................................................2
Dividend per share:....................................................................................................................2
Earnings Per Share:....................................................................................................................3
Dividend pay-out ratio:..............................................................................................................3
Discussing which of the dividend pay-out policy is adopted by CSR:......................................4
Conclusion:................................................................................................................................5
Reference and Bibliography:......................................................................................................6
Document Page
CORPORATE FINANCE
2
Introduction:
The overall assessment aims in evaluating the financial performance of CSR Limited
for the past five financial years. is financial performance is relative evaluated by identifying
the dividend per share, earnings per share, and dividend payout ratio that has being provided
by the company over the period of 5 years. The analysis of the dividend per share and
earnings per share has relatively helped in detecting the levels of dividend payout ratio that is
obtained by the company to support its shareholder valuation. Further evaluation of the
dividend payout ratio directly helps in detecting the overall dividend payout policy that has
been adopted by CSR Limited over the period of 5 years. This evaluation helps in detecting
the possible dividend policy that is being used by the organization throughout the financial
years. Hence, the evaluation can help in understanding the dividend policy such as Residual
Dividend Policy, Stable Dividend Policy, and Constant Payout Policy that has been adopted
by CSR Limited over the period of 5 years.
Dividend per share:
2019 2018 2017 2016 2015
0
5
10
15
20
25
30
Dividend per share (B)
Figure 1: Dividend per share of CSR Limited for past 5 years
(Source: Csr.com.au 2019)
The above graph provides information about the overall dividend per share that has
been provided by CSR Limited over the period of 5 years. From the relevant valuation, it can
be identified that the overall dividend has been increasing gradually over the period of 5
years. The dividend provided in 2015 for relatives at the levels of 20 cents, which increased
to 23.5 cents in 2016. This increment in dividends was due to the rising profits and EPS of
the organisation during the financial year of 20165 as compared to 2017. In the similar
instance, the overall dividend per share of the organisation has mainly increased from the
levels of 23.5 to 27 in 2018. This increment was followed the rising level of earnings per
share that has been achieved by the company over the period of time. The alterations in the
current financial performance of CSR Limited as a relatively reduce the level of earnings per
share in 2019, which directly e affected the overall dividend per share of the company.
Document Page
CORPORATE FINANCE
3
Therefore, it could be identified that the organisation has relatively provided dividends, as per
their earnings level (Renneboog and Szilagyi 2015).
Earnings Per Share:
2019 2018 2017 2016 2015
0
5
10
15
20
25
30
35
40
45
Earnings
Figure 2: Earnings per share of CSR Limited for past 5 years
(Source: Csr.com.au 2019)
The above figure provides information about the earnings per share of CSR Limited
for the past five financial years, which helps in detecting the level of income that has been
generated by the company over the period of time. From the relevant analysis, it could be
identified that the revenue stream of the company was relatively increasing for the period of 4
financial years. Hence, the increment in revenues relatively increased the level of profits and
Earning per share of company over the past financial years. This is the main reason behind
the increment in EPS of CSR Limited from 24.9 cents in 2015 to 39.6 cents in 2018.
However, during 2018 differential form of CSR Limited relatively started to deteriorate,
which was directly indicated in the earnings per share of the organisation. The EPS of the
company has relatively declined to the levels of 27.6 cents in 2019 in comparison to 39.6 in
2018. This decline in the overall earnings per share was due to the relevant reduction in its
profitability over the two financial years (Baker and Weigand 2015).
Dividend pay-out ratio:
Particulars 2019 2018 2017 2016 2015
Earnings (A) 27.6 39.6 35.3 28.2 24.9
Dividend per share (B) 26 27 26 23.5 20
Dividend payout ratio (A/B) 26/27.6 27/39.6 26/35.3 23.5/28.2 20/24.9
Dividend payout ratio (B/A) 94.20% 68.18% 73.65% 83.33% 80.32%
Table 1: Calculation for dividend pay-out ratio for past 5 years
(Source: As created by the author)
tabler-icon-diamond-filled.svg

Paraphrase This Document

Need a fresh take? Get an instant paraphrase of this document with our AI Paraphraser
Document Page
CORPORATE FINANCE
4
2019 2018 2017 2016 2015
0.00%
10.00%
20.00%
30.00%
40.00%
50.00%
60.00%
70.00%
80.00%
90.00%
100.00%
Dividend payout ratio
Figure 3: Dividend pay-out ratio of CSR Limited for past 5 years
(Source: Csr.com.au 2019)
The above calculation and graph directly provides information about dividend pay-out
ratio of CSL Limited from 2015 to 2019. The calculations directly indicate that the company
has been providing regular dividend to investors in accordance with their earnings per share.
The change in dividend policy can be seen during the period of 2019, where the dividend
pay-out ratio has relative crossed more than 90% of the earnings per share. Previously the
company has relatively maintained a low dividend pay-out ratio of less than 85% of the
earnings per share. This restriction on the overall dividend pay-out ratio of the company was
not maintained during period of 2019. Dividend pay-out ratio of CSR Limited mainly
declined during the period of 2016 to 2018 when the actual earnings per share of the
organisation was relatively increasing. However, regardless of the decline in EPS value
during 2019 the company continued to pay higher dividend value. This mainly indicates that
the management aims to pay regular dividends to the investors regardless of the decline in
revenue during the financial years (Breuer, Rieger and Soypak 2014).
Discussing which of the dividend pay-out policy is adopted by CSR:
The analysis of the dividend policy of CSR has mainly helped in detecting whether
the management is using Residual Dividend Policy, Stable Dividend Policy, No dividend
policy or Constant Payout Policy. The analysis indicated that the organization is not using the
residual dividend policy, as the dividends have been provided without considering the capital
expenditure first. Hence, to could be identified that the organization is not using the residual
dividend policy method for providing the relevant dividends to the investors. In this similar
instance, the no dividend policy can also be ruled out, as the company has been providing
adequate dividends to the investors throughout the five-year period. Furthermore, the
constant dividend payout ratio can also be ruled out, as the company overall dividend per
share has been increasing over the period of five years (Maladjian and Khoury 2014).
Hence, from the analysis it can be detected that the organization has been using stable
dividend policy, as the company is paying adequate dividends to their shareholders. Further
evidence can be detected during the financial year of 2019, where the dividend pay-out ratio
of the company has increased to the levels of 90%. This mainly indicates that the company
Document Page
CORPORATE FINANCE
5
was prompted to provide stable dividends to the investors regardless of the reduction in their
EPS during the financial year (Jabbouri 2016).
Conclusion:
The above assessment has directly evaluated earnings per share, dividend per share,
dividend pay-out ratio of CSR Limited for the past 5 financial year. From the relevant
evaluation, it has been detected that the organisation has provided higher level of income to
the shareholders in form of dividends. The dividend pay-out ratio calculation has directly
indicated that and increment in pivot ratio of the company regardless of the decline in the
earnings per share. In addition, from the valuation of the dividend pay-out ratio it could be
identified that the company is relatively following stable dividend policy method, where
adequate dividends are provided investors for supporting the demand for its shares in the
capital market. Hence, the policy used by the management of CSR Limited is considered to
be adequate, as it helps in maintaining adequate demand for their shares and does not reduce
the share value in the capital market.
Document Page
CORPORATE FINANCE
6
Reference and Bibliography:
Al-Najjar, B. and Kilincarslan, E., 2016. The effect of ownership structure on dividend
policy: evidence from Turkey. Corporate Governance: The international journal of business
in society, 16(1), pp.135-161.
Asx.com.au. (2019). [online] Available at: https://www.asx.com.au/asx/share-price-
research/company/CSR [Accessed 23 May 2019].
Baker, H.K. and Weigand, R., 2015. Corporate dividend policy revisited. Managerial
Finance, 41(2), pp.126-144.
Breuer, W., Rieger, M.O. and Soypak, K.C., 2014. The behavioral foundations of corporate
dividend policy a cross-country analysis. Journal of Banking & Finance, 42, pp.247-265.
Csr.com.au. 2019. Annual Meetings and Reports. [online] Available at:
https://www.csr.com.au/investor-relations-and-news/annual-meetings-and-reports [Accessed
23 May 2019].
Fairchild, R., Guney, Y. and Thanatawee, Y., 2014. Corporate dividend policy in Thailand:
Theory and evidence. International Review of Financial Analysis, 31, pp.129-151.
González, M., Guzmán, A., Pombo, C. and Trujillo, M.A., 2014. Family involvement and
dividend policy in closely held firms. Family Business Review, 27(4), pp.365-385.
Jabbouri, I., 2016. Determinants of corporate dividend policy in emerging markets: Evidence
from MENA stock markets. Research in International Business and Finance, 37, pp.283-298.
Maladjian, C. and Khoury, R.E., 2014. Determinants of the dividend policy: an empirical
study on the Lebanese listed banks. International Journal of Economics and Finance, 6(4),
pp.240-256.
Renneboog, L. and Szilagyi, P.G., 2015. How relevant is dividend policy under low
shareholder protection?. Journal of International Financial Markets, Institutions and Money.
chevron_up_icon
1 out of 7
circle_padding
hide_on_mobile
zoom_out_icon
[object Object]