ECF2222 Corporate Finance: Investment Analysis and Capital Budgeting
VerifiedAdded on 2023/06/14
|15
|4909
|192
Report
AI Summary
This report provides a comprehensive analysis of capital budgeting techniques, focusing on Net Present Value (NPV) and Internal Rate of Return (IRR) for evaluating investment opportunities. It examines two alternative investment options for a company's trawler operations, detailing the preparation of schedules, incremental cash flow analysis, and determination of NPV and IRR for each alternative. The report applies the NPV infinity approach, conducts a break-even analysis at minimum market price and maximum operating cost, and presents a scenario analysis to assess the potential outcomes. Furthermore, it evaluates the option to lease versus buy, providing recommendations to the board of directors based on the long-term value of the firm. The analysis considers factors such as inflation rates, annual catch sizes, market prices, operating costs, and salvage values to determine the most viable investment strategy. Desklib offers a wealth of similar solved assignments and past papers to aid students in their studies.

Running head: FINANCE
Finance
Name of the Student
Name of the University
Authors Note
Course ID
Finance
Name of the Student
Name of the University
Authors Note
Course ID
Paraphrase This Document
Need a fresh take? Get an instant paraphrase of this document with our AI Paraphraser
1FINANCE
Table of Contents
Introduction:...............................................................................................................................2
Preparation of schedules:...........................................................................................................2
Incremental Cash flow:..............................................................................................................3
Determination of NPV and IRR for each Alternative:...............................................................4
Application of NPV infinity Approach:.....................................................................................6
Break even analysis at minimum market price and maximum operating cost:..........................7
Scenario Analysis:....................................................................................................................10
Recommendations of the scenarios:.........................................................................................11
Evaluation of option to lease:...................................................................................................11
Conclusion:..............................................................................................................................12
Reference List:.........................................................................................................................13
2FINANCE
Introduction:
The current report will be based on the understanding of the effective capital
budgeting tool in the process decision making. The current situation will be highlighting a
situation where the company would be taking into the consideration the two of most viable
opportunities in determining the best suitable method of ascertaining the benefits of two
investments. As evident the situation defines that where company has Trawler which could be
considered for another four years of use following which the trawler would be replaced. A
recommendation would be provided to the board of directors relating to the long term value
of the firm. The report will be considering the alternative that are involved in the different
time span with appropriate recommendations to the board of directors.
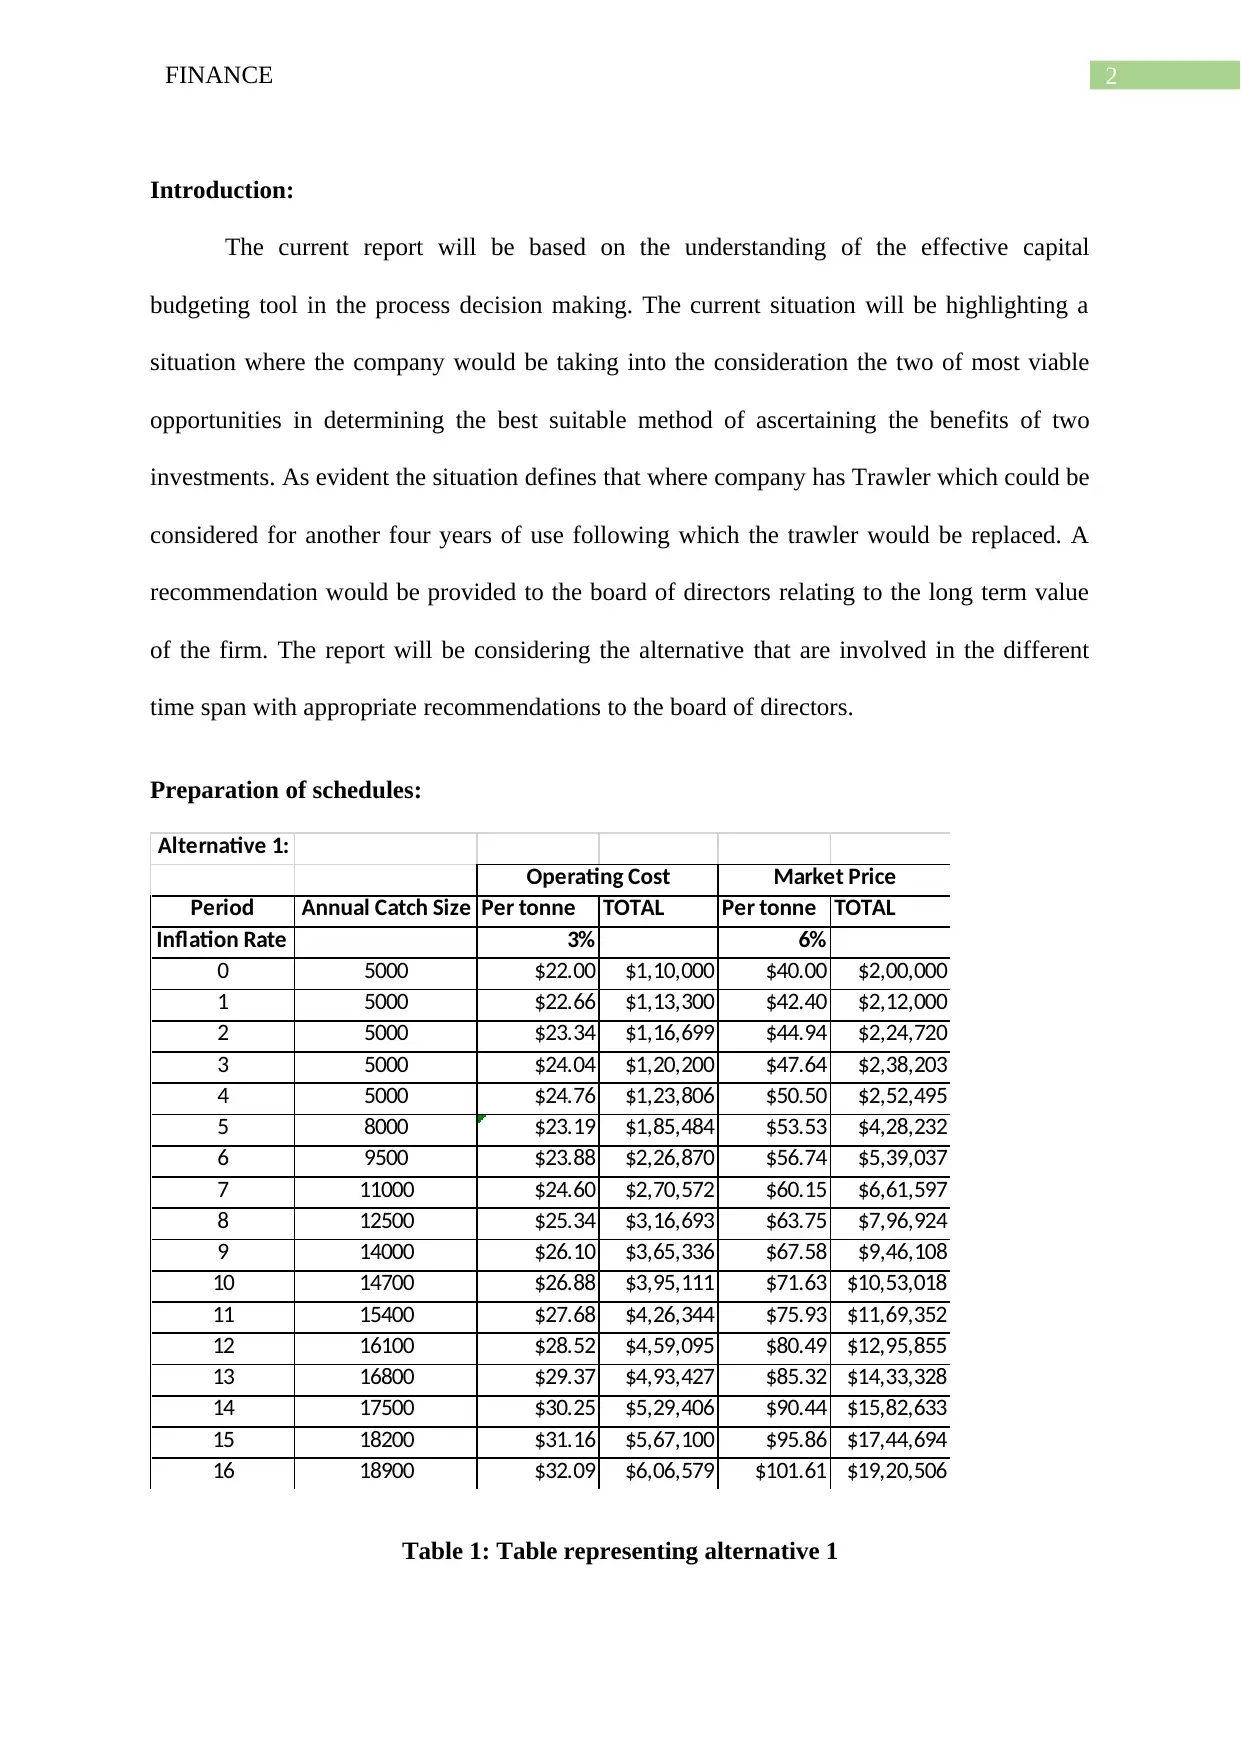
Preparation of schedules:
Alternative 1:
Period Annual Catch Size Per tonne TOTAL Per tonne TOTAL
Inflation Rate 3% 6%
0 5000 $22.00 $1,10,000 $40.00 $2,00,000
1 5000 $22.66 $1,13,300 $42.40 $2,12,000
2 5000 $23.34 $1,16,699 $44.94 $2,24,720
3 5000 $24.04 $1,20,200 $47.64 $2,38,203
4 5000 $24.76 $1,23,806 $50.50 $2,52,495
5 8000 $23.19 $1,85,484 $53.53 $4,28,232
6 9500 $23.88 $2,26,870 $56.74 $5,39,037
7 11000 $24.60 $2,70,572 $60.15 $6,61,597
8 12500 $25.34 $3,16,693 $63.75 $7,96,924
9 14000 $26.10 $3,65,336 $67.58 $9,46,108
10 14700 $26.88 $3,95,111 $71.63 $10,53,018
11 15400 $27.68 $4,26,344 $75.93 $11,69,352
12 16100 $28.52 $4,59,095 $80.49 $12,95,855
13 16800 $29.37 $4,93,427 $85.32 $14,33,328
14 17500 $30.25 $5,29,406 $90.44 $15,82,633
15 18200 $31.16 $5,67,100 $95.86 $17,44,694
16 18900 $32.09 $6,06,579 $101.61 $19,20,506
Operating Cost Market Price
Table 1: Table representing alternative 1
Introduction:
The current report will be based on the understanding of the effective capital
budgeting tool in the process decision making. The current situation will be highlighting a
situation where the company would be taking into the consideration the two of most viable
opportunities in determining the best suitable method of ascertaining the benefits of two
investments. As evident the situation defines that where company has Trawler which could be
considered for another four years of use following which the trawler would be replaced. A
recommendation would be provided to the board of directors relating to the long term value
of the firm. The report will be considering the alternative that are involved in the different
time span with appropriate recommendations to the board of directors.
Preparation of schedules:
Alternative 1:
Period Annual Catch Size Per tonne TOTAL Per tonne TOTAL
Inflation Rate 3% 6%
0 5000 $22.00 $1,10,000 $40.00 $2,00,000
1 5000 $22.66 $1,13,300 $42.40 $2,12,000
2 5000 $23.34 $1,16,699 $44.94 $2,24,720
3 5000 $24.04 $1,20,200 $47.64 $2,38,203
4 5000 $24.76 $1,23,806 $50.50 $2,52,495
5 8000 $23.19 $1,85,484 $53.53 $4,28,232
6 9500 $23.88 $2,26,870 $56.74 $5,39,037
7 11000 $24.60 $2,70,572 $60.15 $6,61,597
8 12500 $25.34 $3,16,693 $63.75 $7,96,924
9 14000 $26.10 $3,65,336 $67.58 $9,46,108
10 14700 $26.88 $3,95,111 $71.63 $10,53,018
11 15400 $27.68 $4,26,344 $75.93 $11,69,352
12 16100 $28.52 $4,59,095 $80.49 $12,95,855
13 16800 $29.37 $4,93,427 $85.32 $14,33,328
14 17500 $30.25 $5,29,406 $90.44 $15,82,633
15 18200 $31.16 $5,67,100 $95.86 $17,44,694
16 18900 $32.09 $6,06,579 $101.61 $19,20,506
Operating Cost Market Price
Table 1: Table representing alternative 1
⊘ This is a preview!⊘
Do you want full access?
Subscribe today to unlock all pages.
Trusted by 1+ million students worldwide
3FINANCE
(Source: As Created by Author)
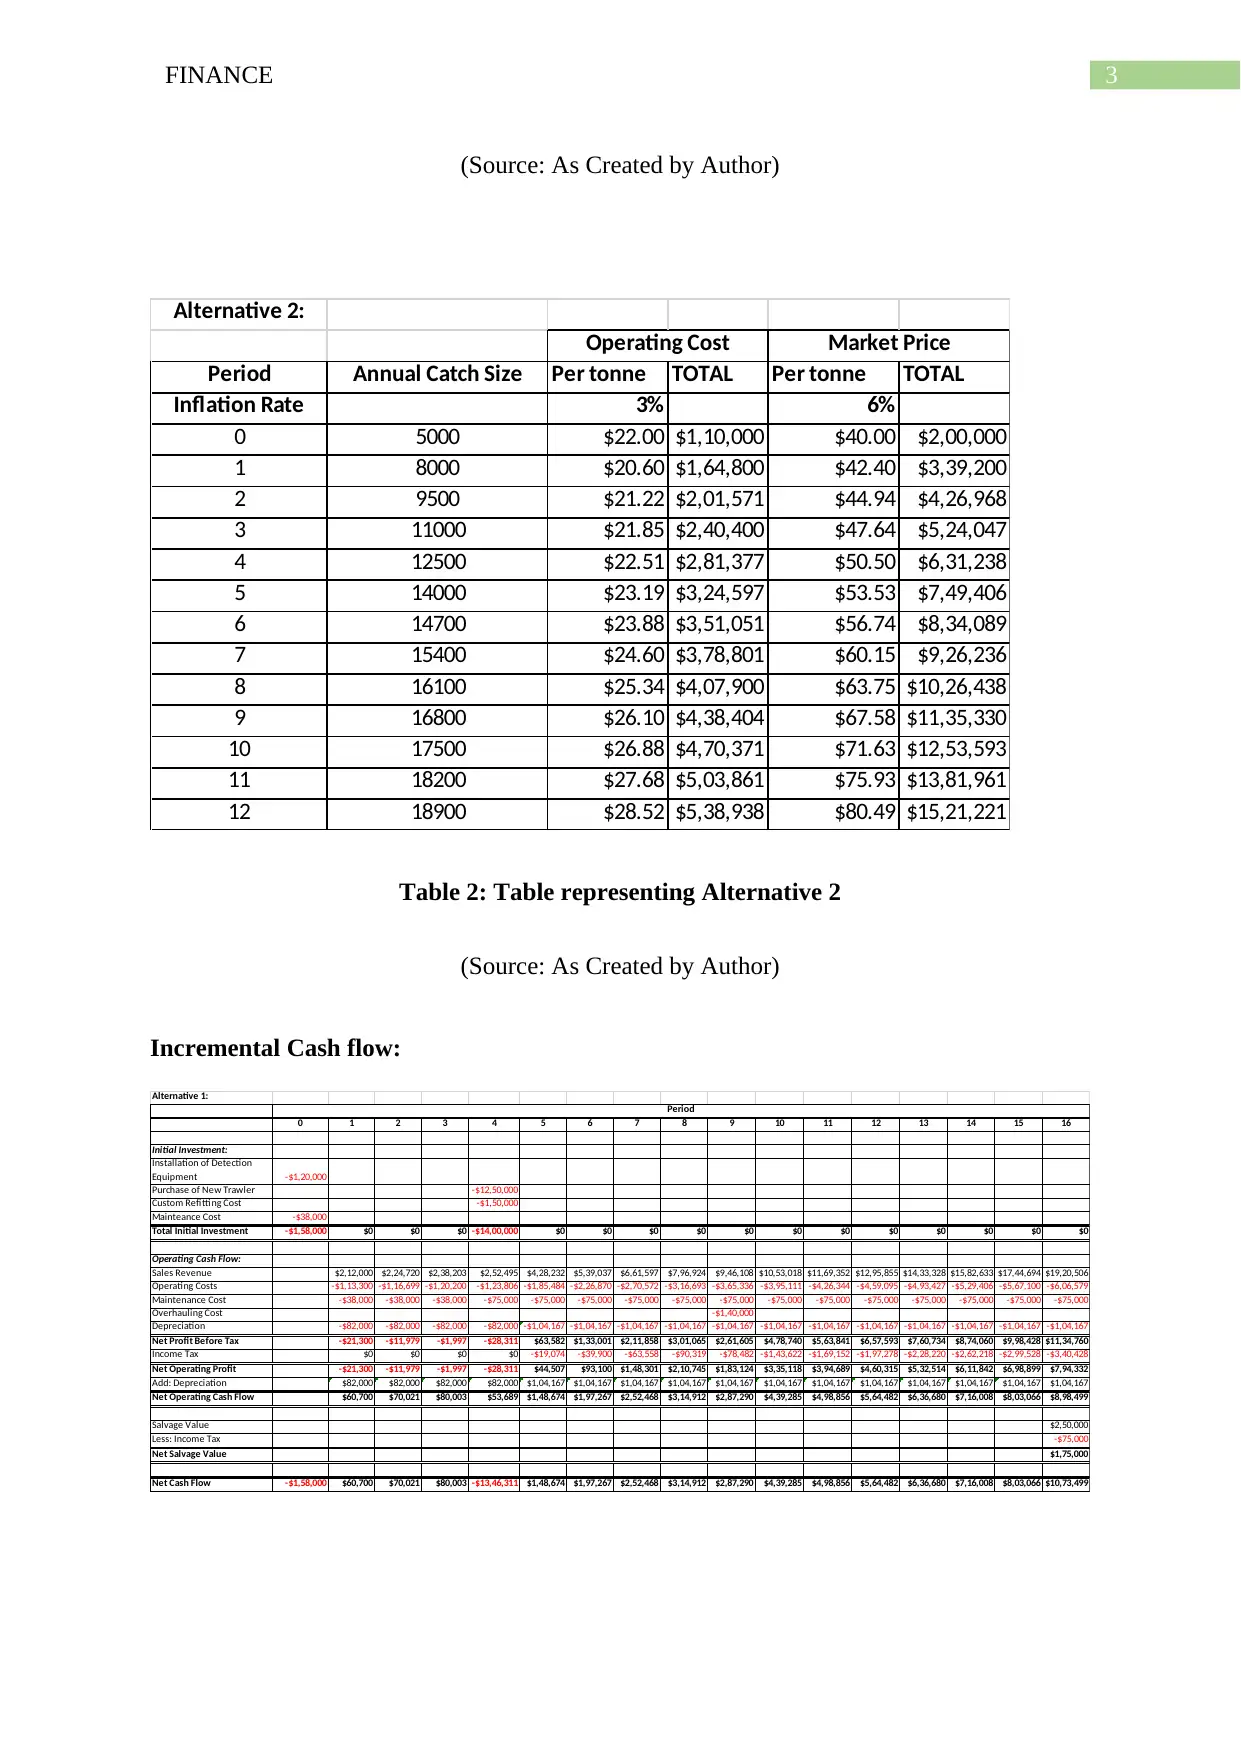
Alternative 2:
Period Annual Catch Size Per tonne TOTAL Per tonne TOTAL
Inflation Rate 3% 6%
0 5000 $22.00 $1,10,000 $40.00 $2,00,000
1 8000 $20.60 $1,64,800 $42.40 $3,39,200
2 9500 $21.22 $2,01,571 $44.94 $4,26,968
3 11000 $21.85 $2,40,400 $47.64 $5,24,047
4 12500 $22.51 $2,81,377 $50.50 $6,31,238
5 14000 $23.19 $3,24,597 $53.53 $7,49,406
6 14700 $23.88 $3,51,051 $56.74 $8,34,089
7 15400 $24.60 $3,78,801 $60.15 $9,26,236
8 16100 $25.34 $4,07,900 $63.75 $10,26,438
9 16800 $26.10 $4,38,404 $67.58 $11,35,330
10 17500 $26.88 $4,70,371 $71.63 $12,53,593
11 18200 $27.68 $5,03,861 $75.93 $13,81,961
12 18900 $28.52 $5,38,938 $80.49 $15,21,221
Operating Cost Market Price
Table 2: Table representing Alternative 2
(Source: As Created by Author)
Incremental Cash flow:
Alternative 1:
0 1 2 3 4 5 6 7 8 9 10 11 12 13 14 15 16
Initial Investment:
Installation of Detection
Equipment -$1,20,000
Purchase of New Trawler -$12,50,000
Custom Refitting Cost -$1,50,000
Mainteance Cost -$38,000
Total Initial Investment -$1,58,000 $0 $0 $0 -$14,00,000 $0 $0 $0 $0 $0 $0 $0 $0 $0 $0 $0 $0
Operating Cash Flow:
Sales Revenue $2,12,000 $2,24,720 $2,38,203 $2,52,495 $4,28,232 $5,39,037 $6,61,597 $7,96,924 $9,46,108 $10,53,018 $11,69,352 $12,95,855 $14,33,328 $15,82,633 $17,44,694 $19,20,506
Operating Costs -$1,13,300 -$1,16,699 -$1,20,200 -$1,23,806 -$1,85,484 -$2,26,870 -$2,70,572 -$3,16,693 -$3,65,336 -$3,95,111 -$4,26,344 -$4,59,095 -$4,93,427 -$5,29,406 -$5,67,100 -$6,06,579
Maintenance Cost -$38,000 -$38,000 -$38,000 -$75,000 -$75,000 -$75,000 -$75,000 -$75,000 -$75,000 -$75,000 -$75,000 -$75,000 -$75,000 -$75,000 -$75,000 -$75,000
Overhauling Cost -$1,40,000
Depreciation -$82,000 -$82,000 -$82,000 -$82,000 -$1,04,167 -$1,04,167 -$1,04,167 -$1,04,167 -$1,04,167 -$1,04,167 -$1,04,167 -$1,04,167 -$1,04,167 -$1,04,167 -$1,04,167 -$1,04,167
Net Profit Before Tax -$21,300 -$11,979 -$1,997 -$28,311 $63,582 $1,33,001 $2,11,858 $3,01,065 $2,61,605 $4,78,740 $5,63,841 $6,57,593 $7,60,734 $8,74,060 $9,98,428 $11,34,760
Income Tax $0 $0 $0 $0 -$19,074 -$39,900 -$63,558 -$90,319 -$78,482 -$1,43,622 -$1,69,152 -$1,97,278 -$2,28,220 -$2,62,218 -$2,99,528 -$3,40,428
Net Operating Profit -$21,300 -$11,979 -$1,997 -$28,311 $44,507 $93,100 $1,48,301 $2,10,745 $1,83,124 $3,35,118 $3,94,689 $4,60,315 $5,32,514 $6,11,842 $6,98,899 $7,94,332
Add: Depreciation $82,000 $82,000 $82,000 $82,000 $1,04,167 $1,04,167 $1,04,167 $1,04,167 $1,04,167 $1,04,167 $1,04,167 $1,04,167 $1,04,167 $1,04,167 $1,04,167 $1,04,167
Net Operating Cash Flow $60,700 $70,021 $80,003 $53,689 $1,48,674 $1,97,267 $2,52,468 $3,14,912 $2,87,290 $4,39,285 $4,98,856 $5,64,482 $6,36,680 $7,16,008 $8,03,066 $8,98,499
Salvage Value $2,50,000
Less: Income Tax -$75,000
Net Salvage Value $1,75,000
Net Cash Flow -$1,58,000 $60,700 $70,021 $80,003 -$13,46,311 $1,48,674 $1,97,267 $2,52,468 $3,14,912 $2,87,290 $4,39,285 $4,98,856 $5,64,482 $6,36,680 $7,16,008 $8,03,066 $10,73,499
Period
(Source: As Created by Author)
Alternative 2:
Period Annual Catch Size Per tonne TOTAL Per tonne TOTAL
Inflation Rate 3% 6%
0 5000 $22.00 $1,10,000 $40.00 $2,00,000
1 8000 $20.60 $1,64,800 $42.40 $3,39,200
2 9500 $21.22 $2,01,571 $44.94 $4,26,968
3 11000 $21.85 $2,40,400 $47.64 $5,24,047
4 12500 $22.51 $2,81,377 $50.50 $6,31,238
5 14000 $23.19 $3,24,597 $53.53 $7,49,406
6 14700 $23.88 $3,51,051 $56.74 $8,34,089
7 15400 $24.60 $3,78,801 $60.15 $9,26,236
8 16100 $25.34 $4,07,900 $63.75 $10,26,438
9 16800 $26.10 $4,38,404 $67.58 $11,35,330
10 17500 $26.88 $4,70,371 $71.63 $12,53,593
11 18200 $27.68 $5,03,861 $75.93 $13,81,961
12 18900 $28.52 $5,38,938 $80.49 $15,21,221
Operating Cost Market Price
Table 2: Table representing Alternative 2
(Source: As Created by Author)
Incremental Cash flow:
Alternative 1:
0 1 2 3 4 5 6 7 8 9 10 11 12 13 14 15 16
Initial Investment:
Installation of Detection
Equipment -$1,20,000
Purchase of New Trawler -$12,50,000
Custom Refitting Cost -$1,50,000
Mainteance Cost -$38,000
Total Initial Investment -$1,58,000 $0 $0 $0 -$14,00,000 $0 $0 $0 $0 $0 $0 $0 $0 $0 $0 $0 $0
Operating Cash Flow:
Sales Revenue $2,12,000 $2,24,720 $2,38,203 $2,52,495 $4,28,232 $5,39,037 $6,61,597 $7,96,924 $9,46,108 $10,53,018 $11,69,352 $12,95,855 $14,33,328 $15,82,633 $17,44,694 $19,20,506
Operating Costs -$1,13,300 -$1,16,699 -$1,20,200 -$1,23,806 -$1,85,484 -$2,26,870 -$2,70,572 -$3,16,693 -$3,65,336 -$3,95,111 -$4,26,344 -$4,59,095 -$4,93,427 -$5,29,406 -$5,67,100 -$6,06,579
Maintenance Cost -$38,000 -$38,000 -$38,000 -$75,000 -$75,000 -$75,000 -$75,000 -$75,000 -$75,000 -$75,000 -$75,000 -$75,000 -$75,000 -$75,000 -$75,000 -$75,000
Overhauling Cost -$1,40,000
Depreciation -$82,000 -$82,000 -$82,000 -$82,000 -$1,04,167 -$1,04,167 -$1,04,167 -$1,04,167 -$1,04,167 -$1,04,167 -$1,04,167 -$1,04,167 -$1,04,167 -$1,04,167 -$1,04,167 -$1,04,167
Net Profit Before Tax -$21,300 -$11,979 -$1,997 -$28,311 $63,582 $1,33,001 $2,11,858 $3,01,065 $2,61,605 $4,78,740 $5,63,841 $6,57,593 $7,60,734 $8,74,060 $9,98,428 $11,34,760
Income Tax $0 $0 $0 $0 -$19,074 -$39,900 -$63,558 -$90,319 -$78,482 -$1,43,622 -$1,69,152 -$1,97,278 -$2,28,220 -$2,62,218 -$2,99,528 -$3,40,428
Net Operating Profit -$21,300 -$11,979 -$1,997 -$28,311 $44,507 $93,100 $1,48,301 $2,10,745 $1,83,124 $3,35,118 $3,94,689 $4,60,315 $5,32,514 $6,11,842 $6,98,899 $7,94,332
Add: Depreciation $82,000 $82,000 $82,000 $82,000 $1,04,167 $1,04,167 $1,04,167 $1,04,167 $1,04,167 $1,04,167 $1,04,167 $1,04,167 $1,04,167 $1,04,167 $1,04,167 $1,04,167
Net Operating Cash Flow $60,700 $70,021 $80,003 $53,689 $1,48,674 $1,97,267 $2,52,468 $3,14,912 $2,87,290 $4,39,285 $4,98,856 $5,64,482 $6,36,680 $7,16,008 $8,03,066 $8,98,499
Salvage Value $2,50,000
Less: Income Tax -$75,000
Net Salvage Value $1,75,000
Net Cash Flow -$1,58,000 $60,700 $70,021 $80,003 -$13,46,311 $1,48,674 $1,97,267 $2,52,468 $3,14,912 $2,87,290 $4,39,285 $4,98,856 $5,64,482 $6,36,680 $7,16,008 $8,03,066 $10,73,499
Period
Paraphrase This Document
Need a fresh take? Get an instant paraphrase of this document with our AI Paraphraser
4FINANCE
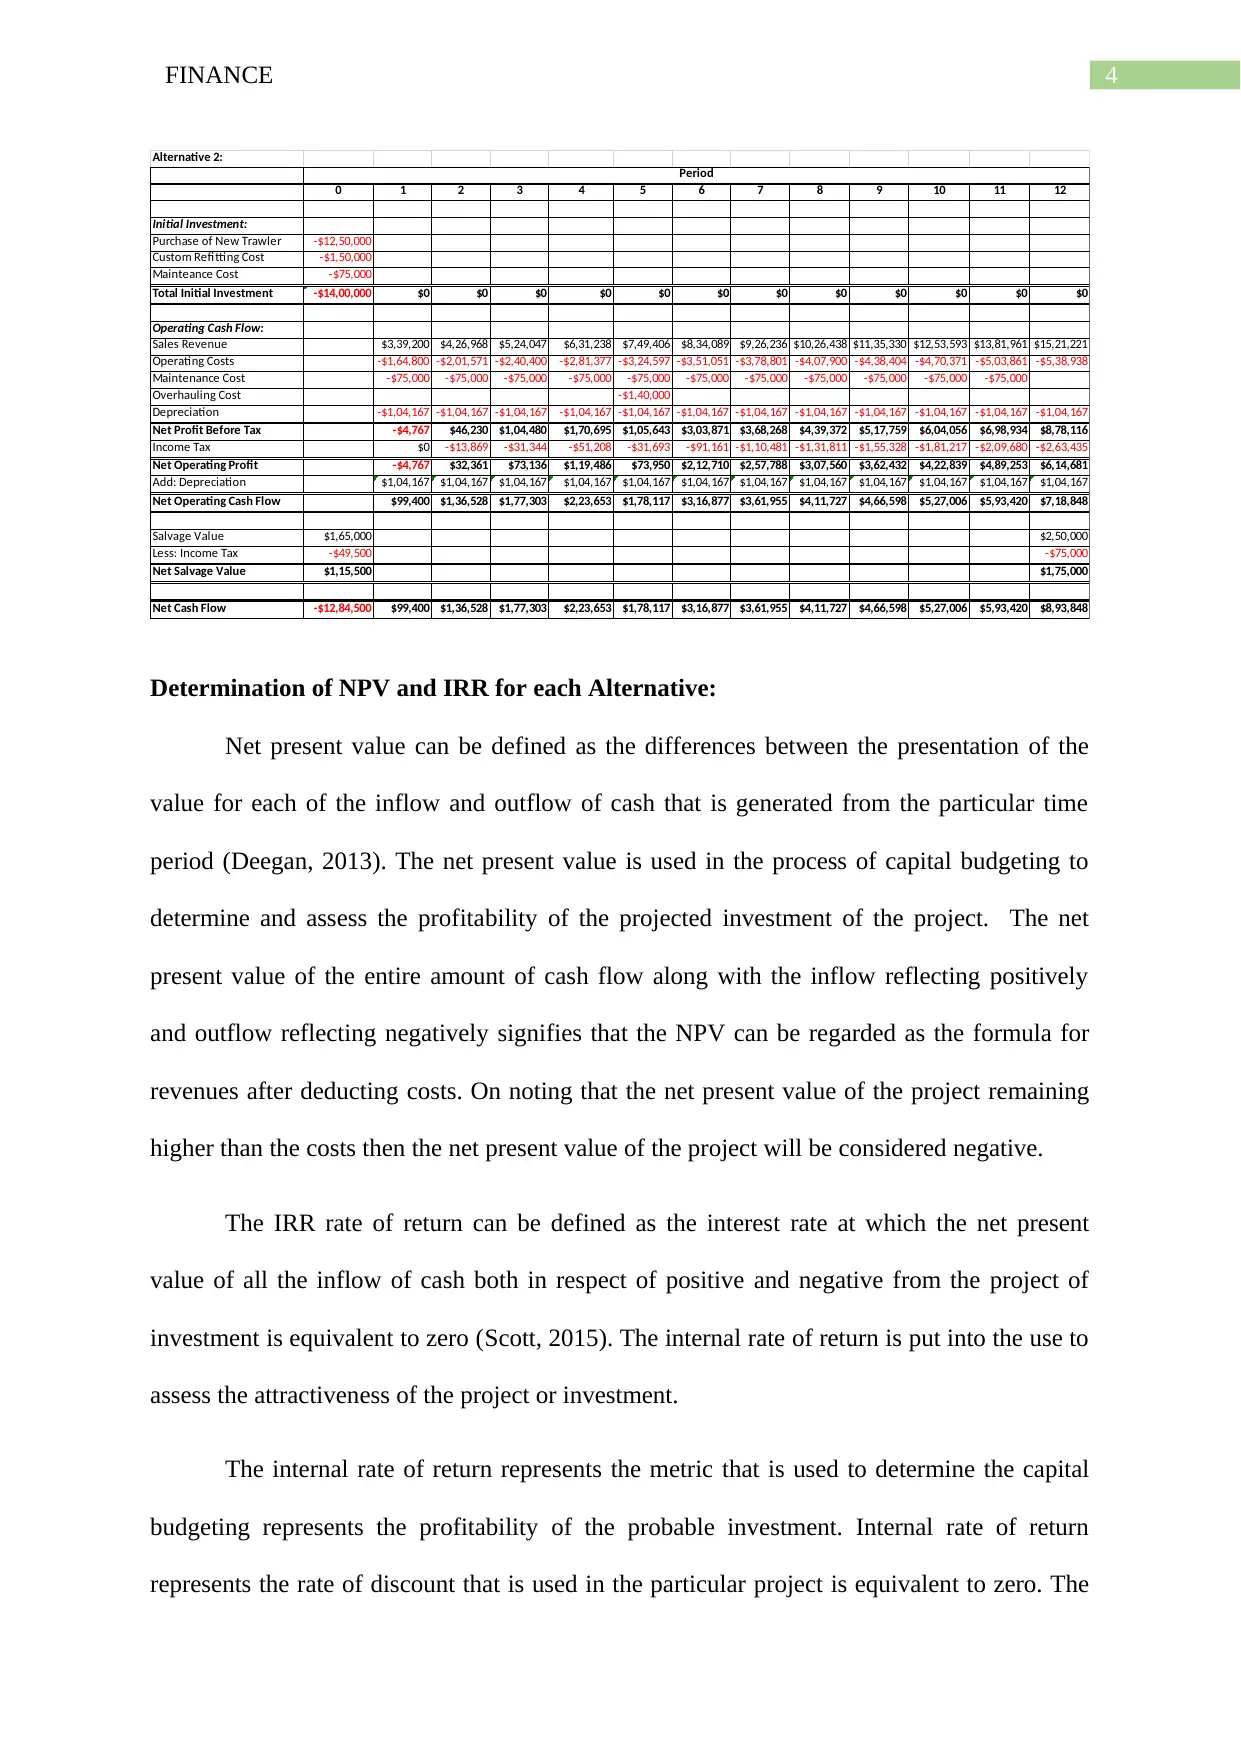
Alternative 2:
0 1 2 3 4 5 6 7 8 9 10 11 12
Initial Investment:
Purchase of New Trawler -$12,50,000
Custom Refitting Cost -$1,50,000
Mainteance Cost -$75,000
Total Initial Investment -$14,00,000 $0 $0 $0 $0 $0 $0 $0 $0 $0 $0 $0 $0
Operating Cash Flow:
Sales Revenue $3,39,200 $4,26,968 $5,24,047 $6,31,238 $7,49,406 $8,34,089 $9,26,236 $10,26,438 $11,35,330 $12,53,593 $13,81,961 $15,21,221
Operating Costs -$1,64,800 -$2,01,571 -$2,40,400 -$2,81,377 -$3,24,597 -$3,51,051 -$3,78,801 -$4,07,900 -$4,38,404 -$4,70,371 -$5,03,861 -$5,38,938
Maintenance Cost -$75,000 -$75,000 -$75,000 -$75,000 -$75,000 -$75,000 -$75,000 -$75,000 -$75,000 -$75,000 -$75,000
Overhauling Cost -$1,40,000
Depreciation -$1,04,167 -$1,04,167 -$1,04,167 -$1,04,167 -$1,04,167 -$1,04,167 -$1,04,167 -$1,04,167 -$1,04,167 -$1,04,167 -$1,04,167 -$1,04,167
Net Profit Before Tax -$4,767 $46,230 $1,04,480 $1,70,695 $1,05,643 $3,03,871 $3,68,268 $4,39,372 $5,17,759 $6,04,056 $6,98,934 $8,78,116
Income Tax $0 -$13,869 -$31,344 -$51,208 -$31,693 -$91,161 -$1,10,481 -$1,31,811 -$1,55,328 -$1,81,217 -$2,09,680 -$2,63,435
Net Operating Profit -$4,767 $32,361 $73,136 $1,19,486 $73,950 $2,12,710 $2,57,788 $3,07,560 $3,62,432 $4,22,839 $4,89,253 $6,14,681
Add: Depreciation $1,04,167 $1,04,167 $1,04,167 $1,04,167 $1,04,167 $1,04,167 $1,04,167 $1,04,167 $1,04,167 $1,04,167 $1,04,167 $1,04,167
Net Operating Cash Flow $99,400 $1,36,528 $1,77,303 $2,23,653 $1,78,117 $3,16,877 $3,61,955 $4,11,727 $4,66,598 $5,27,006 $5,93,420 $7,18,848
Salvage Value $1,65,000 $2,50,000
Less: Income Tax -$49,500 -$75,000
Net Salvage Value $1,15,500 $1,75,000
Net Cash Flow -$12,84,500 $99,400 $1,36,528 $1,77,303 $2,23,653 $1,78,117 $3,16,877 $3,61,955 $4,11,727 $4,66,598 $5,27,006 $5,93,420 $8,93,848
Period
Determination of NPV and IRR for each Alternative:
Net present value can be defined as the differences between the presentation of the
value for each of the inflow and outflow of cash that is generated from the particular time
period (Deegan, 2013). The net present value is used in the process of capital budgeting to
determine and assess the profitability of the projected investment of the project. The net
present value of the entire amount of cash flow along with the inflow reflecting positively
and outflow reflecting negatively signifies that the NPV can be regarded as the formula for
revenues after deducting costs. On noting that the net present value of the project remaining
higher than the costs then the net present value of the project will be considered negative.
The IRR rate of return can be defined as the interest rate at which the net present
value of all the inflow of cash both in respect of positive and negative from the project of
investment is equivalent to zero (Scott, 2015). The internal rate of return is put into the use to
assess the attractiveness of the project or investment.
The internal rate of return represents the metric that is used to determine the capital
budgeting represents the profitability of the probable investment. Internal rate of return
represents the rate of discount that is used in the particular project is equivalent to zero. The
5FINANCE
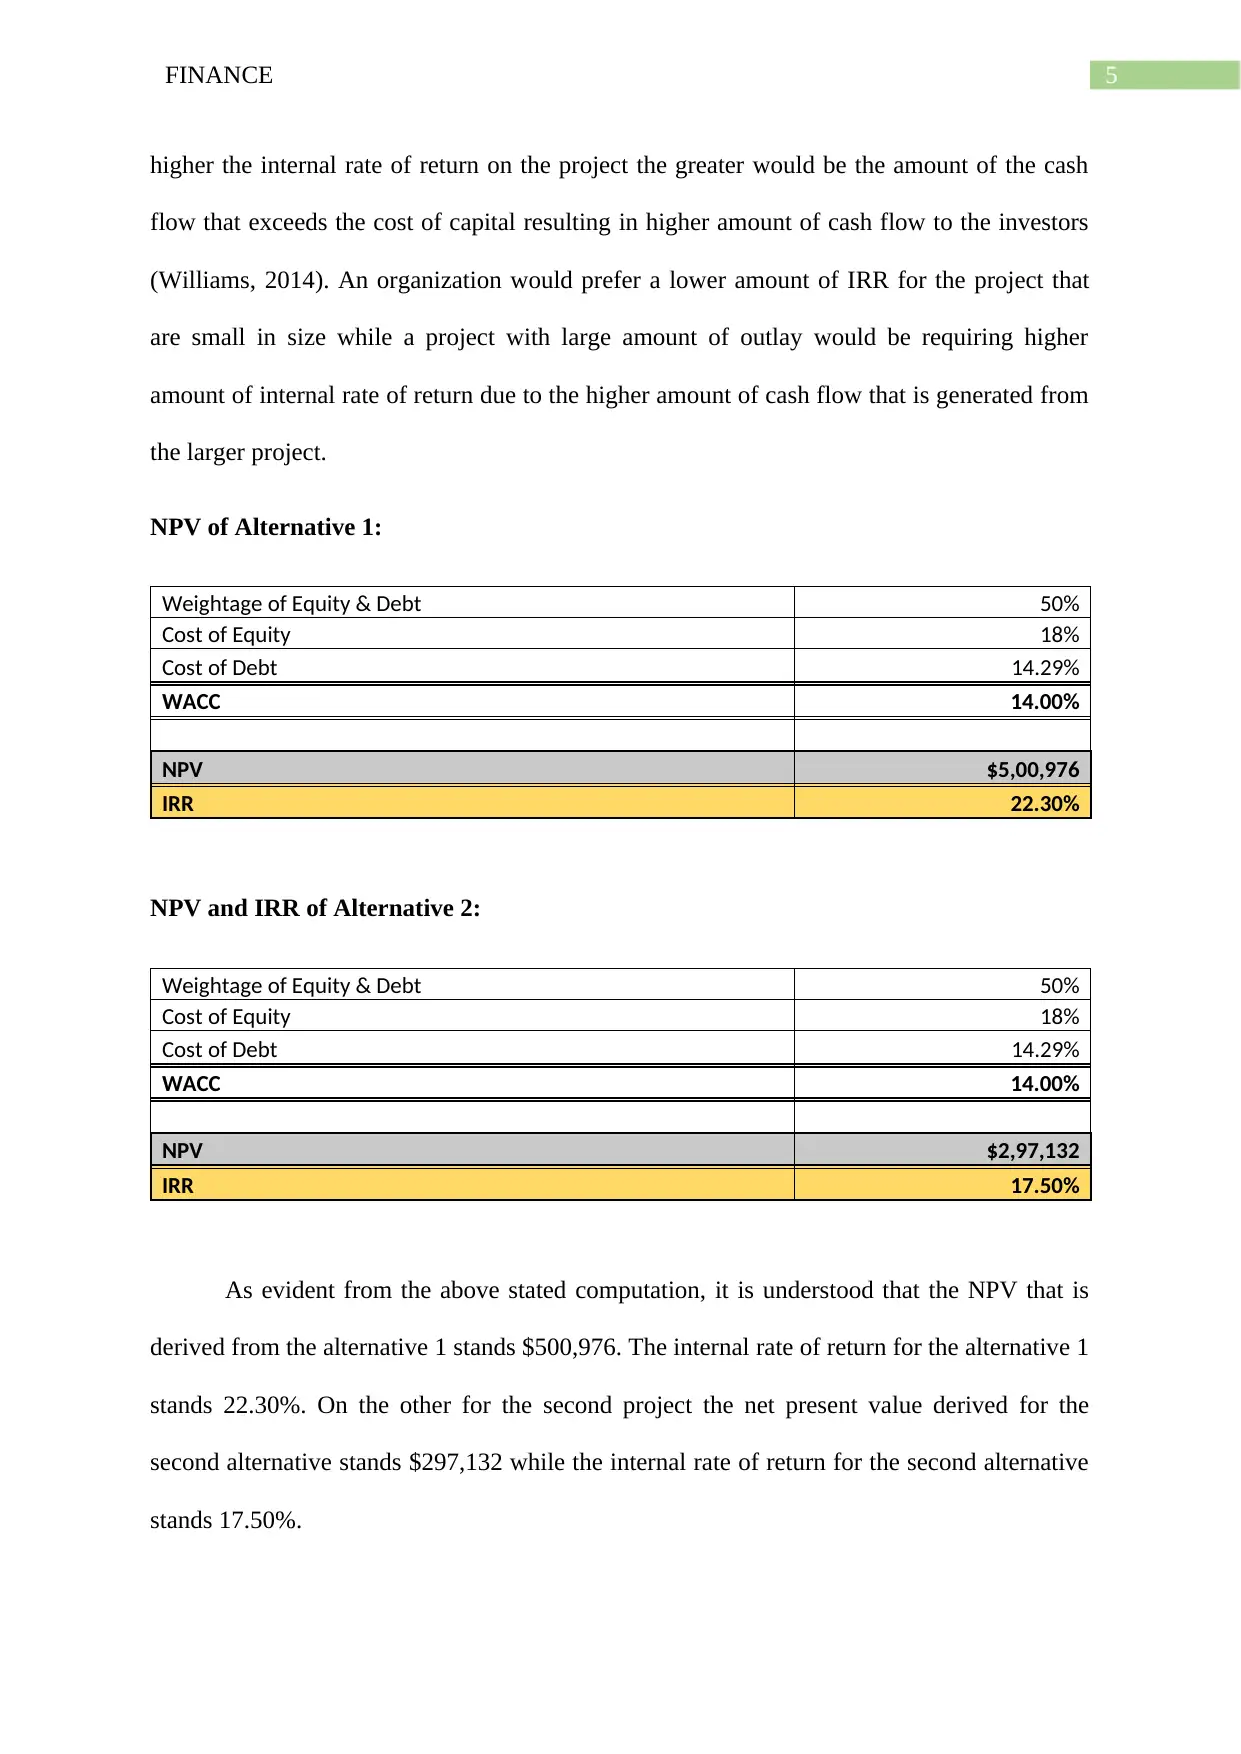
higher the internal rate of return on the project the greater would be the amount of the cash
flow that exceeds the cost of capital resulting in higher amount of cash flow to the investors
(Williams, 2014). An organization would prefer a lower amount of IRR for the project that
are small in size while a project with large amount of outlay would be requiring higher
amount of internal rate of return due to the higher amount of cash flow that is generated from
the larger project.
NPV of Alternative 1:
Weightage of Equity & Debt 50%
Cost of Equity 18%
Cost of Debt 14.29%
WACC 14.00%
NPV $5,00,976
IRR 22.30%
NPV and IRR of Alternative 2:
Weightage of Equity & Debt 50%
Cost of Equity 18%
Cost of Debt 14.29%
WACC 14.00%
NPV $2,97,132
IRR 17.50%
As evident from the above stated computation, it is understood that the NPV that is
derived from the alternative 1 stands $500,976. The internal rate of return for the alternative 1
stands 22.30%. On the other for the second project the net present value derived for the
second alternative stands $297,132 while the internal rate of return for the second alternative
stands 17.50%.
⊘ This is a preview!⊘
Do you want full access?
Subscribe today to unlock all pages.
Trusted by 1+ million students worldwide
6FINANCE
An important assertion can be bought forward by stating that the NPV of the
Alternative 1 is higher than the NPV of the Alternative 2. Additionally, the viability of the
project in contest to generating higher amount of cash flow is higher. The higher amount of
cash flow for Alternative 1 represents the net present value of the entire amount of cash flow
along with the inflow reflecting positively and outflow reflecting negatively signifies that the
NPV can be regarded as the most viable of the two alternatives (Warren & Jones, 2018).
Application of NPV infinity Approach:
The basic principles of the application of the net present value approach is how the
amount of dollars are impacted by the compound interest and current value computation that
can be put into the use to make the better business decision (Henderson et al., 2015). There
are large number of alternatives for assessing the capital budgeting procedure. This comprises
of the net present value, accounting rate of return and the internal rate of return and payback.
The net present value helps in offsetting the present value of the investment cash flow
against the present value of the cash outflows. Present value of the amounts is computed by
making use of the company’s yearly cost of capital (Magni & Martin, 2017). The cost of
capital represents the theoretical cost of capital that is occurred by the organization. The cost
might be determined with the reference of the interest rates based on the debt and the
blending of the debt equity costs.
In the present context of Trawler, the tool of internal rate of return and the net present
value is computed for each investment opportunity. In the present context the tool of capital
budgeting framework is computed to derive the viability of each of the options as the highest
internal rate of return representing the positive amount of cash flow generated from each of
the product (Liu et al., 2017). In contrast to the net present value the general decision rule is
that accepting the project with the positive cash flow or in other words the net present value
Paraphrase This Document
Need a fresh take? Get an instant paraphrase of this document with our AI Paraphraser
7FINANCE
is subjected to the accessibility of the capital. In the current context of the HFC the manual
computation of internal rate of return by making use of the net present value table is
considered to be challenging. However, the positive net present value derived for the project
explains the viability of the capital.
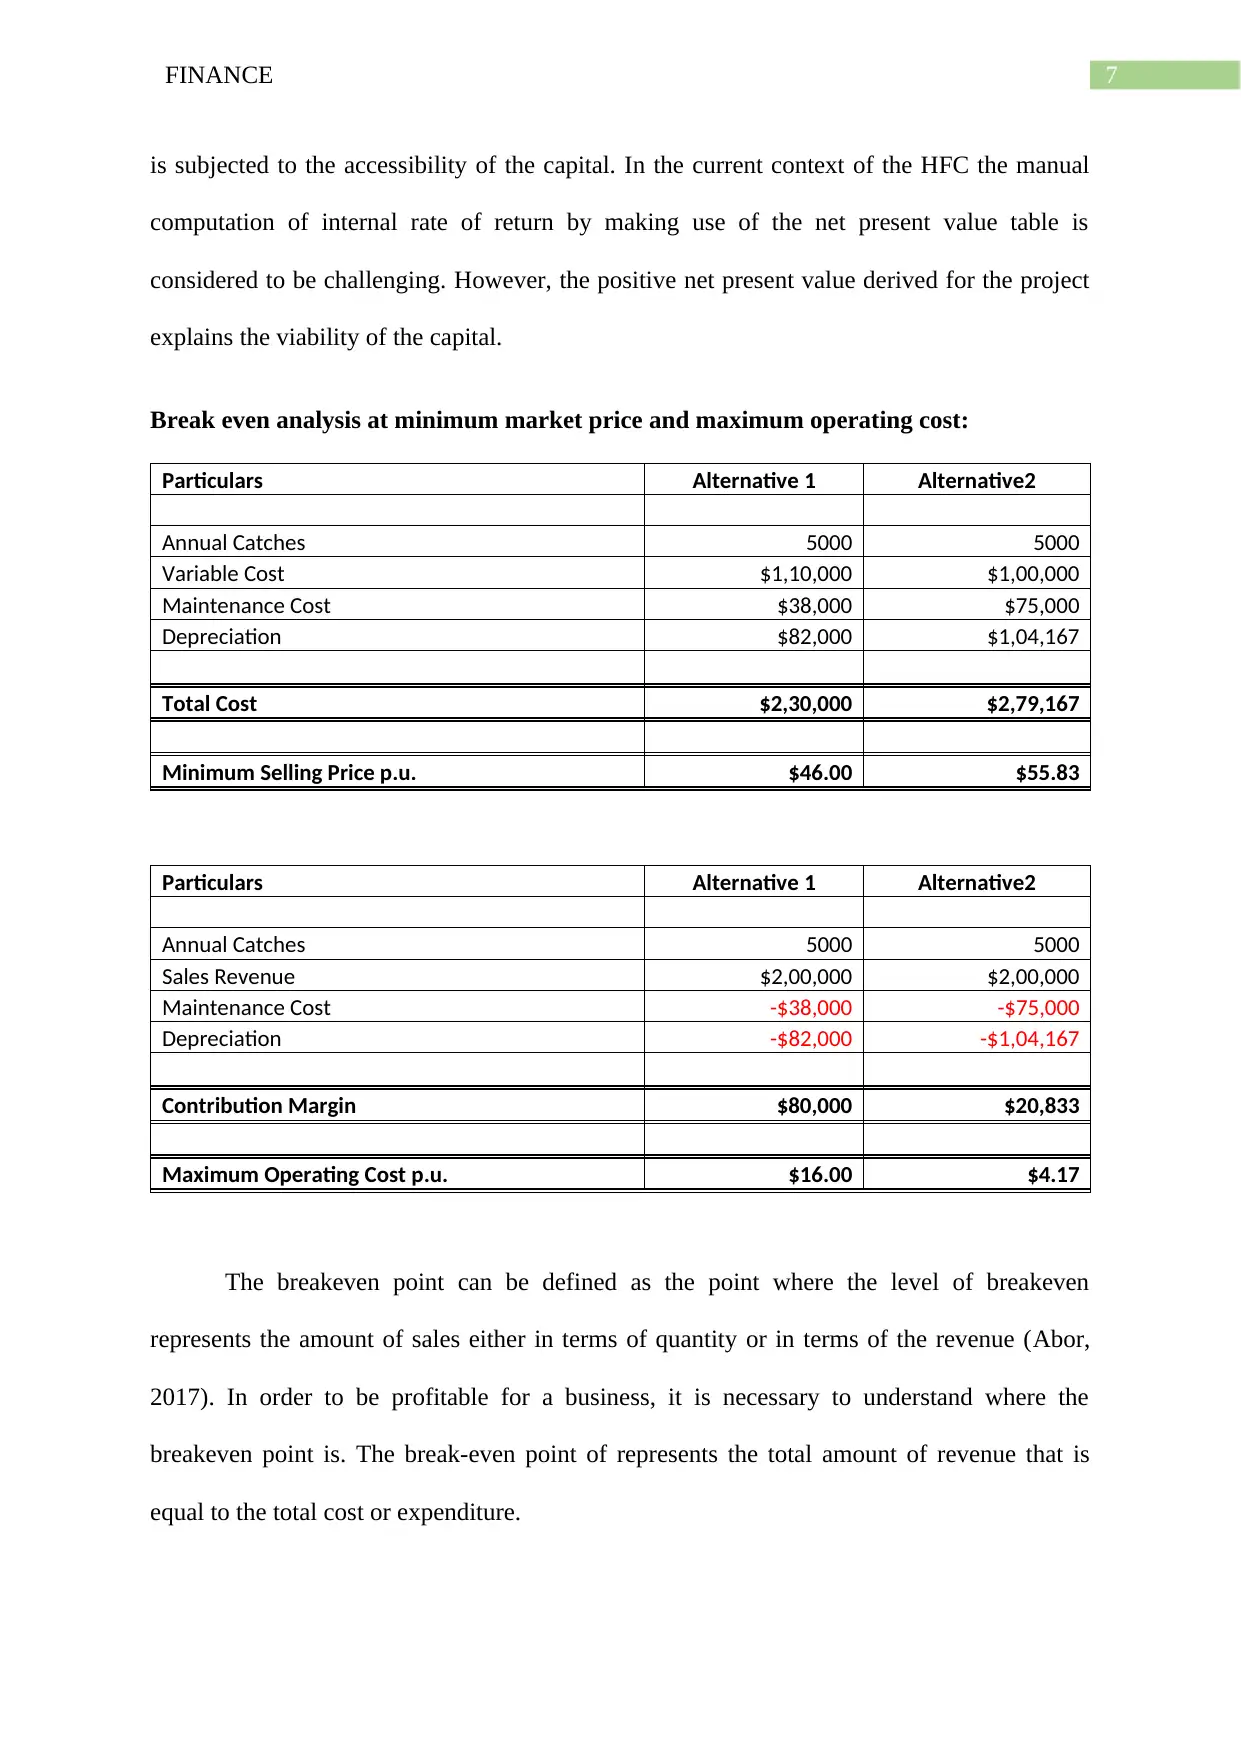
Break even analysis at minimum market price and maximum operating cost:
Particulars Alternative 1 Alternative2
Annual Catches 5000 5000
Variable Cost $1,10,000 $1,00,000
Maintenance Cost $38,000 $75,000
Depreciation $82,000 $1,04,167
Total Cost $2,30,000 $2,79,167
Minimum Selling Price p.u. $46.00 $55.83
Particulars Alternative 1 Alternative2
Annual Catches 5000 5000
Sales Revenue $2,00,000 $2,00,000
Maintenance Cost -$38,000 -$75,000
Depreciation -$82,000 -$1,04,167
Contribution Margin $80,000 $20,833
Maximum Operating Cost p.u. $16.00 $4.17
The breakeven point can be defined as the point where the level of breakeven
represents the amount of sales either in terms of quantity or in terms of the revenue (Abor,
2017). In order to be profitable for a business, it is necessary to understand where the
breakeven point is. The break-even point of represents the total amount of revenue that is
equal to the total cost or expenditure.
is subjected to the accessibility of the capital. In the current context of the HFC the manual
computation of internal rate of return by making use of the net present value table is
considered to be challenging. However, the positive net present value derived for the project
explains the viability of the capital.
Break even analysis at minimum market price and maximum operating cost:
Particulars Alternative 1 Alternative2
Annual Catches 5000 5000
Variable Cost $1,10,000 $1,00,000
Maintenance Cost $38,000 $75,000
Depreciation $82,000 $1,04,167
Total Cost $2,30,000 $2,79,167
Minimum Selling Price p.u. $46.00 $55.83
Particulars Alternative 1 Alternative2
Annual Catches 5000 5000
Sales Revenue $2,00,000 $2,00,000
Maintenance Cost -$38,000 -$75,000
Depreciation -$82,000 -$1,04,167
Contribution Margin $80,000 $20,833
Maximum Operating Cost p.u. $16.00 $4.17
The breakeven point can be defined as the point where the level of breakeven
represents the amount of sales either in terms of quantity or in terms of the revenue (Abor,
2017). In order to be profitable for a business, it is necessary to understand where the
breakeven point is. The break-even point of represents the total amount of revenue that is
equal to the total cost or expenditure.
8FINANCE
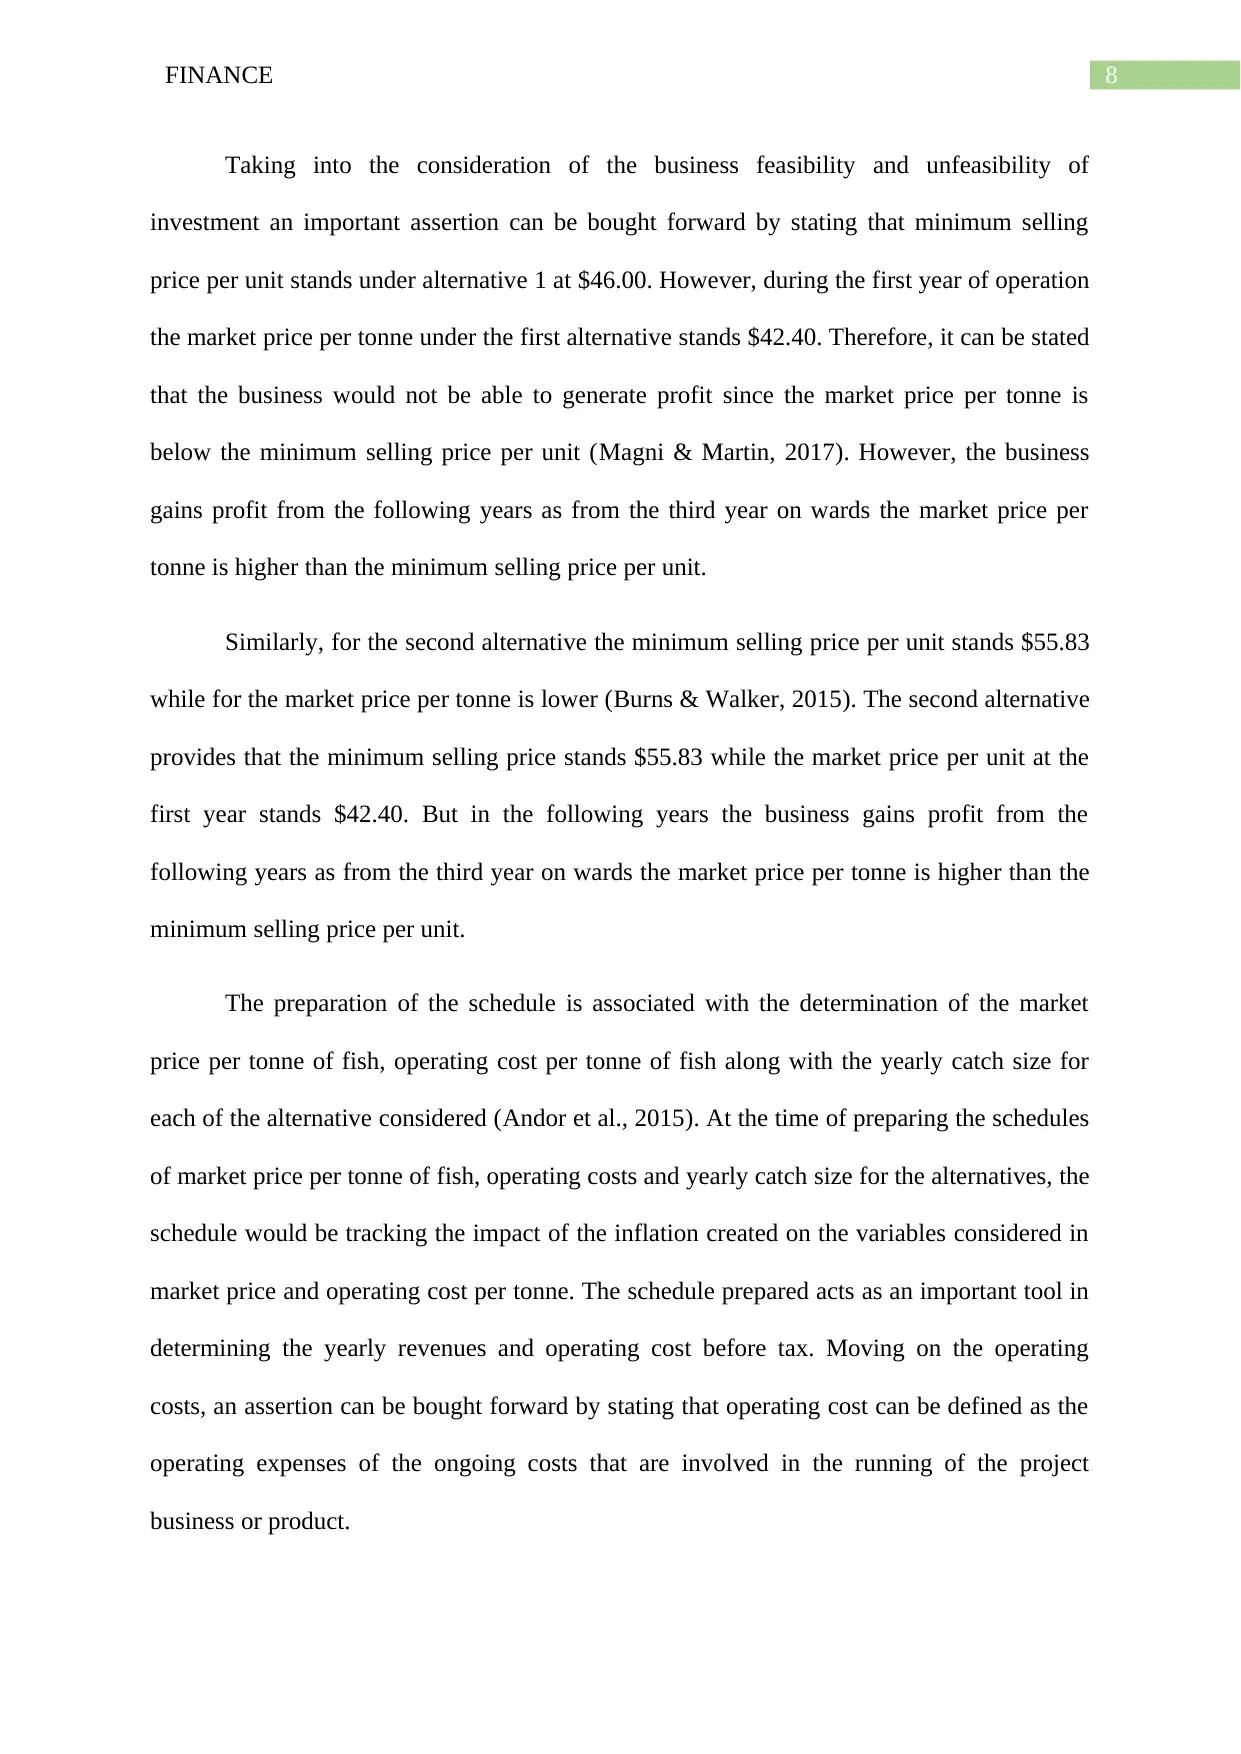
Taking into the consideration of the business feasibility and unfeasibility of
investment an important assertion can be bought forward by stating that minimum selling
price per unit stands under alternative 1 at $46.00. However, during the first year of operation
the market price per tonne under the first alternative stands $42.40. Therefore, it can be stated
that the business would not be able to generate profit since the market price per tonne is
below the minimum selling price per unit (Magni & Martin, 2017). However, the business
gains profit from the following years as from the third year on wards the market price per
tonne is higher than the minimum selling price per unit.
Similarly, for the second alternative the minimum selling price per unit stands $55.83
while for the market price per tonne is lower (Burns & Walker, 2015). The second alternative
provides that the minimum selling price stands $55.83 while the market price per unit at the
first year stands $42.40. But in the following years the business gains profit from the
following years as from the third year on wards the market price per tonne is higher than the
minimum selling price per unit.
The preparation of the schedule is associated with the determination of the market
price per tonne of fish, operating cost per tonne of fish along with the yearly catch size for
each of the alternative considered (Andor et al., 2015). At the time of preparing the schedules
of market price per tonne of fish, operating costs and yearly catch size for the alternatives, the
schedule would be tracking the impact of the inflation created on the variables considered in
market price and operating cost per tonne. The schedule prepared acts as an important tool in
determining the yearly revenues and operating cost before tax. Moving on the operating
costs, an assertion can be bought forward by stating that operating cost can be defined as the
operating expenses of the ongoing costs that are involved in the running of the project
business or product.
⊘ This is a preview!⊘
Do you want full access?
Subscribe today to unlock all pages.
Trusted by 1+ million students worldwide
9FINANCE
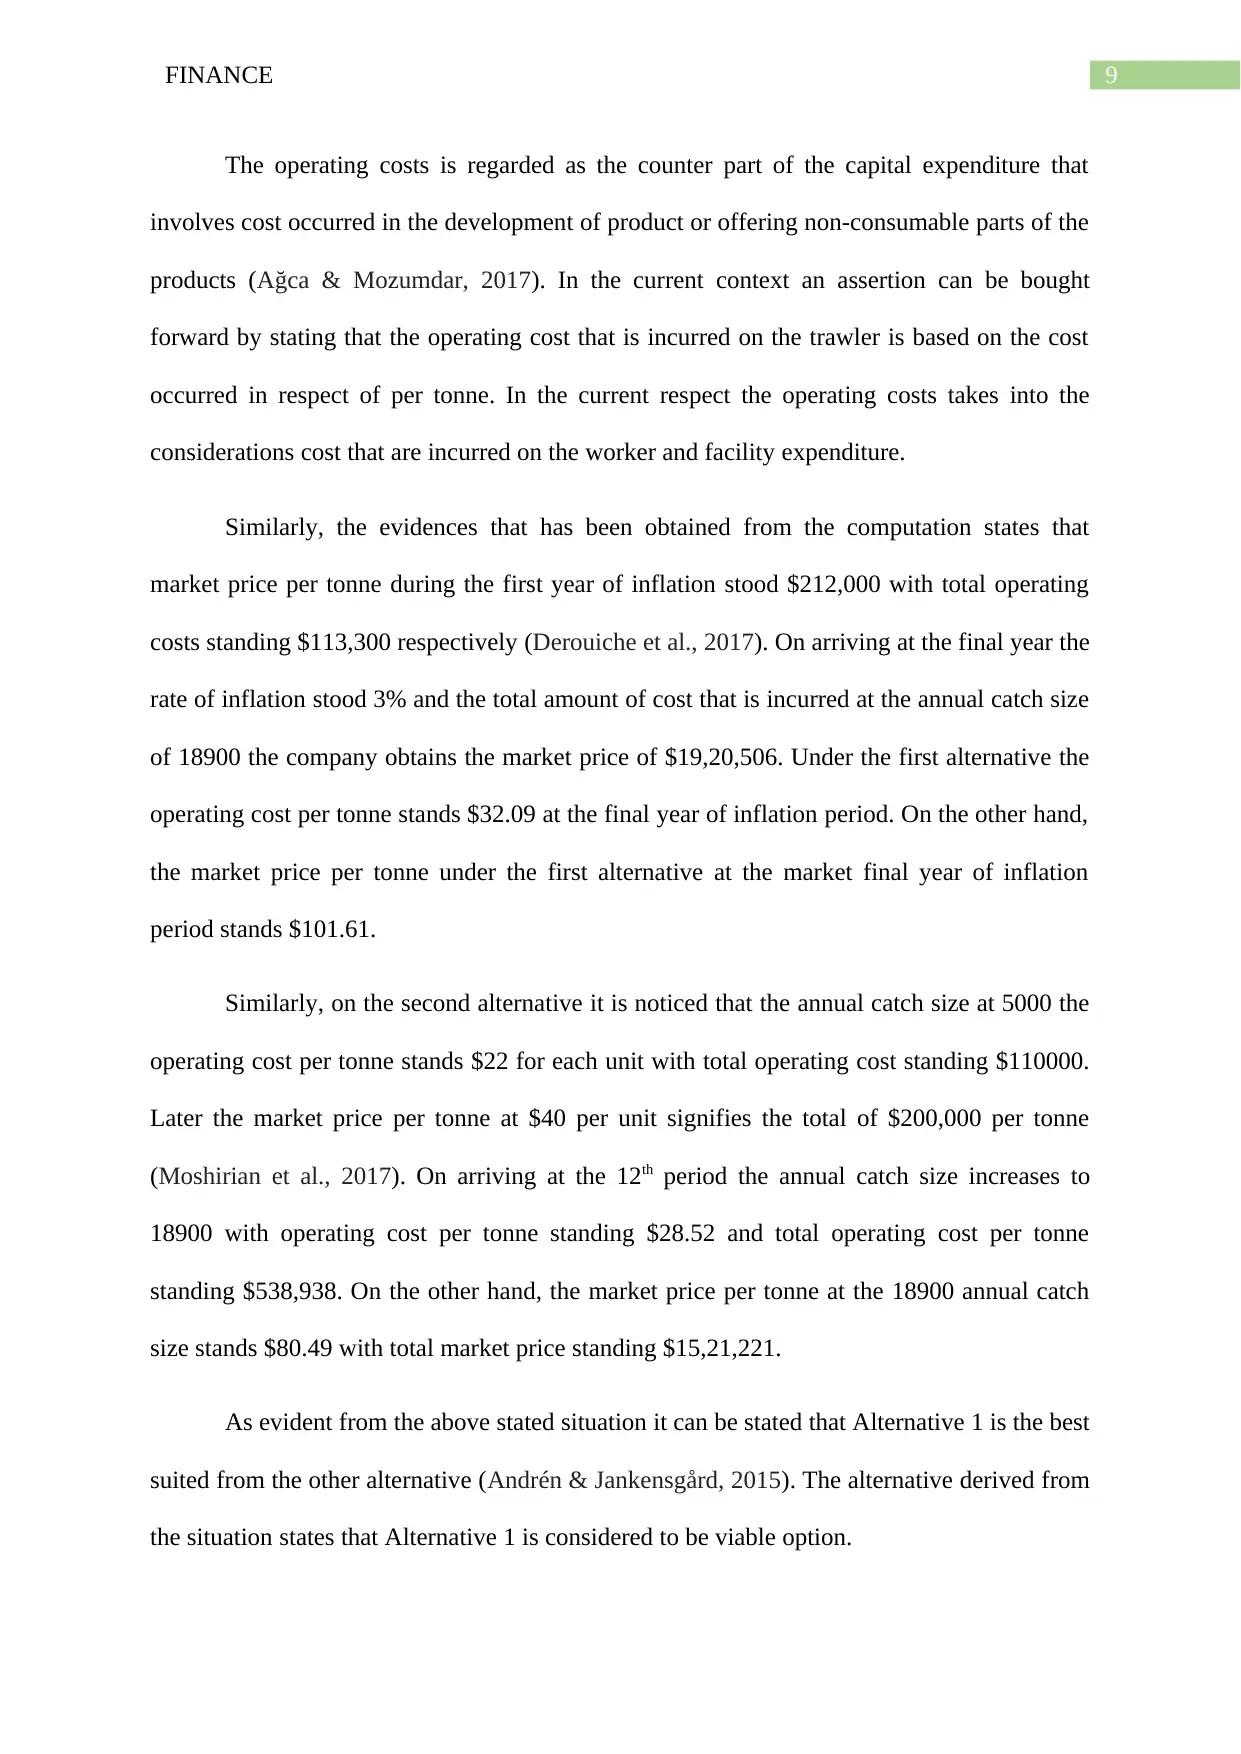
The operating costs is regarded as the counter part of the capital expenditure that
involves cost occurred in the development of product or offering non-consumable parts of the
products (Ağca & Mozumdar, 2017). In the current context an assertion can be bought
forward by stating that the operating cost that is incurred on the trawler is based on the cost
occurred in respect of per tonne. In the current respect the operating costs takes into the
considerations cost that are incurred on the worker and facility expenditure.
Similarly, the evidences that has been obtained from the computation states that
market price per tonne during the first year of inflation stood $212,000 with total operating
costs standing $113,300 respectively (Derouiche et al., 2017). On arriving at the final year the
rate of inflation stood 3% and the total amount of cost that is incurred at the annual catch size
of 18900 the company obtains the market price of $19,20,506. Under the first alternative the
operating cost per tonne stands $32.09 at the final year of inflation period. On the other hand,
the market price per tonne under the first alternative at the market final year of inflation
period stands $101.61.
Similarly, on the second alternative it is noticed that the annual catch size at 5000 the
operating cost per tonne stands $22 for each unit with total operating cost standing $110000.
Later the market price per tonne at $40 per unit signifies the total of $200,000 per tonne
(Moshirian et al., 2017). On arriving at the 12th period the annual catch size increases to
18900 with operating cost per tonne standing $28.52 and total operating cost per tonne
standing $538,938. On the other hand, the market price per tonne at the 18900 annual catch
size stands $80.49 with total market price standing $15,21,221.
As evident from the above stated situation it can be stated that Alternative 1 is the best
suited from the other alternative (Andrén & Jankensgård, 2015). The alternative derived from
the situation states that Alternative 1 is considered to be viable option.
Paraphrase This Document
Need a fresh take? Get an instant paraphrase of this document with our AI Paraphraser
10FINANCE
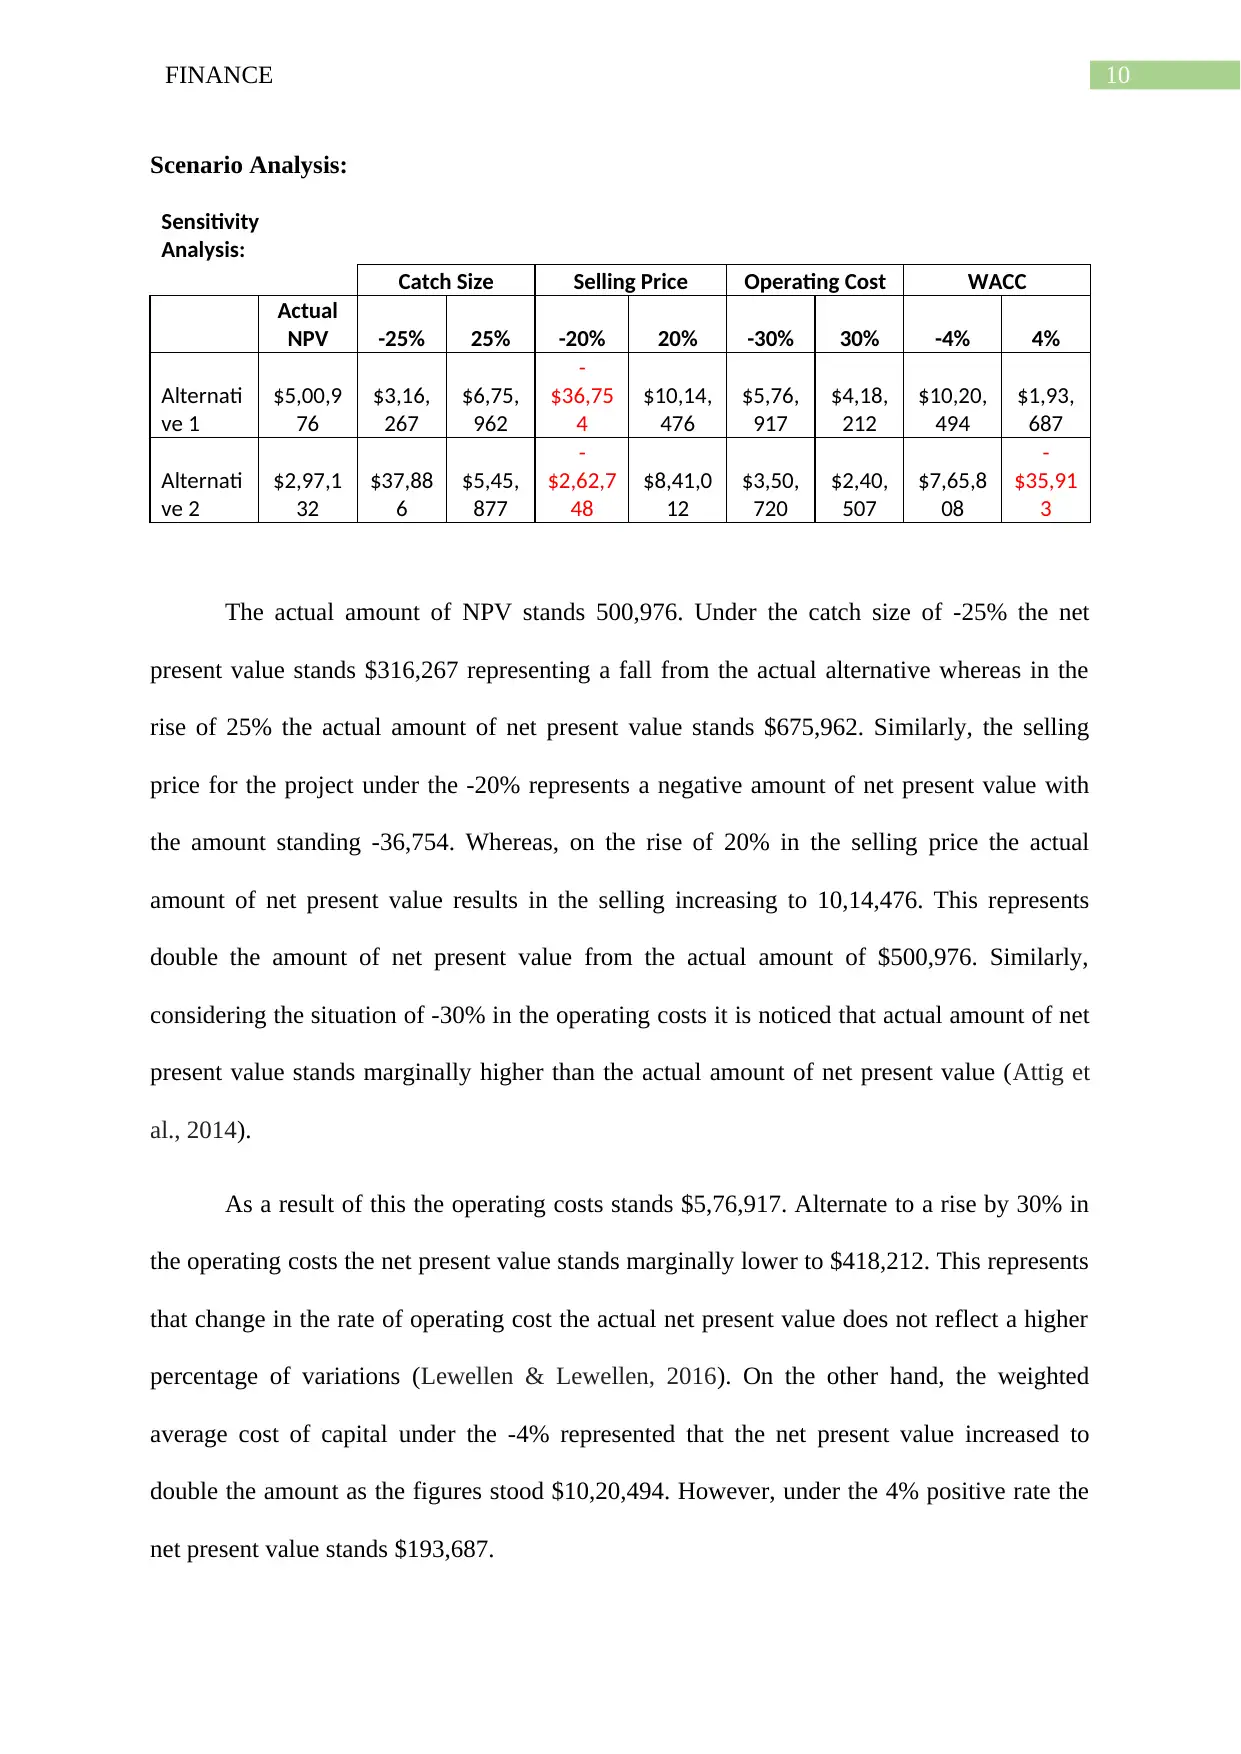
Scenario Analysis:
Sensitivity
Analysis:
Catch Size Selling Price Operating Cost WACC
Actual
NPV -25% 25% -20% 20% -30% 30% -4% 4%
Alternati
ve 1
$5,00,9
76
$3,16,
267
$6,75,
962
-
$36,75
4
$10,14,
476
$5,76,
917
$4,18,
212
$10,20,
494
$1,93,
687
Alternati
ve 2
$2,97,1
32
$37,88
6
$5,45,
877
-
$2,62,7
48
$8,41,0
12
$3,50,
720
$2,40,
507
$7,65,8
08
-
$35,91
3
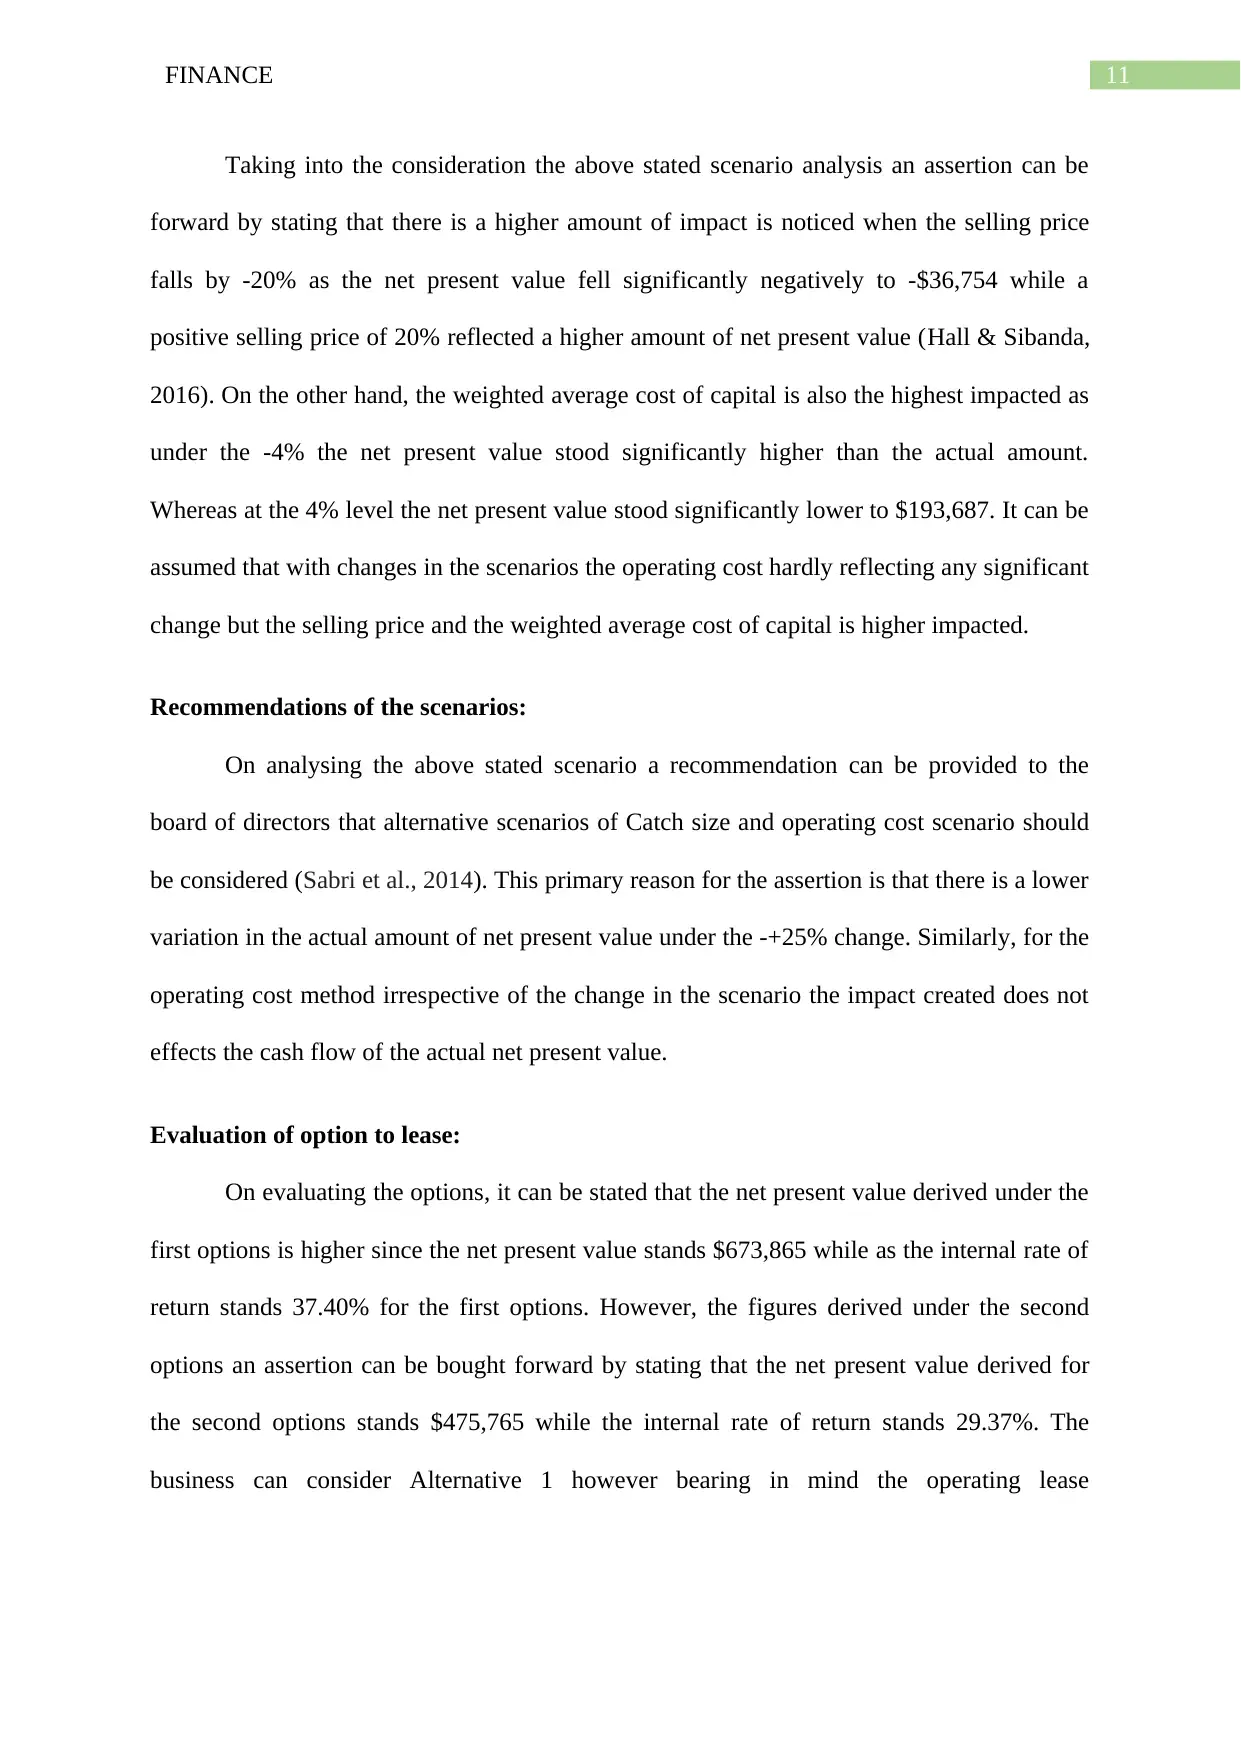
The actual amount of NPV stands 500,976. Under the catch size of -25% the net
present value stands $316,267 representing a fall from the actual alternative whereas in the
rise of 25% the actual amount of net present value stands $675,962. Similarly, the selling
price for the project under the -20% represents a negative amount of net present value with
the amount standing -36,754. Whereas, on the rise of 20% in the selling price the actual
amount of net present value results in the selling increasing to 10,14,476. This represents
double the amount of net present value from the actual amount of $500,976. Similarly,
considering the situation of -30% in the operating costs it is noticed that actual amount of net
present value stands marginally higher than the actual amount of net present value (Attig et
al., 2014).
As a result of this the operating costs stands $5,76,917. Alternate to a rise by 30% in
the operating costs the net present value stands marginally lower to $418,212. This represents
that change in the rate of operating cost the actual net present value does not reflect a higher
percentage of variations (Lewellen & Lewellen, 2016). On the other hand, the weighted
average cost of capital under the -4% represented that the net present value increased to
double the amount as the figures stood $10,20,494. However, under the 4% positive rate the
net present value stands $193,687.
Scenario Analysis:
Sensitivity
Analysis:
Catch Size Selling Price Operating Cost WACC
Actual
NPV -25% 25% -20% 20% -30% 30% -4% 4%
Alternati
ve 1
$5,00,9
76
$3,16,
267
$6,75,
962
-
$36,75
4
$10,14,
476
$5,76,
917
$4,18,
212
$10,20,
494
$1,93,
687
Alternati
ve 2
$2,97,1
32
$37,88
6
$5,45,
877
-
$2,62,7
48
$8,41,0
12
$3,50,
720
$2,40,
507
$7,65,8
08
-
$35,91
3
The actual amount of NPV stands 500,976. Under the catch size of -25% the net
present value stands $316,267 representing a fall from the actual alternative whereas in the
rise of 25% the actual amount of net present value stands $675,962. Similarly, the selling
price for the project under the -20% represents a negative amount of net present value with
the amount standing -36,754. Whereas, on the rise of 20% in the selling price the actual
amount of net present value results in the selling increasing to 10,14,476. This represents
double the amount of net present value from the actual amount of $500,976. Similarly,
considering the situation of -30% in the operating costs it is noticed that actual amount of net
present value stands marginally higher than the actual amount of net present value (Attig et
al., 2014).
As a result of this the operating costs stands $5,76,917. Alternate to a rise by 30% in
the operating costs the net present value stands marginally lower to $418,212. This represents
that change in the rate of operating cost the actual net present value does not reflect a higher
percentage of variations (Lewellen & Lewellen, 2016). On the other hand, the weighted
average cost of capital under the -4% represented that the net present value increased to
double the amount as the figures stood $10,20,494. However, under the 4% positive rate the
net present value stands $193,687.
11FINANCE
Taking into the consideration the above stated scenario analysis an assertion can be
forward by stating that there is a higher amount of impact is noticed when the selling price
falls by -20% as the net present value fell significantly negatively to -$36,754 while a
positive selling price of 20% reflected a higher amount of net present value (Hall & Sibanda,
2016). On the other hand, the weighted average cost of capital is also the highest impacted as
under the -4% the net present value stood significantly higher than the actual amount.
Whereas at the 4% level the net present value stood significantly lower to $193,687. It can be
assumed that with changes in the scenarios the operating cost hardly reflecting any significant
change but the selling price and the weighted average cost of capital is higher impacted.
Recommendations of the scenarios:
On analysing the above stated scenario a recommendation can be provided to the
board of directors that alternative scenarios of Catch size and operating cost scenario should
be considered (Sabri et al., 2014). This primary reason for the assertion is that there is a lower
variation in the actual amount of net present value under the -+25% change. Similarly, for the
operating cost method irrespective of the change in the scenario the impact created does not
effects the cash flow of the actual net present value.
Evaluation of option to lease:
On evaluating the options, it can be stated that the net present value derived under the
first options is higher since the net present value stands $673,865 while as the internal rate of
return stands 37.40% for the first options. However, the figures derived under the second
options an assertion can be bought forward by stating that the net present value derived for
the second options stands $475,765 while the internal rate of return stands 29.37%. The
business can consider Alternative 1 however bearing in mind the operating lease
⊘ This is a preview!⊘
Do you want full access?
Subscribe today to unlock all pages.
Trusted by 1+ million students worldwide
1 out of 15
Your All-in-One AI-Powered Toolkit for Academic Success.
+13062052269
info@desklib.com
Available 24*7 on WhatsApp / Email
![[object Object]](/_next/static/media/star-bottom.7253800d.svg)
Unlock your academic potential
Copyright © 2020–2025 A2Z Services. All Rights Reserved. Developed and managed by ZUCOL.