Calculating Weighted Average Cost of Capital and Gearing Ratios for AGL Energy Ltd
VerifiedAdded on 2023/01/11
|8
|1866
|59
AI Summary
This report provides a detailed analysis of the weighted average cost of capital (WACC) and gearing ratios for AGL Energy Ltd, an Australian retailing and power generation company. It explains the calculations and judgments involved in determining the WACC and gearing ratios. The report also discusses the findings in relation to capital structure theory and provides recommendations to the board on the company's capital structure.
Contribute Materials
Your contribution can guide someone’s learning journey. Share your
documents today.
CORPORATE FINANCE
Secure Best Marks with AI Grader
Need help grading? Try our AI Grader for instant feedback on your assignments.
TABLE OF CONTENTS
TABLE OF CONTENTS................................................................................................................2
EXECUTIVE SUMMARY.............................................................................................................1
REFERENCES................................................................................................................................2
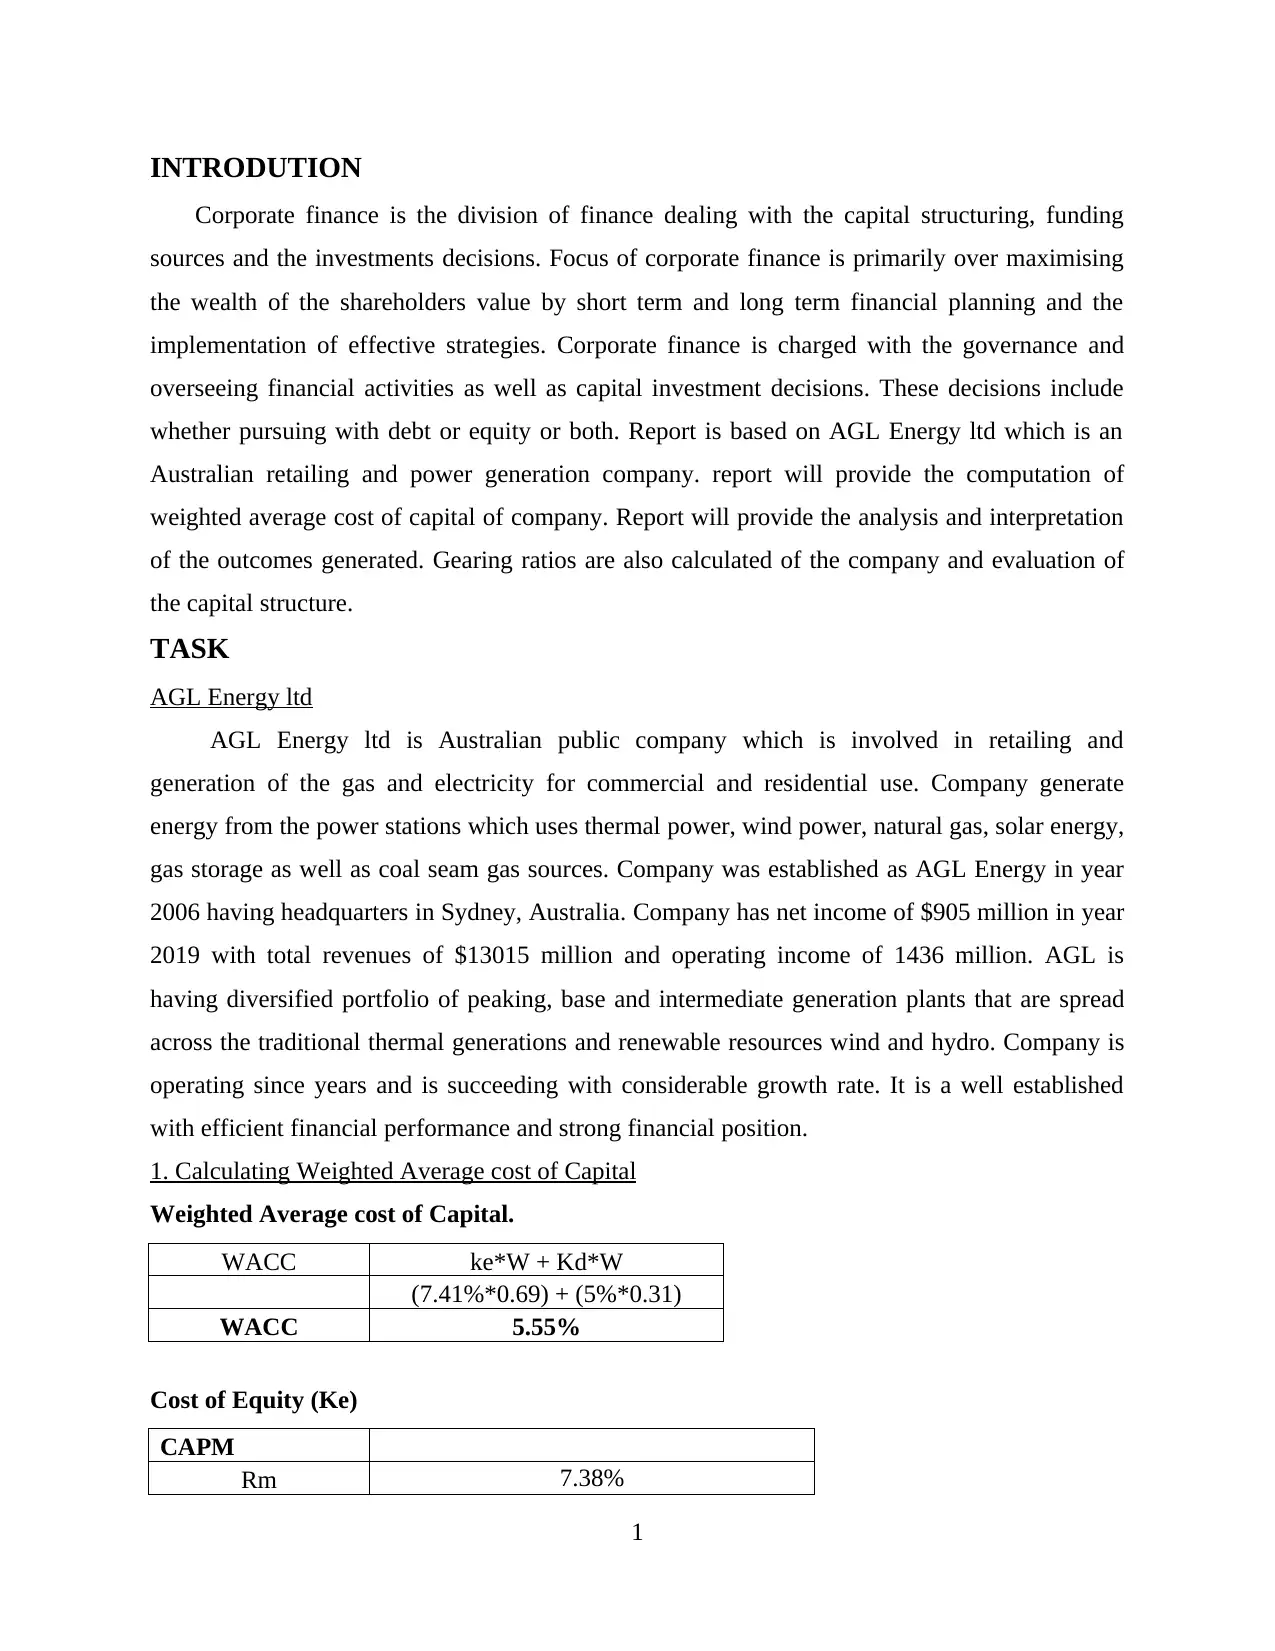
INTRODUTION
Corporate finance is the division of finance dealing with the capital structuring, funding
sources and the investments decisions. Focus of corporate finance is primarily over maximising
the wealth of the shareholders value by short term and long term financial planning and the
implementation of effective strategies. Corporate finance is charged with the governance and
overseeing financial activities as well as capital investment decisions. These decisions include
whether pursuing with debt or equity or both. Report is based on AGL Energy ltd which is an
Australian retailing and power generation company. report will provide the computation of
weighted average cost of capital of company. Report will provide the analysis and interpretation
of the outcomes generated. Gearing ratios are also calculated of the company and evaluation of
the capital structure.
TASK
AGL Energy ltd
AGL Energy ltd is Australian public company which is involved in retailing and
generation of the gas and electricity for commercial and residential use. Company generate
energy from the power stations which uses thermal power, wind power, natural gas, solar energy,
gas storage as well as coal seam gas sources. Company was established as AGL Energy in year
2006 having headquarters in Sydney, Australia. Company has net income of $905 million in year
2019 with total revenues of $13015 million and operating income of 1436 million. AGL is
having diversified portfolio of peaking, base and intermediate generation plants that are spread
across the traditional thermal generations and renewable resources wind and hydro. Company is
operating since years and is succeeding with considerable growth rate. It is a well established
with efficient financial performance and strong financial position.
1. Calculating Weighted Average cost of Capital
Weighted Average cost of Capital.
WACC ke*W + Kd*W
(7.41%*0.69) + (5%*0.31)
WACC 5.55%
Cost of Equity (Ke)
CAPM
Rm 7.38%
1
Rf 0.86%
Beta 0.3974
Re Rf + (Rm-Rf)*Beta
0.86% + (7.38% - 0.86%) * 0.3975
Re 3.45%
CGDM
D1 0.64
P 17
g 4.46%
Re = (D1/P0)+g (0.64/17)+6.10%
Re 8.23%
Average Re 4.97% + 9.86% / 2
Re (Ke) 5.84%
Cost of Debt (Kd)
Calculation of debt
Interest Expense 193000
Debt 2790000
Estimated cost of debt 7%
Tax 30%
After Tax debt (Kd) (7 - 30%)
Kd 4.90%
Working Notes :
Average Growth Rate
Calculation of average
growth rate 1 2 3 4 5 6
Dividend 0.58 0.64 0.91 1.17 1.19 0.47
Dividend Growth rate
10.34
%
42.19
%
28.57
% 1.71%
-
60.50
%
Average growth rate 4.46%
2
Secure Best Marks with AI Grader
Need help grading? Try our AI Grader for instant feedback on your assignments.
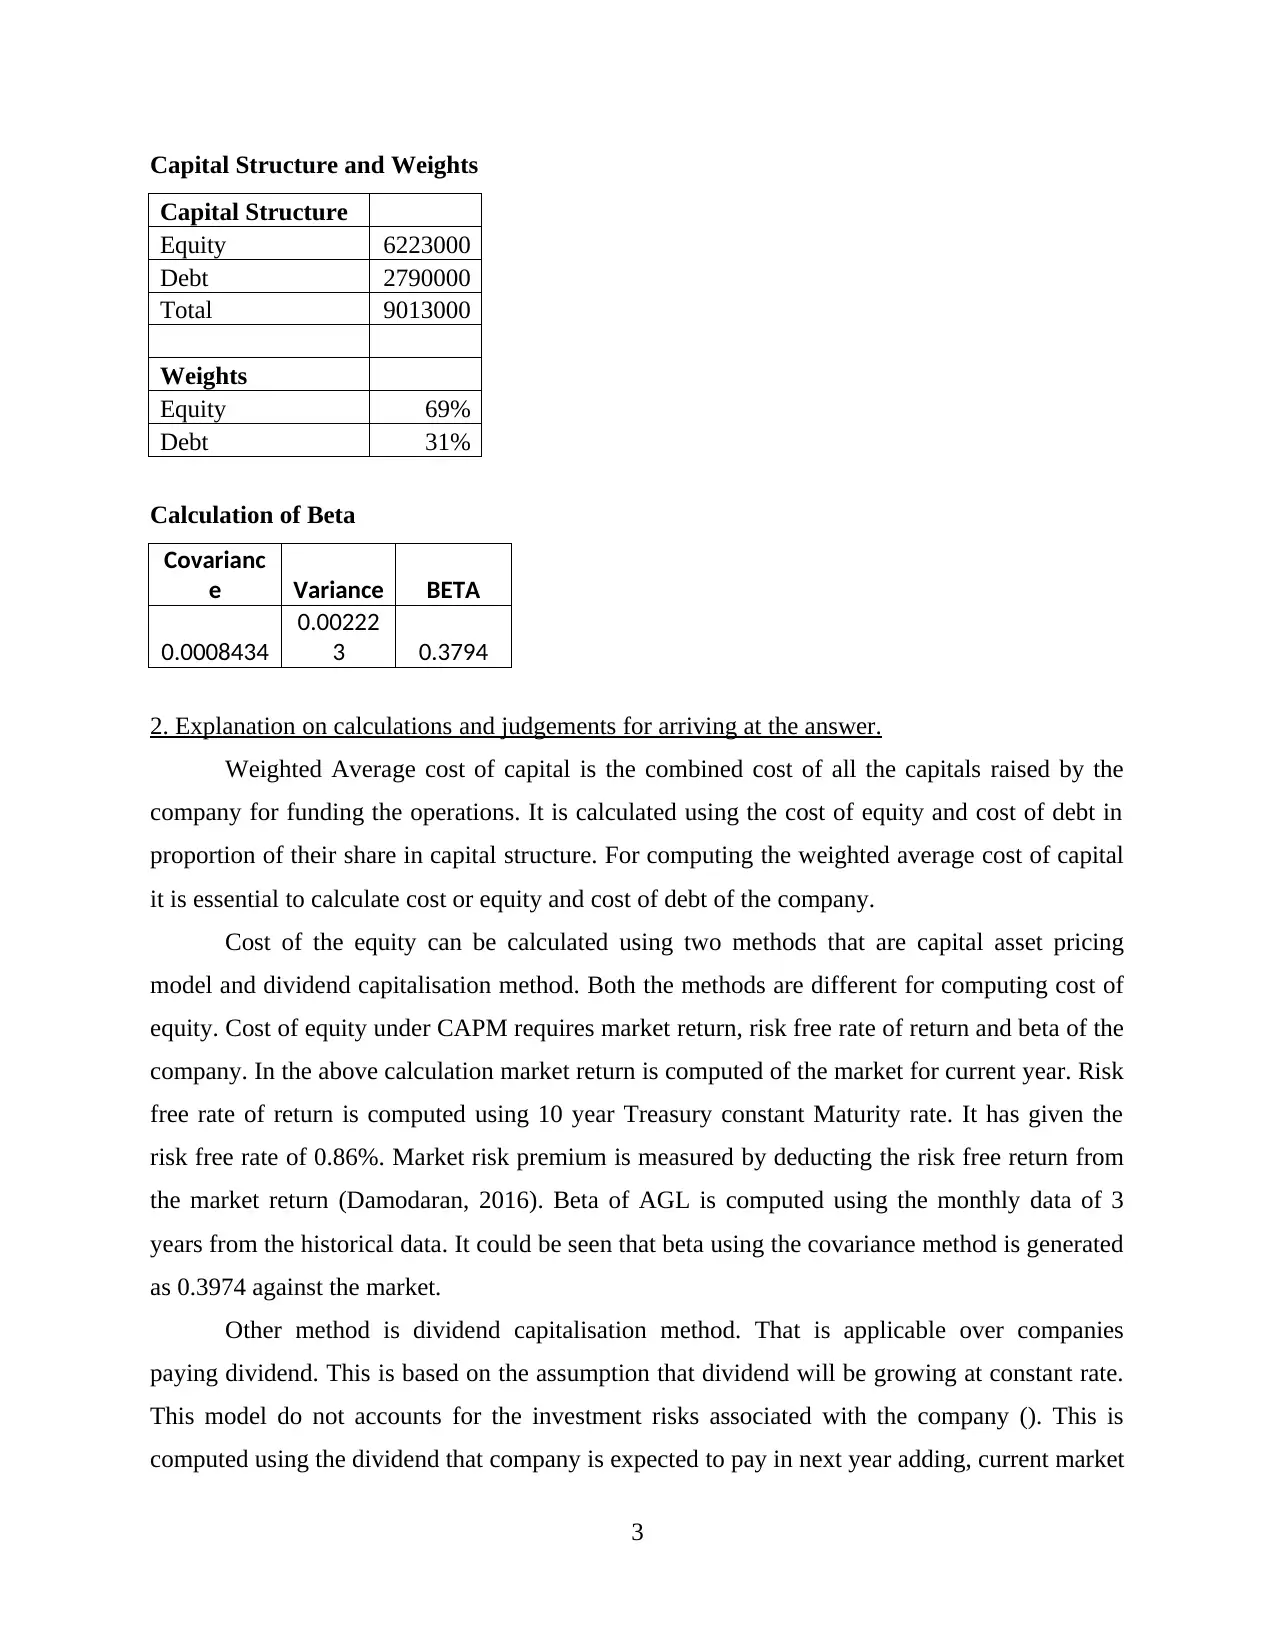
Capital Structure and Weights
Capital Structure
Equity 6223000
Debt 2790000
Total 9013000
Weights
Equity 69%
Debt 31%
Calculation of Beta
Covarianc
e Variance BETA
0.0008434
0.00222
3 0.3794
2. Explanation on calculations and judgements for arriving at the answer.
Weighted Average cost of capital is the combined cost of all the capitals raised by the
company for funding the operations. It is calculated using the cost of equity and cost of debt in
proportion of their share in capital structure. For computing the weighted average cost of capital
it is essential to calculate cost or equity and cost of debt of the company.
Cost of the equity can be calculated using two methods that are capital asset pricing
model and dividend capitalisation method. Both the methods are different for computing cost of
equity. Cost of equity under CAPM requires market return, risk free rate of return and beta of the
company. In the above calculation market return is computed of the market for current year. Risk
free rate of return is computed using 10 year Treasury constant Maturity rate. It has given the
risk free rate of 0.86%. Market risk premium is measured by deducting the risk free return from
the market return (Damodaran, 2016). Beta of AGL is computed using the monthly data of 3
years from the historical data. It could be seen that beta using the covariance method is generated
as 0.3974 against the market.
Other method is dividend capitalisation method. That is applicable over companies
paying dividend. This is based on the assumption that dividend will be growing at constant rate.
This model do not accounts for the investment risks associated with the company (). This is
computed using the dividend that company is expected to pay in next year adding, current market
3
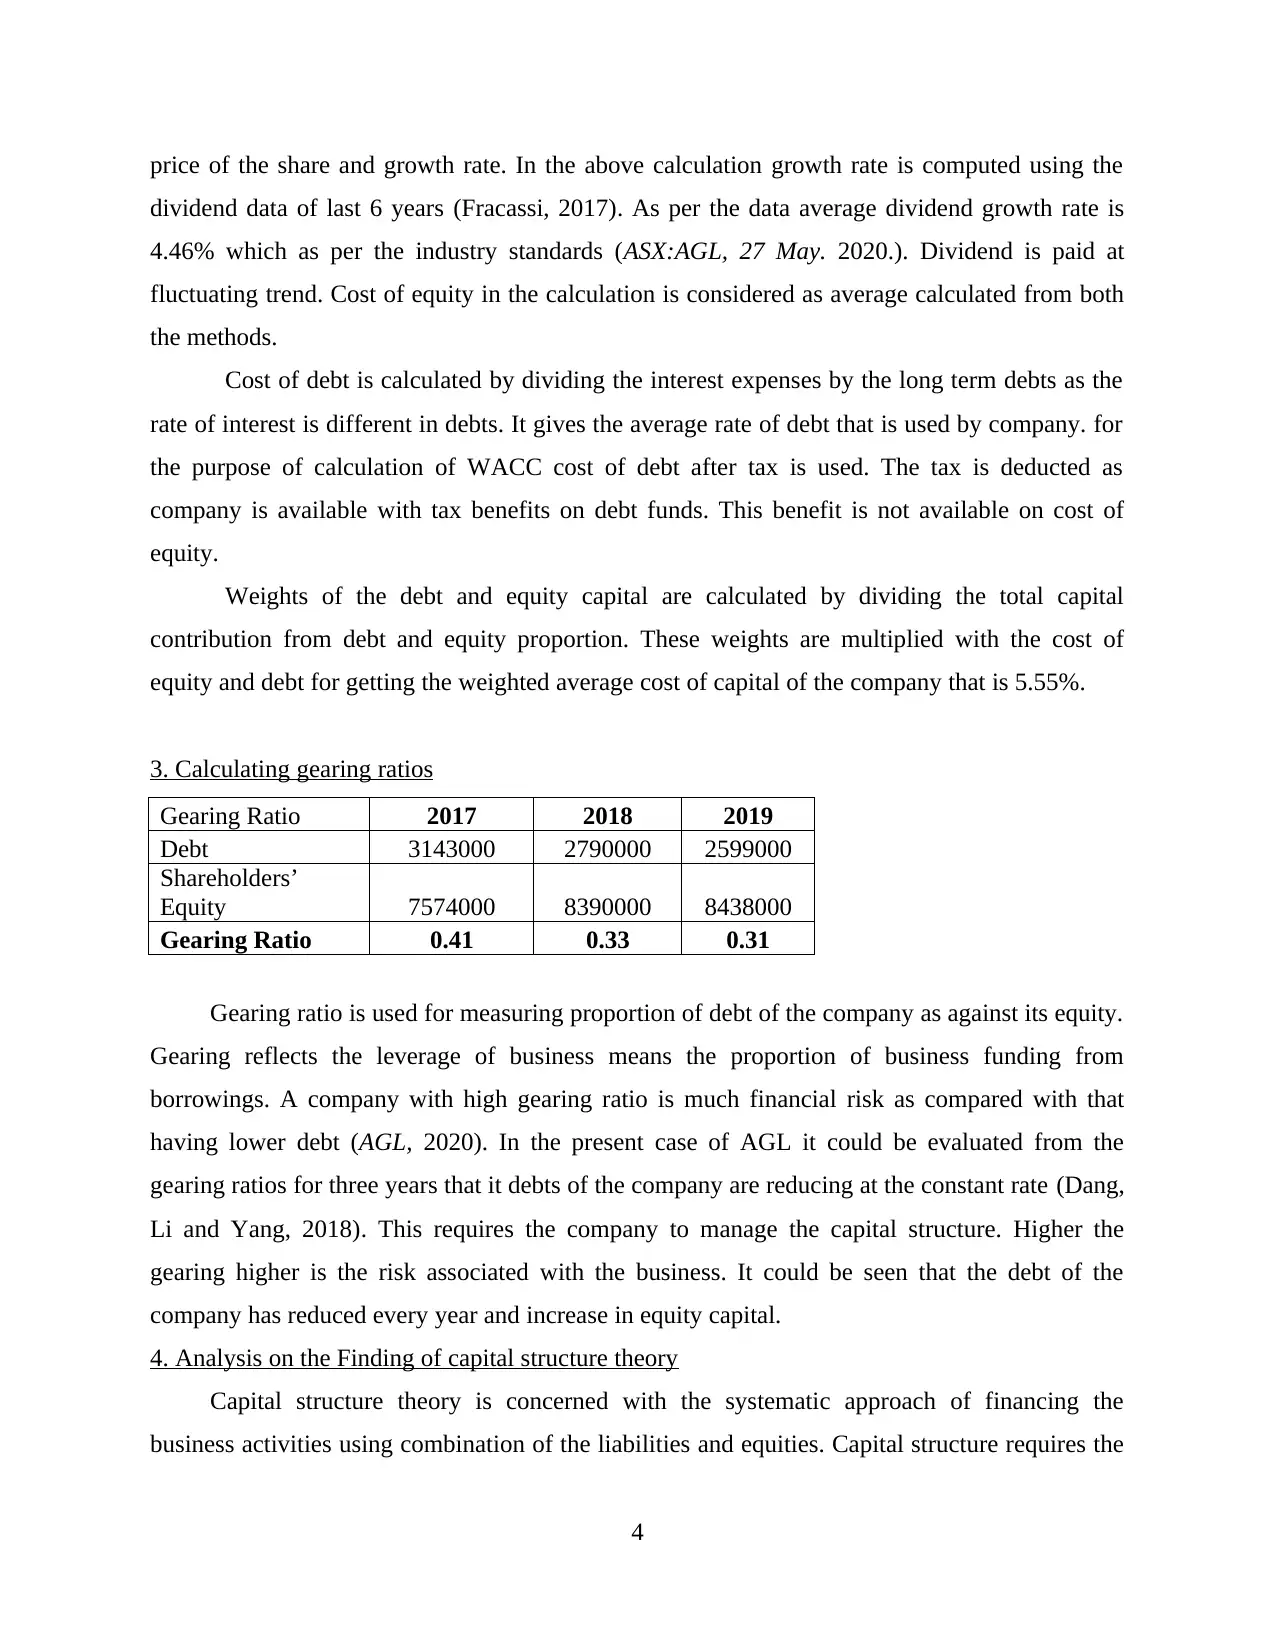
price of the share and growth rate. In the above calculation growth rate is computed using the
dividend data of last 6 years (Fracassi, 2017). As per the data average dividend growth rate is
4.46% which as per the industry standards (ASX:AGL, 27 May. 2020.). Dividend is paid at
fluctuating trend. Cost of equity in the calculation is considered as average calculated from both
the methods.
Cost of debt is calculated by dividing the interest expenses by the long term debts as the
rate of interest is different in debts. It gives the average rate of debt that is used by company. for
the purpose of calculation of WACC cost of debt after tax is used. The tax is deducted as
company is available with tax benefits on debt funds. This benefit is not available on cost of
equity.
Weights of the debt and equity capital are calculated by dividing the total capital
contribution from debt and equity proportion. These weights are multiplied with the cost of
equity and debt for getting the weighted average cost of capital of the company that is 5.55%.
3. Calculating gearing ratios
Gearing Ratio 2017 2018 2019
Debt 3143000 2790000 2599000
Shareholders’
Equity 7574000 8390000 8438000
Gearing Ratio 0.41 0.33 0.31
Gearing ratio is used for measuring proportion of debt of the company as against its equity.
Gearing reflects the leverage of business means the proportion of business funding from
borrowings. A company with high gearing ratio is much financial risk as compared with that
having lower debt (AGL, 2020). In the present case of AGL it could be evaluated from the
gearing ratios for three years that it debts of the company are reducing at the constant rate (Dang,
Li and Yang, 2018). This requires the company to manage the capital structure. Higher the
gearing higher is the risk associated with the business. It could be seen that the debt of the
company has reduced every year and increase in equity capital.
4. Analysis on the Finding of capital structure theory
Capital structure theory is concerned with the systematic approach of financing the
business activities using combination of the liabilities and equities. Capital structure requires the
4
business to have the optimum mix of debt and equity. M&M capital structure theory is based on
the concept that capital structure of the company is not relevant in the perfect markets. This was
given as the market value of company is determined by the earning power and risks of
underlying stock. In the second proposition it was given that financial leverage should be used by
the companies for boosting the values of firm (Ehrhardt and Brigham, 2016). This is also helpful
in reducing the WACC of company and is useful when the information on tax rates is applicable.
It could be analysed from the findings of the above computation that weighted average cost
of capital of the company is 5.55%. Proportion of equity in the total capital structure is 69% and
of debt is 31%. It could be evaluated that the debt of the company is lower as compared with the
equity section. It uses leverage but the equity is used mainly by company for raising the funds for
business. as per the theory it should use more of the leverage for raising capital for business for
reducing its cost of capital.
5. Recommendation to Board on capital structure of firm.
AGL is well established company earning considerable return over the revenues and
capital employed in the business. The current capital structure of the company comprises of 69%
of equity capital and 31% of debt capital. Company uses more of the equity capital for raising
funds from the market. Currently company is having cost of capital of 5.55%. Board should for
raising further finance should use borrowings. Though the risks associated with debts are higher
but the cost of debt is considerably low as compared with equity. Cost of equity is much higher
of the company that causes the cost of capital to go even higher (Atanasov and Black, 2016).
The weighted average cost of capital could be further reduced by company by leveraging.
Company is available with tax benefits on debt and also the cost of debt is lower. This will
decrease the cost of capital and help the company in utilising its funds for growth and expansion
of business.
CONCLUSION
It is summarised from the above report that the corporate finance play a critical role in the
success of the organisation. Company is required to adequately manage the operations of
business by effectively utilising the financial resources. it is essential for the firms to have
appropriate mix of debt and equity for keeping the cost of capital to minimum.
5
Paraphrase This Document
Need a fresh take? Get an instant paraphrase of this document with our AI Paraphraser
REFERENCES
Books and Journals
Damodaran, A., 2016. Damodaran on valuation: security analysis for investment and corporate
finance (Vol. 324). John Wiley & Sons.
Fracassi, C., 2017. Corporate finance policies and social networks. Management Science.63(8).
pp.2420-2438.
Dang, C., Li, Z.F. and Yang, C., 2018. Measuring firm size in empirical corporate
finance. Journal of Banking & Finance.86. pp.159-176.
Ehrhardt, M.C. and Brigham, E.F., 2016. Corporate finance: A focused approach. Cengage
learning.
Atanasov, V.A. and Black, B.S., 2016. Shock-based causal inference in corporate finance and
accounting research. Critical Finance Review.5.pp.207-304.
Online
ASX:AGL.,27 May .2020. [Online]. Available through : < https://www.asx.com.au/asx/share-
price-research/company/AGL>.
AGL. 2020.[Online]. Available through : <
https://au.finance.yahoo.com/quote/AGL.AX/balance-sheet?p=AGL.AX>.
6
1 out of 8
Related Documents


Your All-in-One AI-Powered Toolkit for Academic Success.
+13062052269
info@desklib.com
Available 24*7 on WhatsApp / Email
![[object Object]](/_next/static/media/star-bottom.7253800d.svg)
Unlock your academic potential
© 2024 | Zucol Services PVT LTD | All rights reserved.