Corporate Finance: Risk and Return Analysis
VerifiedAdded on 2023/03/29
|12
|2833
|485
AI Summary
This document provides an overview of risk and return analysis in corporate finance. It covers topics such as calculating expected rate of return and standard deviation, understanding the reasons for different risk and return profiles among similar companies, and exploring methods for calculating cost of equity. The document also discusses the concept of efficient market hypothesis.
Contribute Materials
Your contribution can guide someone’s learning journey. Share your
documents today.

CORPORATE FINANCE
Secure Best Marks with AI Grader
Need help grading? Try our AI Grader for instant feedback on your assignments.
TABLE OF CONTENTS
INTRODUCTION...........................................................................................................................3
Question 1........................................................................................................................................3
1Calculation of expected rate of return and standard deviation of expected return....................3
2 Reasons due to which similar companies have different risk and return profile......................4
3 Plotting of risk and return of portfolio and optimum portfolio.................................................4
4 Identifying whether addition of RFR to optimum portfolio is prudent decision......................6
Question 2........................................................................................................................................8
Two appropriate methods for calculating cost of equity.............................................................8
Calculation of Astringency capital structure................................................................................9
Estimate of weighted average cost of capital.............................................................................10
Question 3......................................................................................................................................11
Efficient market hypothesis.......................................................................................................11
CONCLUSION..............................................................................................................................11
REFERNECES..............................................................................................................................12
INTRODUCTION
Corporate finance is the one of the most important domain that heavily influence the
individual decision making process in respect to investment in securities. In the current report,
varied calculations are performed like expected return and standard deviation for portfolio and
for individual securities. Apart from this, in the report changes that can be observed in return of
portfolio after addition of risk free asset is also reflected. Significance of making investment in
risk free asset is discussed briefly. At end of the report, efficient market hypothesis concept is
explained.
Question 1
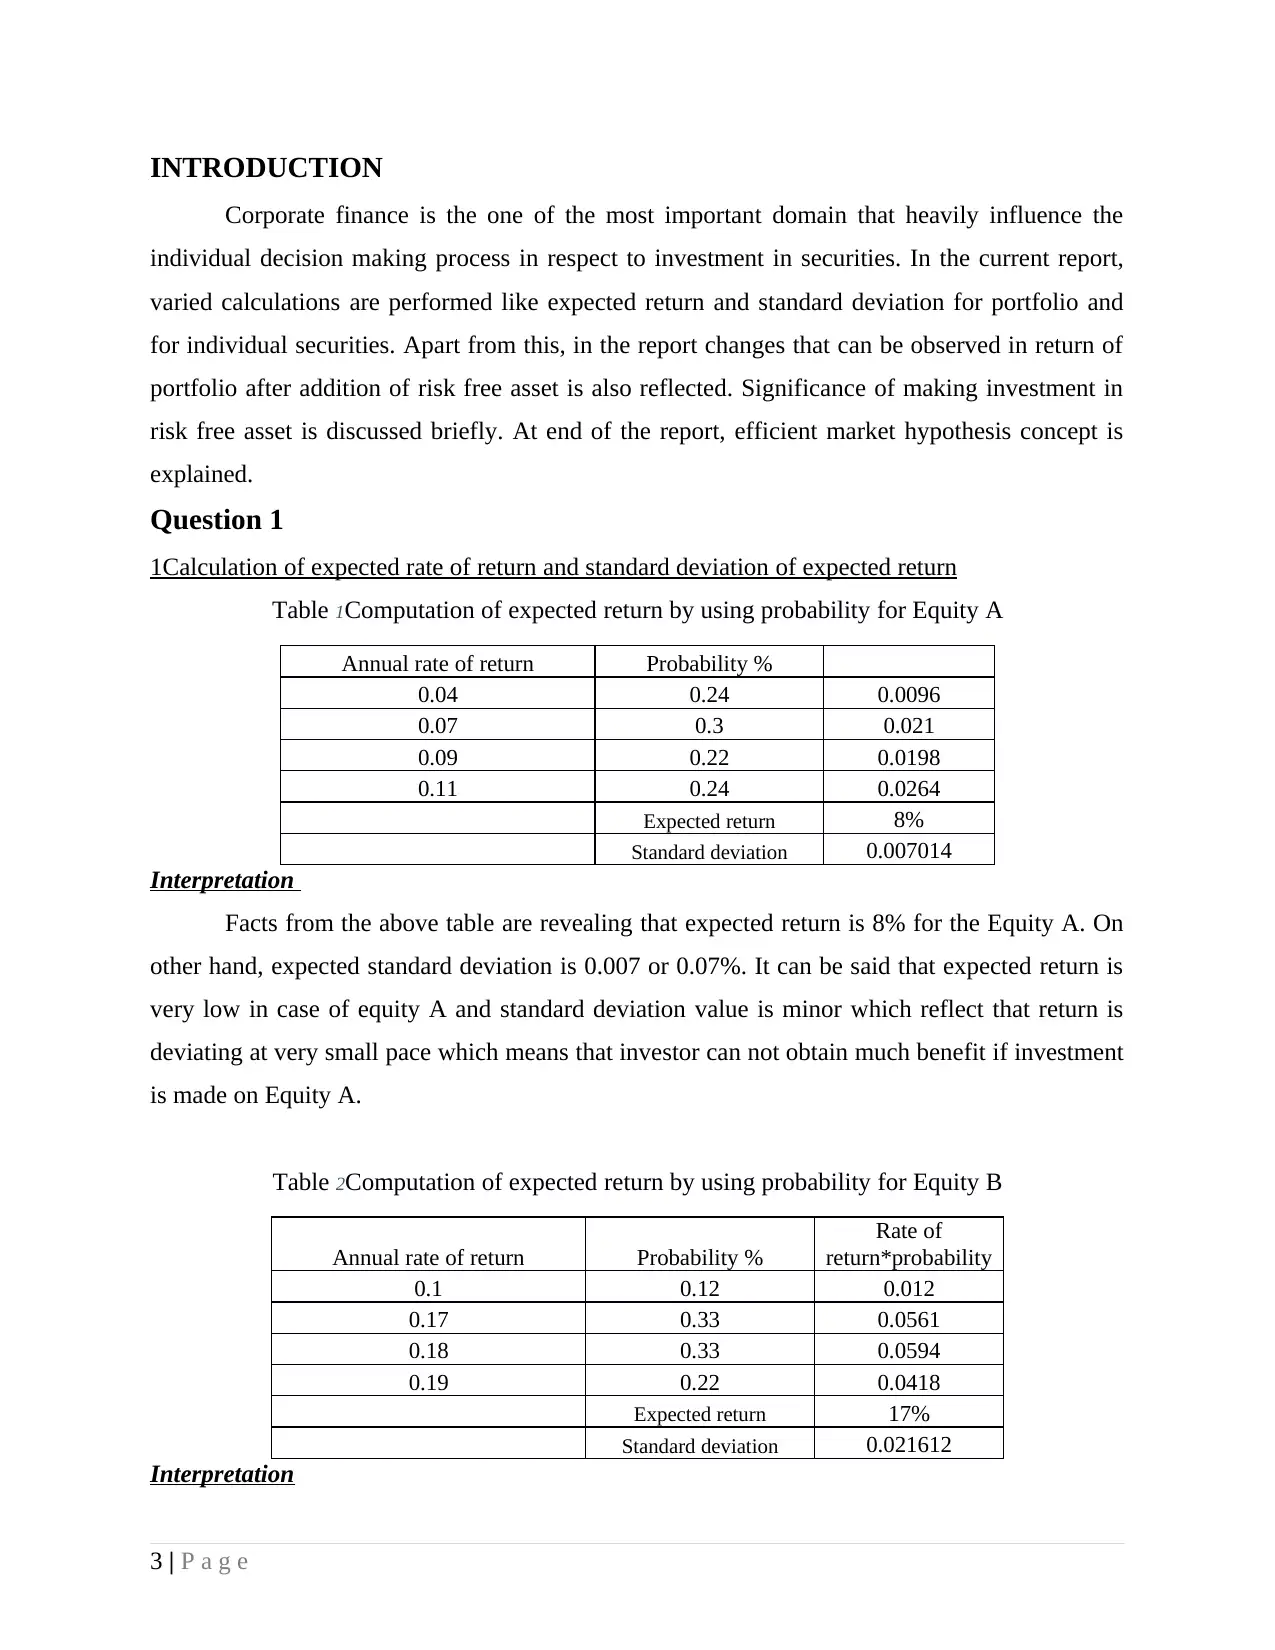
1Calculation of expected rate of return and standard deviation of expected return
Table 1Computation of expected return by using probability for Equity A
Annual rate of return Probability %
0.04 0.24 0.0096
0.07 0.3 0.021
0.09 0.22 0.0198
0.11 0.24 0.0264
Expected return 8%
Standard deviation 0.007014
Interpretation
Facts from the above table are revealing that expected return is 8% for the Equity A. On
other hand, expected standard deviation is 0.007 or 0.07%. It can be said that expected return is
very low in case of equity A and standard deviation value is minor which reflect that return is
deviating at very small pace which means that investor can not obtain much benefit if investment
is made on Equity A.
Table 2Computation of expected return by using probability for Equity B
Annual rate of return Probability %
Rate of
return*probability
0.1 0.12 0.012
0.17 0.33 0.0561
0.18 0.33 0.0594
0.19 0.22 0.0418
Expected return 17%
Standard deviation 0.021612
Interpretation
3 | P a g e
Corporate finance is the one of the most important domain that heavily influence the
individual decision making process in respect to investment in securities. In the current report,
varied calculations are performed like expected return and standard deviation for portfolio and
for individual securities. Apart from this, in the report changes that can be observed in return of
portfolio after addition of risk free asset is also reflected. Significance of making investment in
risk free asset is discussed briefly. At end of the report, efficient market hypothesis concept is
explained.
Question 1
1Calculation of expected rate of return and standard deviation of expected return
Table 1Computation of expected return by using probability for Equity A
Annual rate of return Probability %
0.04 0.24 0.0096
0.07 0.3 0.021
0.09 0.22 0.0198
0.11 0.24 0.0264
Expected return 8%
Standard deviation 0.007014
Interpretation
Facts from the above table are revealing that expected return is 8% for the Equity A. On
other hand, expected standard deviation is 0.007 or 0.07%. It can be said that expected return is
very low in case of equity A and standard deviation value is minor which reflect that return is
deviating at very small pace which means that investor can not obtain much benefit if investment
is made on Equity A.
Table 2Computation of expected return by using probability for Equity B
Annual rate of return Probability %
Rate of
return*probability
0.1 0.12 0.012
0.17 0.33 0.0561
0.18 0.33 0.0594
0.19 0.22 0.0418
Expected return 17%
Standard deviation 0.021612
Interpretation
3 | P a g e
Results that are obtained on calculation reveal that expected return for Equity B is 17%
which can be considered good return on invested amount. Standard deviation value is 0.021
which is very low value and this reflects that at very slow rate return is changing. It can be said
that Equity B can give stable return to the investors and due to this reason investment must be
made on the firm. Risk and return are two factors that must be taken in to account deeply in order
to make decisions. If these factors change at fast rate then in that case one need to make
decisions very cautiously. Thus, it can be said that managers needs to make decisions cautiously.
2 Reasons due to which similar companies have different risk and return profile
There are multiple reasons due to which risk and return profile are different across firms
that are similar to each other in terms of risk and return profile. One of the main reason for
different trends in terms of risk and return that is observed in case of firm are that investors have
different perception about the firms in terms of profitability. Stock performance in the market
and investment by corporate in the firms heavily affect share price. It is possible that two firms
are operating in same sector and have same profile but their capability to attract investment from
side of institutional investors is different in nature. Due to this reason risk and return profile of
firms varied from each other across same industry. Management of these firms is also different
from each other. It is possible that single company managers think in wrong direction and other
firm manager think in right direction. Due to this reason both firms that earn profit in business
may vary from other. It can be said that there is different risk and return profile of similar
companies. Investors need to be very rational while making investment decisions. It can be
observed that when any company CEO get changed deep discussion on that specific firm going
on in media. Experts talking about positive and negative things as well threat and opportunity
that can be observed in case of the business firm. All these things sometimes spark tension
among investor and due to this reason even though firms are operating in similar industry risk
and return profile become different.
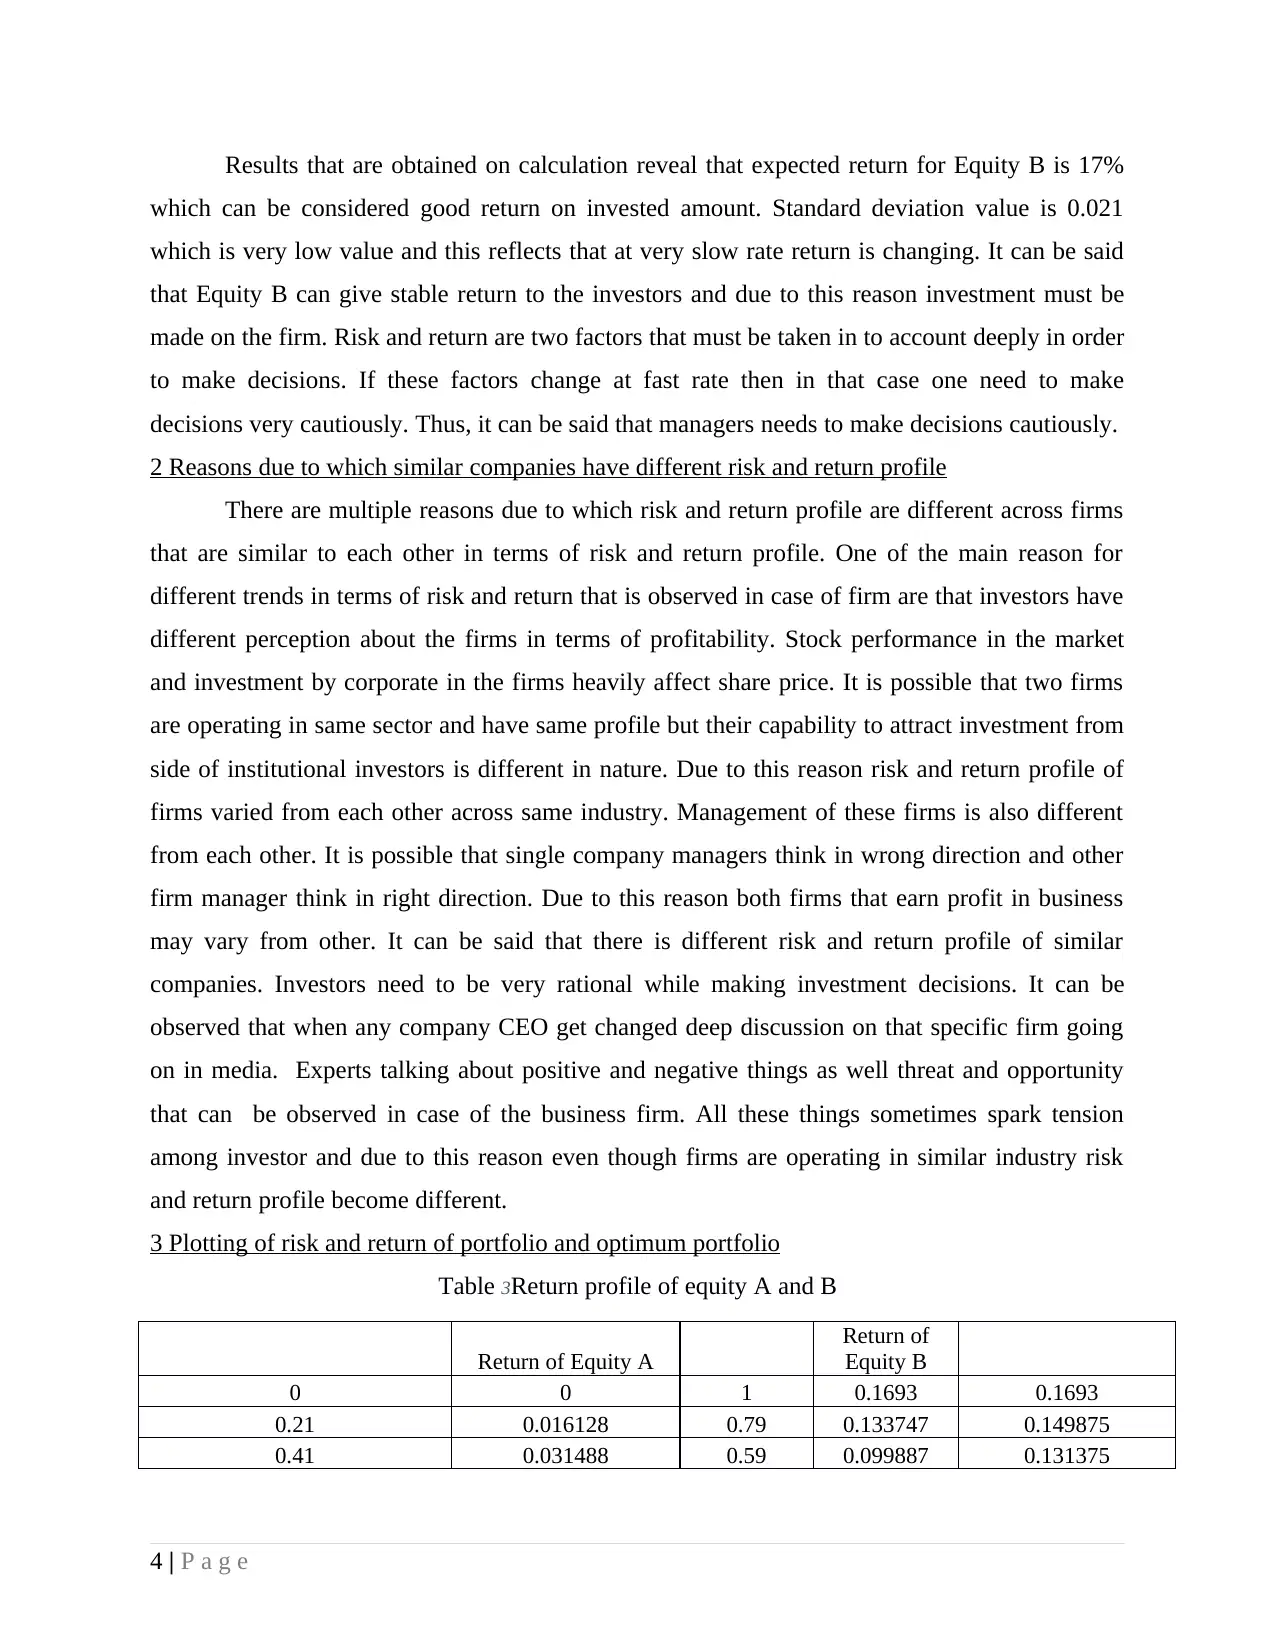
3 Plotting of risk and return of portfolio and optimum portfolio
Table 3Return profile of equity A and B
Return of Equity A
Return of
Equity B
0 0 1 0.1693 0.1693
0.21 0.016128 0.79 0.133747 0.149875
0.41 0.031488 0.59 0.099887 0.131375
4 | P a g e
which can be considered good return on invested amount. Standard deviation value is 0.021
which is very low value and this reflects that at very slow rate return is changing. It can be said
that Equity B can give stable return to the investors and due to this reason investment must be
made on the firm. Risk and return are two factors that must be taken in to account deeply in order
to make decisions. If these factors change at fast rate then in that case one need to make
decisions very cautiously. Thus, it can be said that managers needs to make decisions cautiously.
2 Reasons due to which similar companies have different risk and return profile
There are multiple reasons due to which risk and return profile are different across firms
that are similar to each other in terms of risk and return profile. One of the main reason for
different trends in terms of risk and return that is observed in case of firm are that investors have
different perception about the firms in terms of profitability. Stock performance in the market
and investment by corporate in the firms heavily affect share price. It is possible that two firms
are operating in same sector and have same profile but their capability to attract investment from
side of institutional investors is different in nature. Due to this reason risk and return profile of
firms varied from each other across same industry. Management of these firms is also different
from each other. It is possible that single company managers think in wrong direction and other
firm manager think in right direction. Due to this reason both firms that earn profit in business
may vary from other. It can be said that there is different risk and return profile of similar
companies. Investors need to be very rational while making investment decisions. It can be
observed that when any company CEO get changed deep discussion on that specific firm going
on in media. Experts talking about positive and negative things as well threat and opportunity
that can be observed in case of the business firm. All these things sometimes spark tension
among investor and due to this reason even though firms are operating in similar industry risk
and return profile become different.
3 Plotting of risk and return of portfolio and optimum portfolio
Table 3Return profile of equity A and B
Return of Equity A
Return of
Equity B
0 0 1 0.1693 0.1693
0.21 0.016128 0.79 0.133747 0.149875
0.41 0.031488 0.59 0.099887 0.131375
4 | P a g e
Secure Best Marks with AI Grader
Need help grading? Try our AI Grader for instant feedback on your assignments.
0.61 0.046848 0.39 0.066027 0.112875
0.81 0.062208 0.19 0.032167 0.094375
Table 4Standard deviation of Equity B
STDEV of Equity A
STDEV of
Equity B
0 0 1 0.021612 0.021611629
0.21 0.001472997 0.79 0.017073 0.018546184
0.41 0.002875851 0.59 0.012751 0.015626712
0.61 0.004278705 0.39 0.008429 0.012707241
0.81 0.00568156 0.19 0.004106 0.009787769
Figure 1Risk and return profile of portfolio
Interpretation
Chart above given is related to risk and return that are associated with the project. It can
be said that with increase in proportion of Equity A in the portfolio return is reducing sharply.
On other hand, risk also reduced but at small rate. It can be said that at the given weightage
investment is not good because it is not offering stable return or growing return to the investor. It
can be said that if investment is made on the given portfolio then investor can earn less amount
of profit on investment. Thus, investment on the mentioned portfolio is very risky.
Optimal portoflio
Figure 2Return profile of equity A and B
Return of
Equity A
Return of
Equity B Portfolio return
0 0 1 0.1693 0.1693
0.15 0.01152 0.85 0.143905 0.155425
0.2 0.01536 0.8 0.13544 0.1508
0.18 0.013824 0.82 0.138826 0.15265
0.19 0.014592 0.81 0.137133 0.151725
Figure 3Standard deviation of equity A and B
STDEV STDEV
0 0 1 0.021611629 0.021611629
0.15 0.001052141 0.85 0.018369884 0.019422025
0.2 0.001402854 0.8 0.017289303 0.018692157
0.18 0.001262569 0.82 0.017721536 0.018984104
0.19 0.001332712 0.81 0.017505419 0.018838131
5 | P a g e
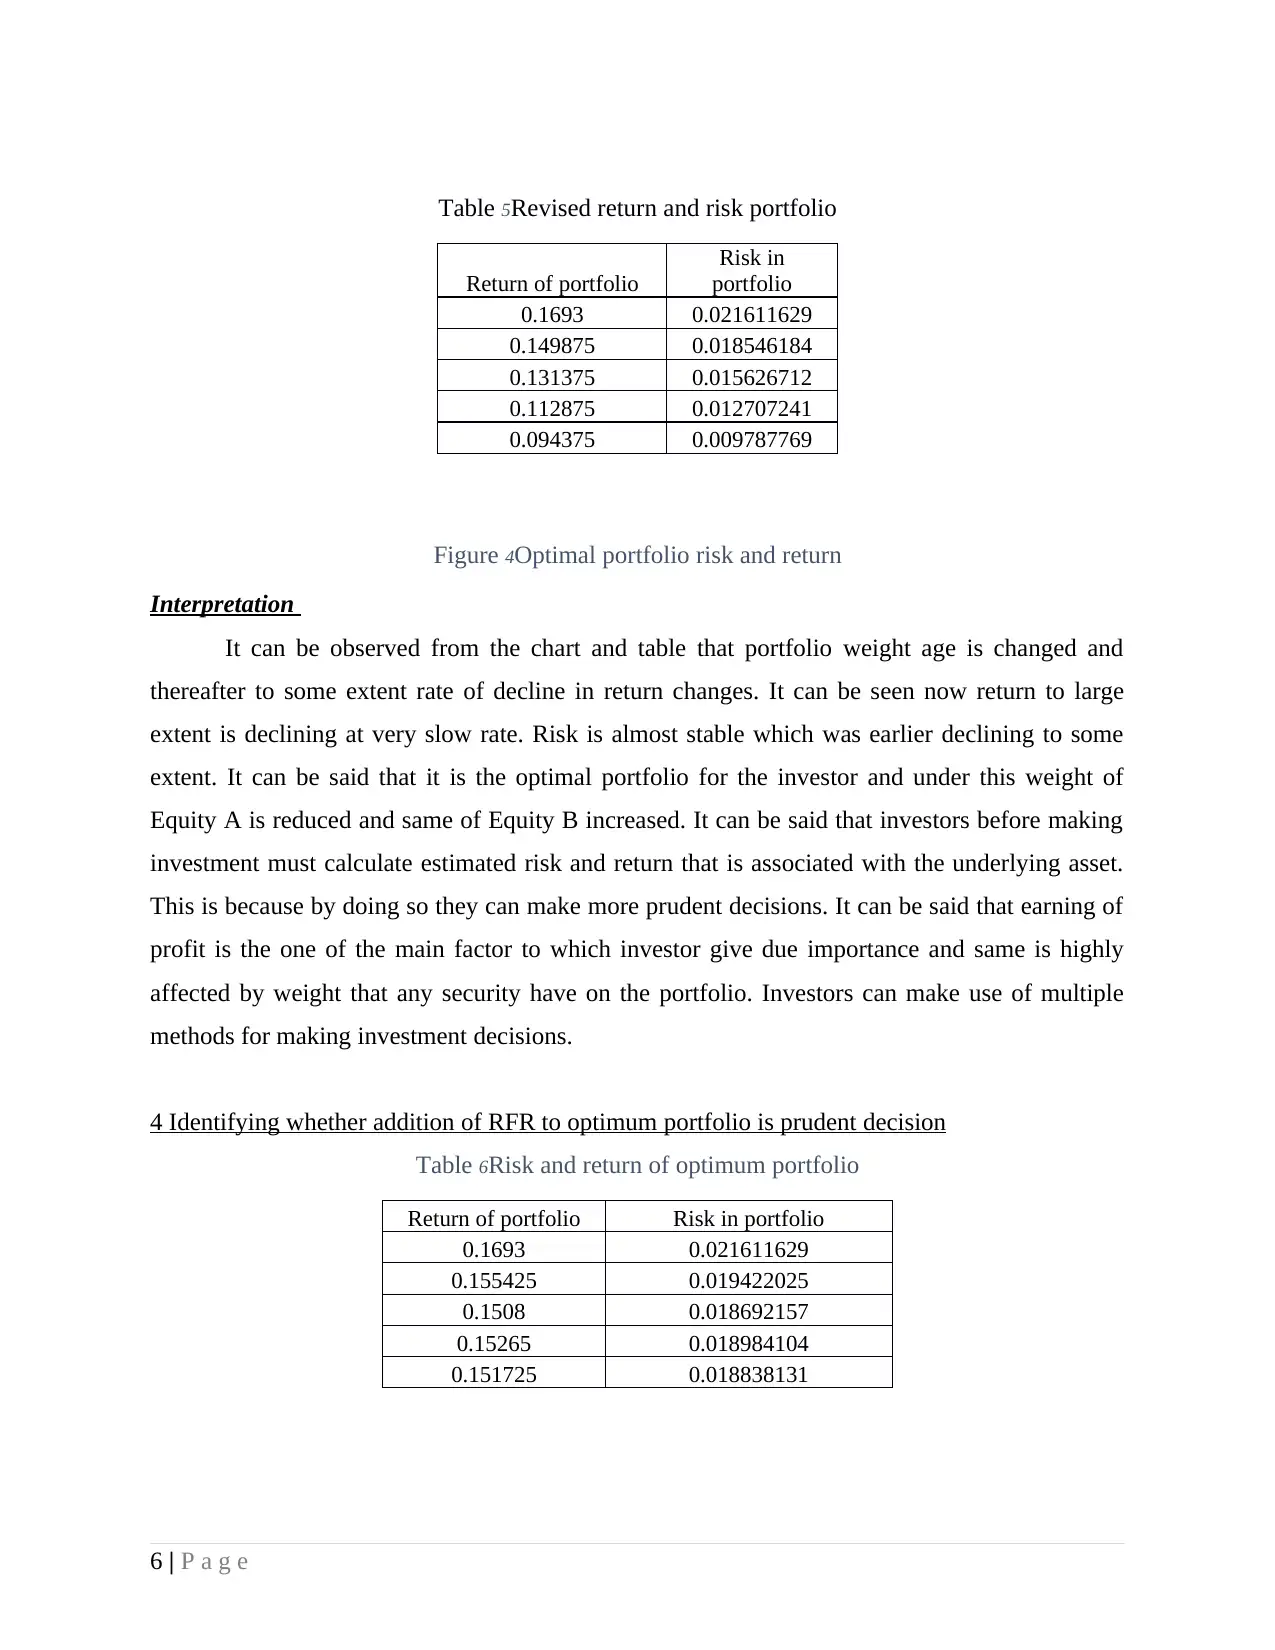
Table 5Revised return and risk portfolio
Return of portfolio
Risk in
portfolio
0.1693 0.021611629
0.149875 0.018546184
0.131375 0.015626712
0.112875 0.012707241
0.094375 0.009787769
Figure 4Optimal portfolio risk and return
Interpretation
It can be observed from the chart and table that portfolio weight age is changed and
thereafter to some extent rate of decline in return changes. It can be seen now return to large
extent is declining at very slow rate. Risk is almost stable which was earlier declining to some
extent. It can be said that it is the optimal portfolio for the investor and under this weight of
Equity A is reduced and same of Equity B increased. It can be said that investors before making
investment must calculate estimated risk and return that is associated with the underlying asset.
This is because by doing so they can make more prudent decisions. It can be said that earning of
profit is the one of the main factor to which investor give due importance and same is highly
affected by weight that any security have on the portfolio. Investors can make use of multiple
methods for making investment decisions.
4 Identifying whether addition of RFR to optimum portfolio is prudent decision
Table 6Risk and return of optimum portfolio
Return of portfolio Risk in portfolio
0.1693 0.021611629
0.155425 0.019422025
0.1508 0.018692157
0.15265 0.018984104
0.151725 0.018838131
6 | P a g e
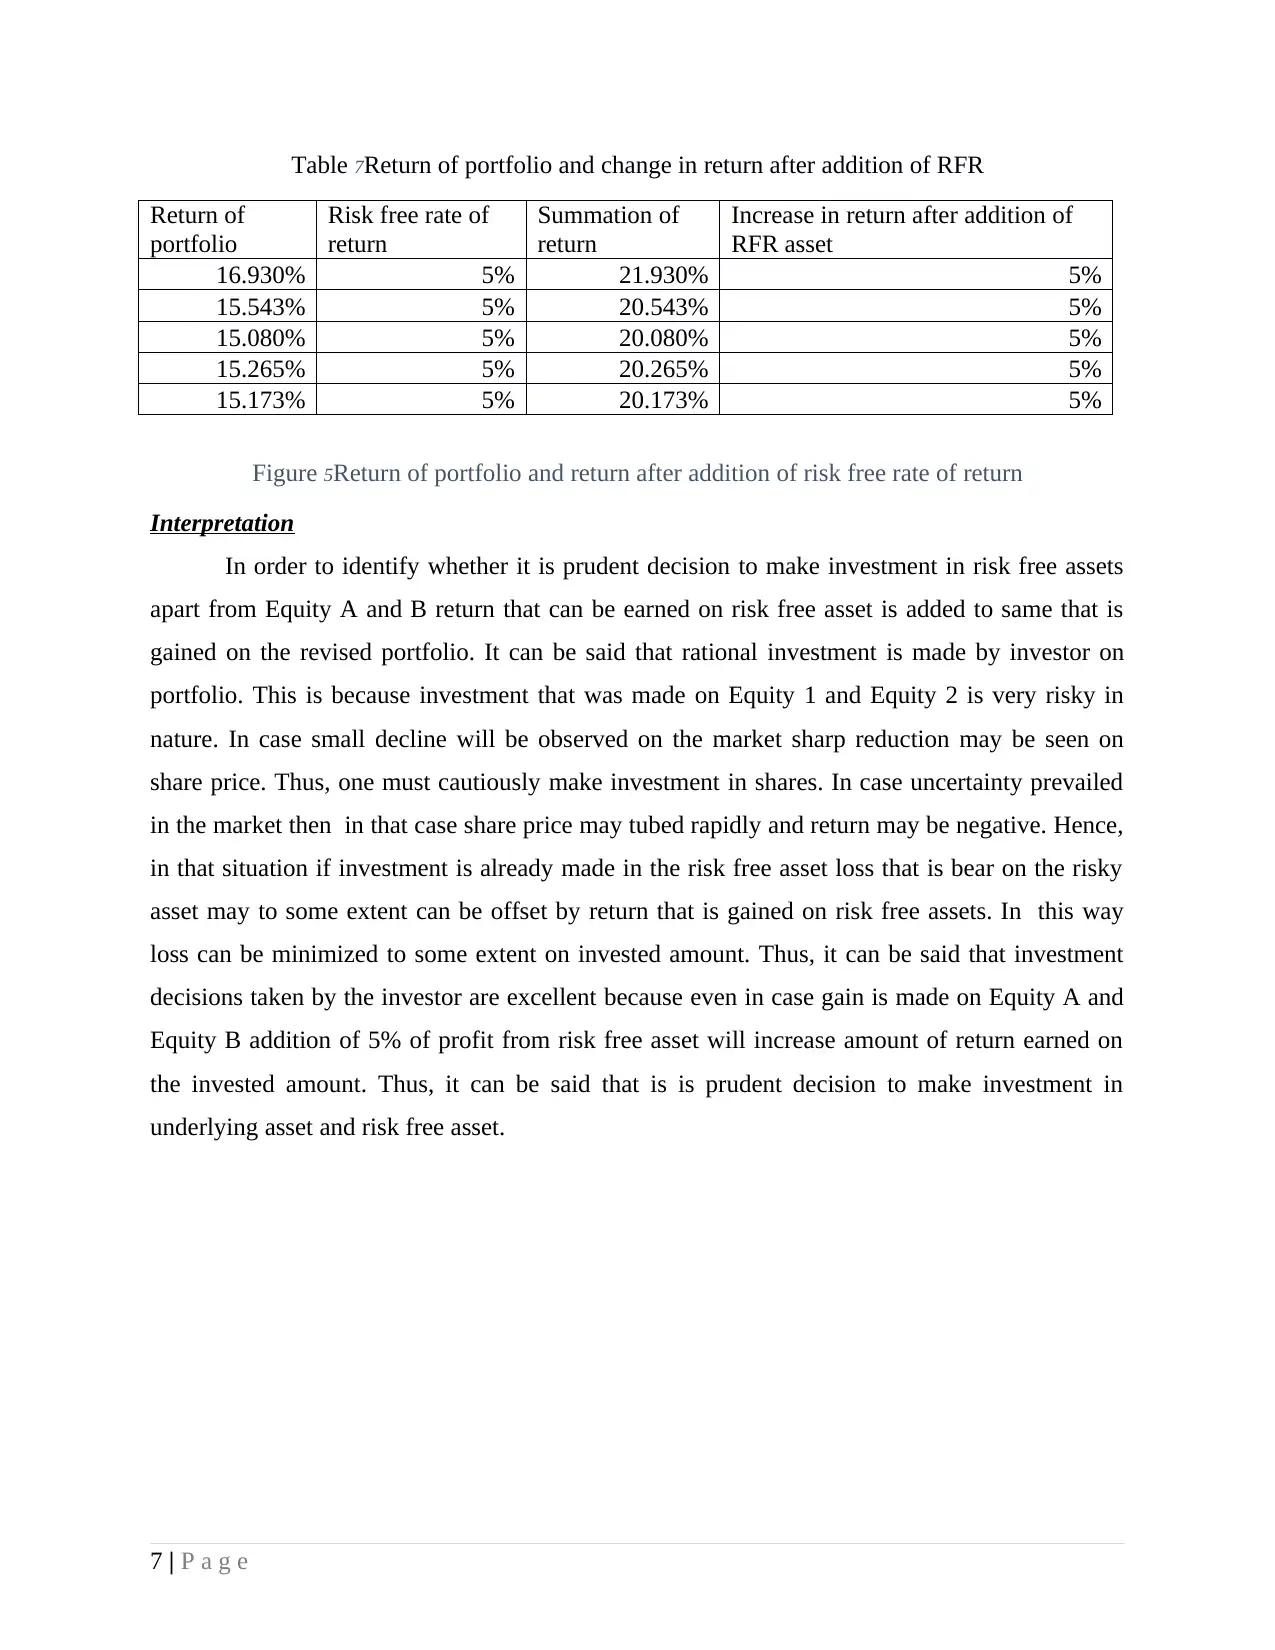
Table 7Return of portfolio and change in return after addition of RFR
Return of
portfolio
Risk free rate of
return
Summation of
return
Increase in return after addition of
RFR asset
16.930% 5% 21.930% 5%
15.543% 5% 20.543% 5%
15.080% 5% 20.080% 5%
15.265% 5% 20.265% 5%
15.173% 5% 20.173% 5%
Figure 5Return of portfolio and return after addition of risk free rate of return
Interpretation
In order to identify whether it is prudent decision to make investment in risk free assets
apart from Equity A and B return that can be earned on risk free asset is added to same that is
gained on the revised portfolio. It can be said that rational investment is made by investor on
portfolio. This is because investment that was made on Equity 1 and Equity 2 is very risky in
nature. In case small decline will be observed on the market sharp reduction may be seen on
share price. Thus, one must cautiously make investment in shares. In case uncertainty prevailed
in the market then in that case share price may tubed rapidly and return may be negative. Hence,
in that situation if investment is already made in the risk free asset loss that is bear on the risky
asset may to some extent can be offset by return that is gained on risk free assets. In this way
loss can be minimized to some extent on invested amount. Thus, it can be said that investment
decisions taken by the investor are excellent because even in case gain is made on Equity A and
Equity B addition of 5% of profit from risk free asset will increase amount of return earned on
the invested amount. Thus, it can be said that is is prudent decision to make investment in
underlying asset and risk free asset.
7 | P a g e
Paraphrase This Document
Need a fresh take? Get an instant paraphrase of this document with our AI Paraphraser
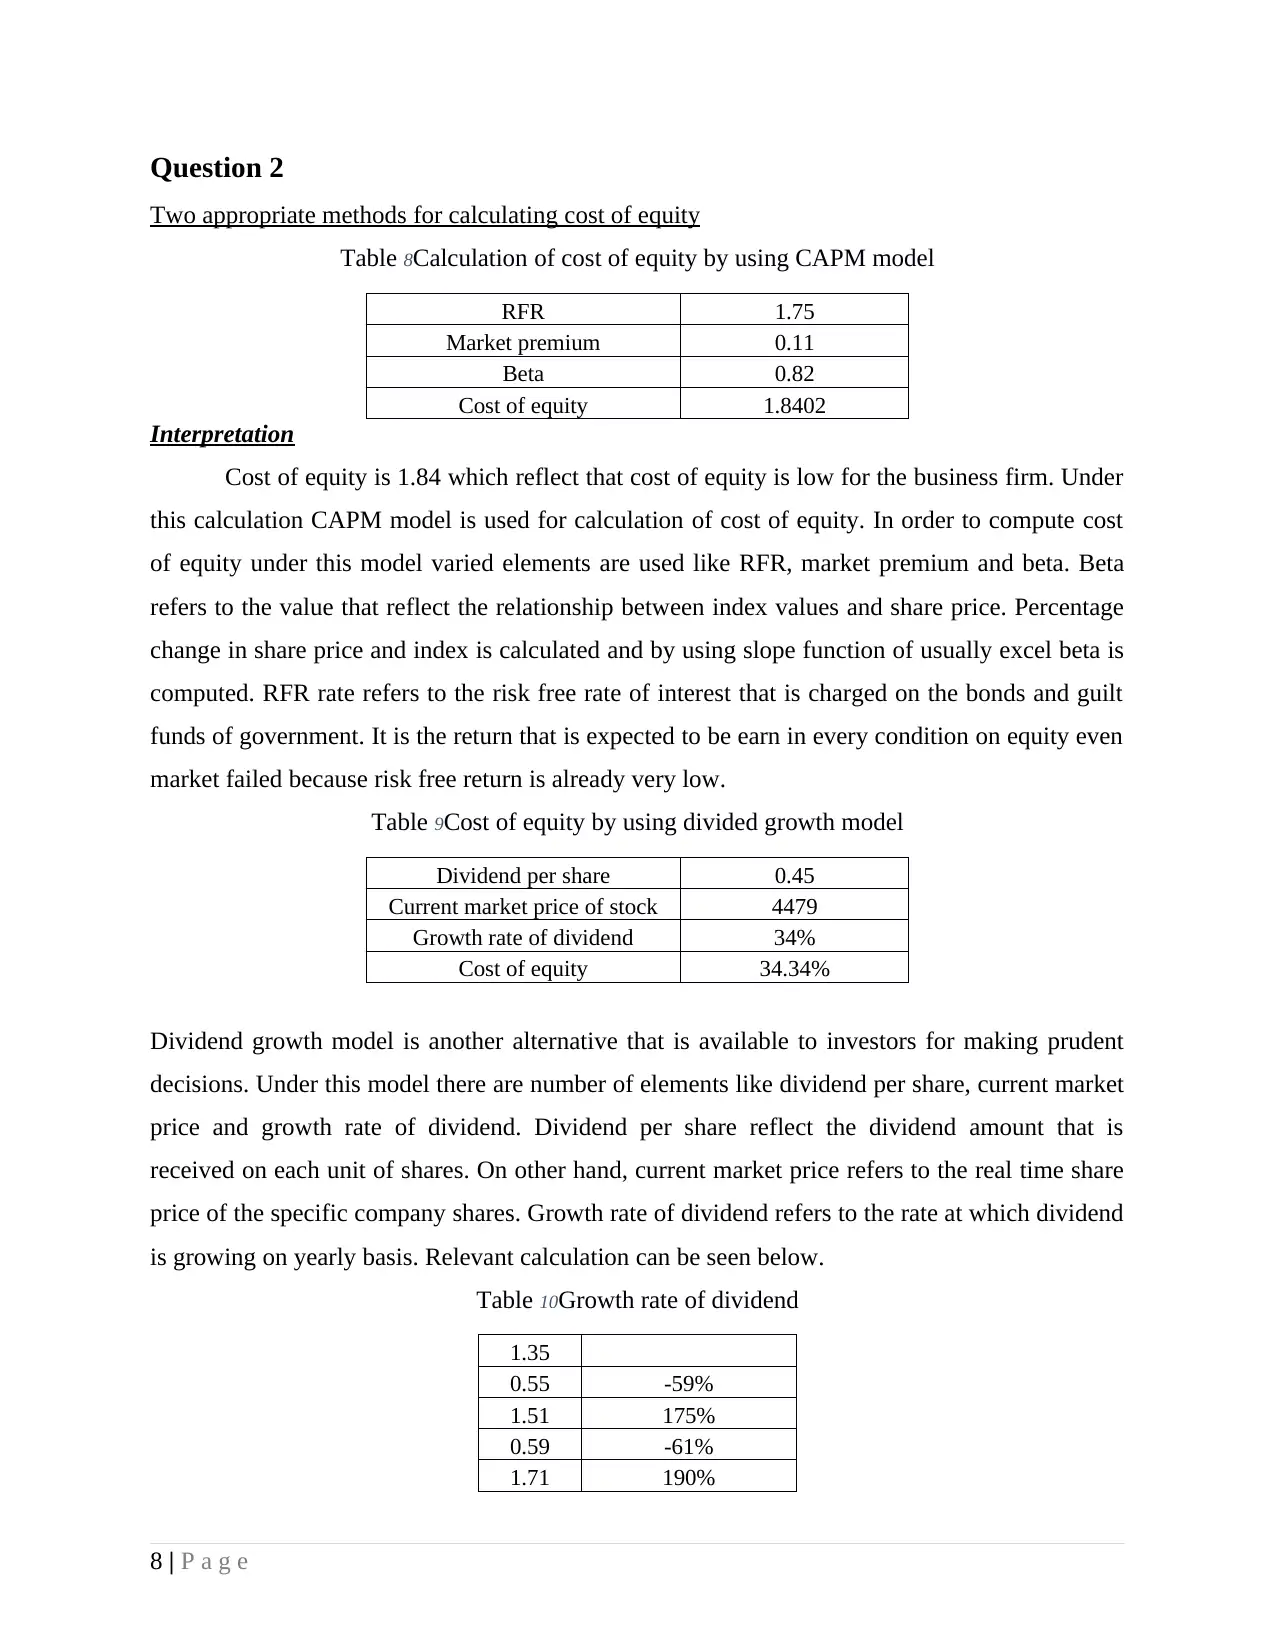
Question 2
Two appropriate methods for calculating cost of equity
Table 8Calculation of cost of equity by using CAPM model
RFR 1.75
Market premium 0.11
Beta 0.82
Cost of equity 1.8402
Interpretation
Cost of equity is 1.84 which reflect that cost of equity is low for the business firm. Under
this calculation CAPM model is used for calculation of cost of equity. In order to compute cost
of equity under this model varied elements are used like RFR, market premium and beta. Beta
refers to the value that reflect the relationship between index values and share price. Percentage
change in share price and index is calculated and by using slope function of usually excel beta is
computed. RFR rate refers to the risk free rate of interest that is charged on the bonds and guilt
funds of government. It is the return that is expected to be earn in every condition on equity even
market failed because risk free return is already very low.
Table 9Cost of equity by using divided growth model
Dividend per share 0.45
Current market price of stock 4479
Growth rate of dividend 34%
Cost of equity 34.34%
Dividend growth model is another alternative that is available to investors for making prudent
decisions. Under this model there are number of elements like dividend per share, current market
price and growth rate of dividend. Dividend per share reflect the dividend amount that is
received on each unit of shares. On other hand, current market price refers to the real time share
price of the specific company shares. Growth rate of dividend refers to the rate at which dividend
is growing on yearly basis. Relevant calculation can be seen below.
Table 10Growth rate of dividend
1.35
0.55 -59%
1.51 175%
0.59 -61%
1.71 190%
8 | P a g e
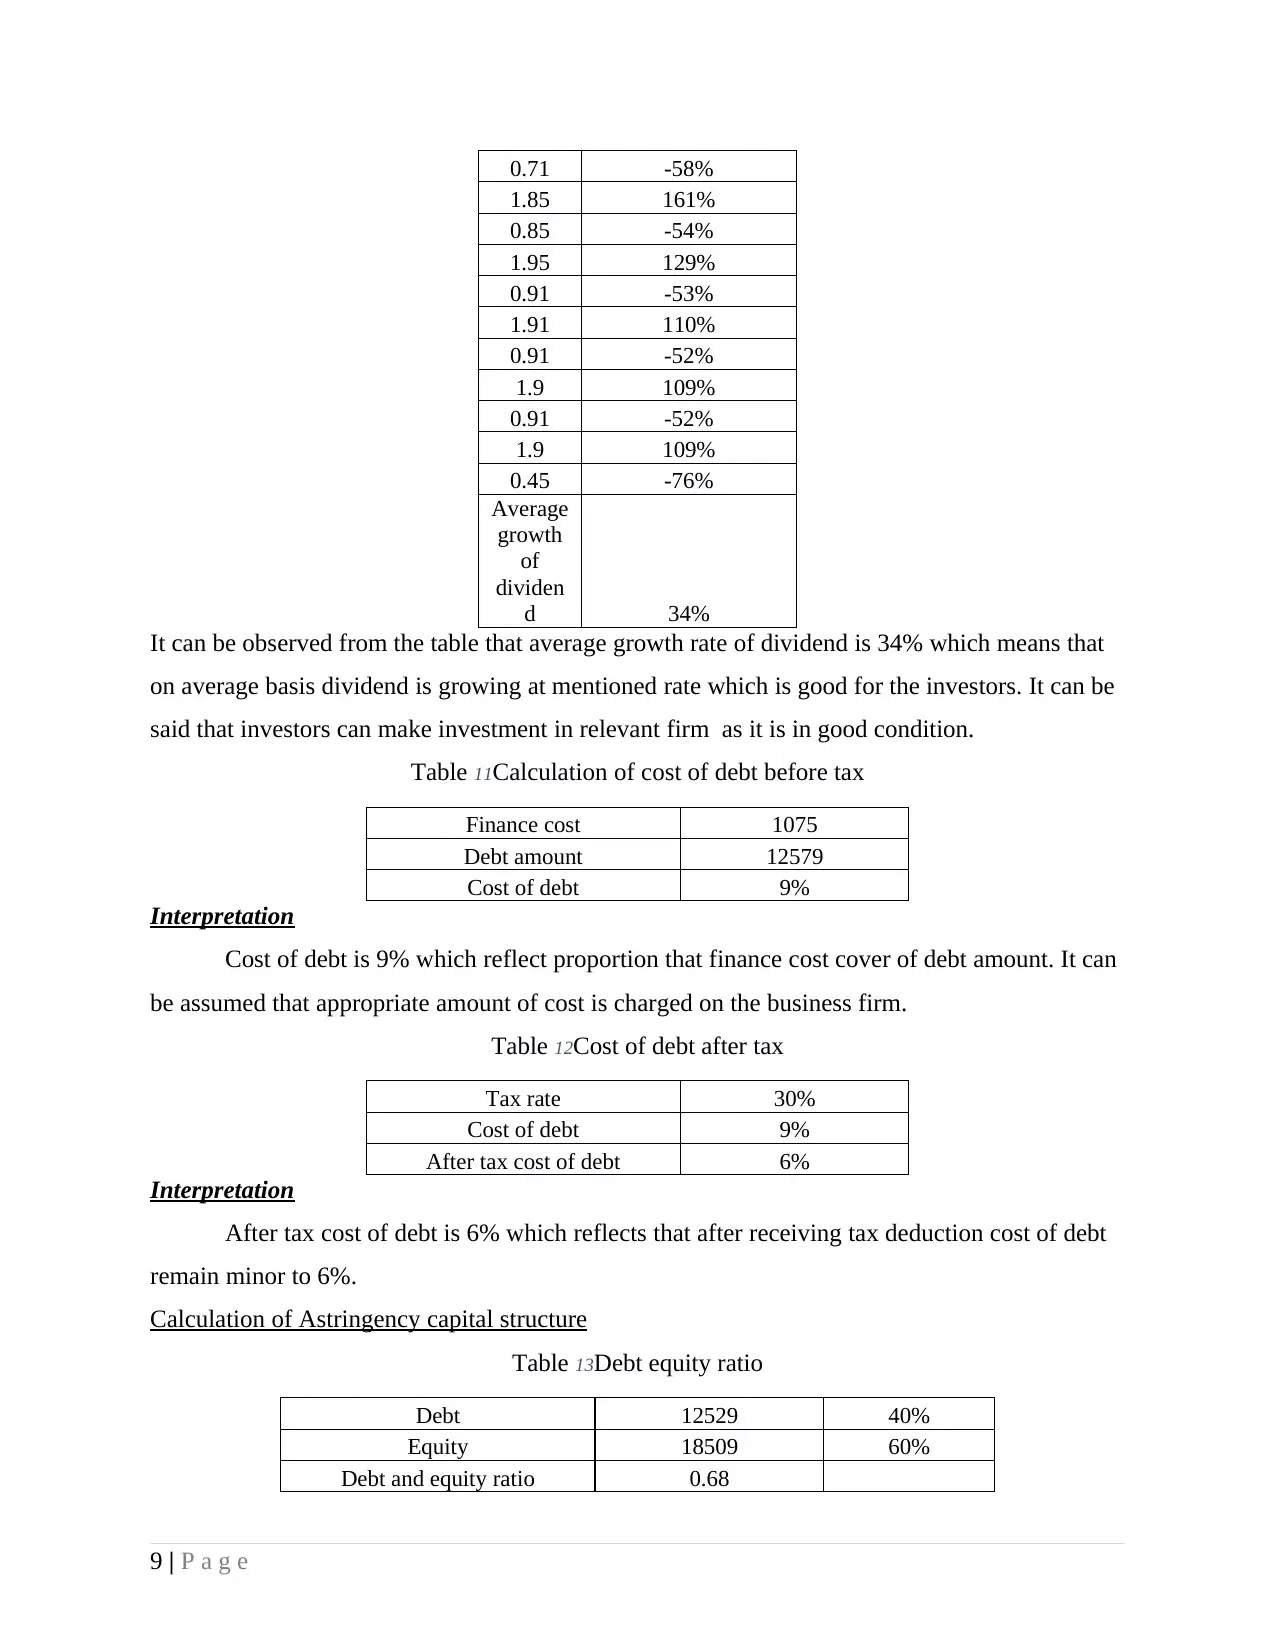
0.71 -58%
1.85 161%
0.85 -54%
1.95 129%
0.91 -53%
1.91 110%
0.91 -52%
1.9 109%
0.91 -52%
1.9 109%
0.45 -76%
Average
growth
of
dividen
d 34%
It can be observed from the table that average growth rate of dividend is 34% which means that
on average basis dividend is growing at mentioned rate which is good for the investors. It can be
said that investors can make investment in relevant firm as it is in good condition.
Table 11Calculation of cost of debt before tax
Finance cost 1075
Debt amount 12579
Cost of debt 9%
Interpretation
Cost of debt is 9% which reflect proportion that finance cost cover of debt amount. It can
be assumed that appropriate amount of cost is charged on the business firm.
Table 12Cost of debt after tax
Tax rate 30%
Cost of debt 9%
After tax cost of debt 6%
Interpretation
After tax cost of debt is 6% which reflects that after receiving tax deduction cost of debt
remain minor to 6%.
Calculation of Astringency capital structure
Table 13Debt equity ratio
Debt 12529 40%
Equity 18509 60%
Debt and equity ratio 0.68
9 | P a g e
31038
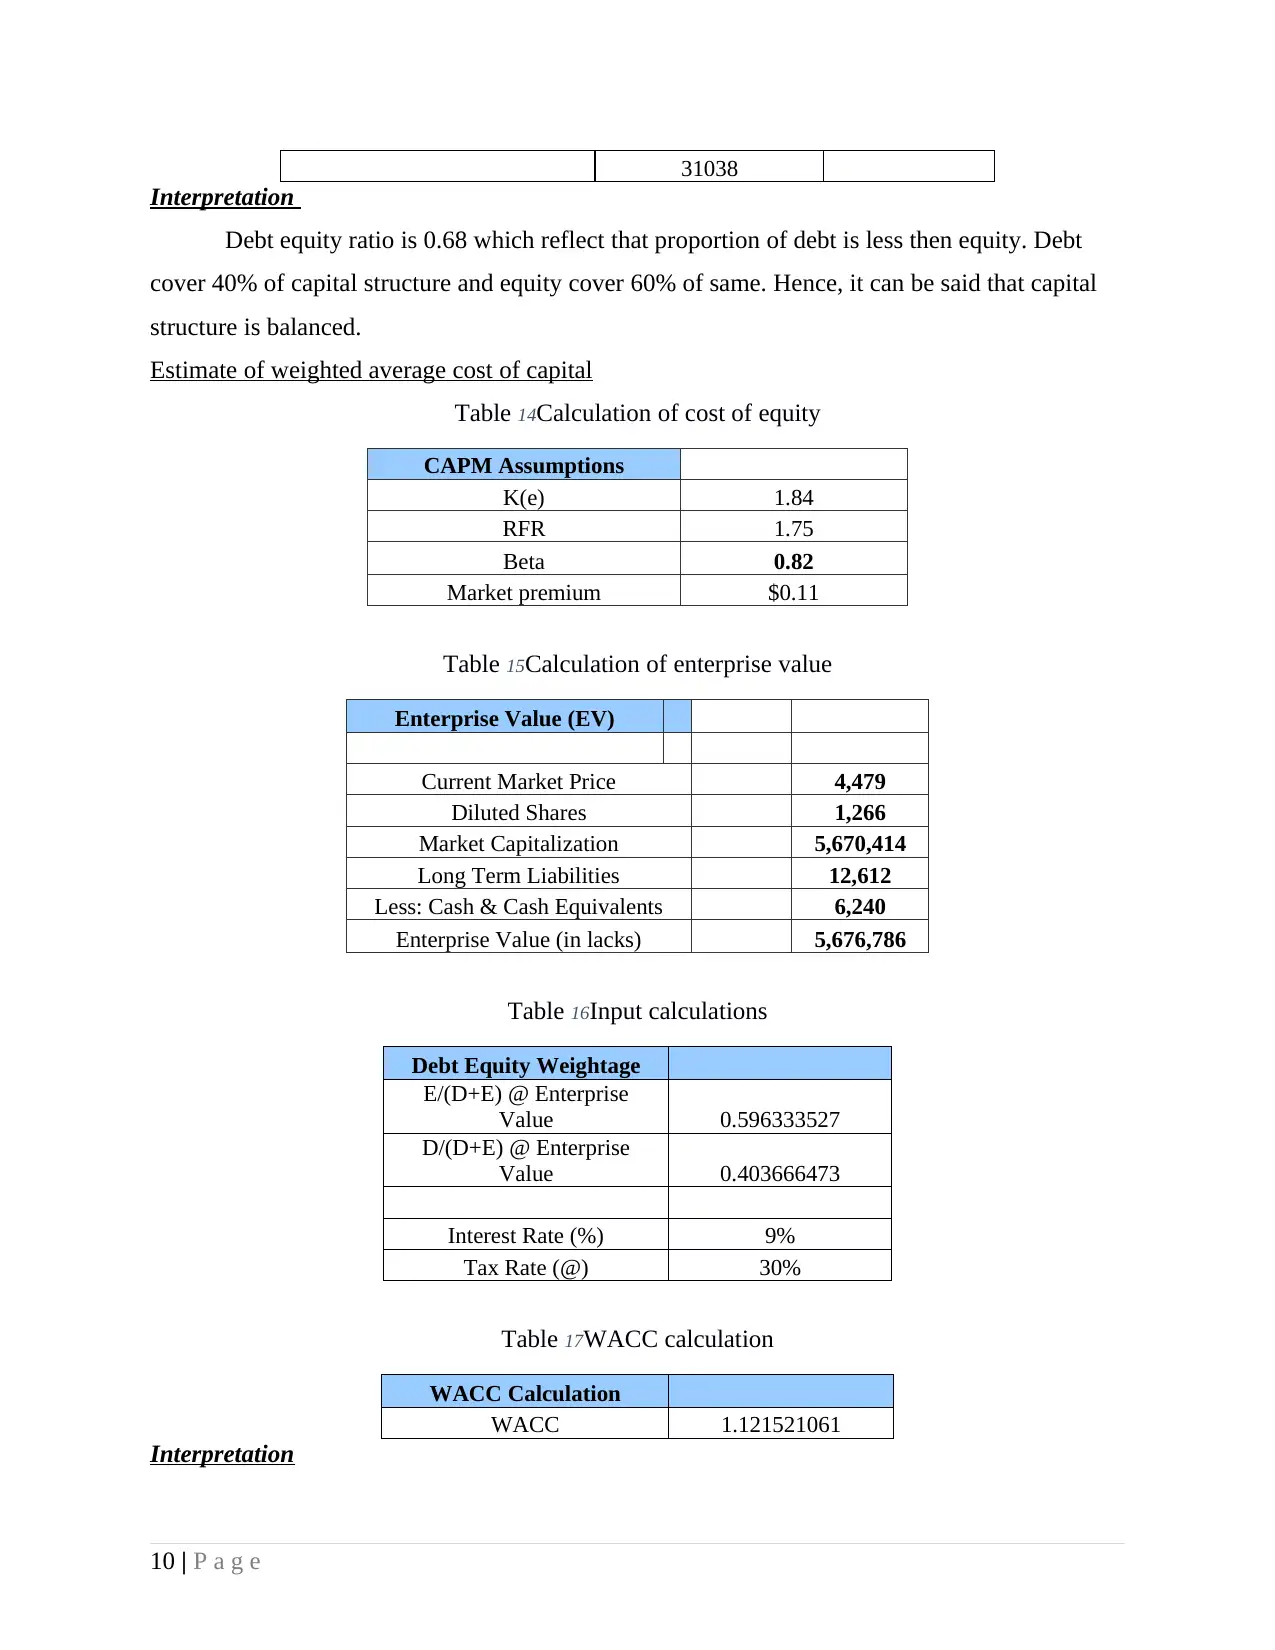
Interpretation
Debt equity ratio is 0.68 which reflect that proportion of debt is less then equity. Debt
cover 40% of capital structure and equity cover 60% of same. Hence, it can be said that capital
structure is balanced.
Estimate of weighted average cost of capital
Table 14Calculation of cost of equity
CAPM Assumptions
K(e) 1.84
RFR 1.75
Beta 0.82
Market premium $0.11
Table 15Calculation of enterprise value
Enterprise Value (EV)
Current Market Price 4,479
Diluted Shares 1,266
Market Capitalization 5,670,414
Long Term Liabilities 12,612
Less: Cash & Cash Equivalents 6,240
Enterprise Value (in lacks) 5,676,786
Table 16Input calculations
Debt Equity Weightage
E/(D+E) @ Enterprise
Value 0.596333527
D/(D+E) @ Enterprise
Value 0.403666473
Interest Rate (%) 9%
Tax Rate (@) 30%
Table 17WACC calculation
WACC Calculation
WACC 1.121521061
Interpretation
10 | P a g e
Interpretation
Debt equity ratio is 0.68 which reflect that proportion of debt is less then equity. Debt
cover 40% of capital structure and equity cover 60% of same. Hence, it can be said that capital
structure is balanced.
Estimate of weighted average cost of capital
Table 14Calculation of cost of equity
CAPM Assumptions
K(e) 1.84
RFR 1.75
Beta 0.82
Market premium $0.11
Table 15Calculation of enterprise value
Enterprise Value (EV)
Current Market Price 4,479
Diluted Shares 1,266
Market Capitalization 5,670,414
Long Term Liabilities 12,612
Less: Cash & Cash Equivalents 6,240
Enterprise Value (in lacks) 5,676,786
Table 16Input calculations
Debt Equity Weightage
E/(D+E) @ Enterprise
Value 0.596333527
D/(D+E) @ Enterprise
Value 0.403666473
Interest Rate (%) 9%
Tax Rate (@) 30%
Table 17WACC calculation
WACC Calculation
WACC 1.121521061
Interpretation
10 | P a g e
Secure Best Marks with AI Grader
Need help grading? Try our AI Grader for instant feedback on your assignments.
Cost of equity is computed by using CAPM model which is explained above. Cost of
debt is computed by identifying percentage of interest of debt amount. Weight of equity is
multiplied to cost of same and same approach is followed for debt. Finally, weighted average
cost of capital is computed and its value is 1.21% which is very low and it can be said that cost
of finance is very low for the firm.
Question 3
Efficient market hypothesis
Efficient market hypothesis reflects that any investor can not earn more than return that
market generated. Share price fluctuation contain impact of information that is in the market.
According to intensity of news relevant change's comes in the share price. It is difficult for fund
managers to outperform market because price keeps on changing consistently and in such
conditions good amount return can not be gained (What is efficient market hypothesis, 2017). It
is hard for them to make accurate estimation of changes that may occur in share price due to any
news. Table 1 indicate that EMH is not perfect theory because when any news come investors
react to same. They become panic on single bad news sale their open positions without thinking
rationally. This is the reason due to which percentage outperformed is high in table 1. Portfolio
managers know investors behaviour and on that basis when news come in market they formulate
hypothesis to ensure that portfolio will generate positive return for them. It can be observed that
in many mutual fund schemes portfolio turnover is very high and this happened because fund
managers on the basis of experience make idea about panic level of investors and on time them
make decisions. In this way even market declined they safely earn appropriate amount of return
for investors.
CONCLUSION
On the basis of above discussion it is concluded that there is huge importance of
corporate finance domain for the investors because same help them in making prudent decisions.
There are number of methods that are used by managers for making investment decisions for
their investors. It is also concluded that investors must try to develop their knowledge about the
market because by doing so they can make prudent decisions about the market. Number of
techniques can be used to make wise decisions. Investors on the basis of results must decide
whether to invest or not in specific security.
11 | P a g e

REFERNECES
Books and Journals
What is efficient market hypothesis, 2017. [Online]. Available through:<
http://www.nasdaq.com/article/investing-basics-what-is-the-efficient-market-hypothesis-
and-what-are-its-shortcomings-cm530860>. [Accessed on 3rd August 2017].
12 | P a g e
Books and Journals
What is efficient market hypothesis, 2017. [Online]. Available through:<
http://www.nasdaq.com/article/investing-basics-what-is-the-efficient-market-hypothesis-
and-what-are-its-shortcomings-cm530860>. [Accessed on 3rd August 2017].
12 | P a g e
1 out of 12
Related Documents


![[SOLVED] JB HiFi Ltd Investment Analysis](/_next/image/?url=https%3A%2F%2Fdesklib.com%2Fmedia%2Fimages%2Fwh%2F8a736aa746774d07b1a1dbe34576782e.jpg&w=256&q=75)


Your All-in-One AI-Powered Toolkit for Academic Success.
+13062052269
info@desklib.com
Available 24*7 on WhatsApp / Email
![[object Object]](/_next/static/media/star-bottom.7253800d.svg)
Unlock your academic potential
© 2024 | Zucol Services PVT LTD | All rights reserved.