Corporate Finance of Reeby Sports
VerifiedAdded on 2022/08/13
|7
|887
|16
AI Summary
Contribute Materials
Your contribution can guide someone’s learning journey. Share your
documents today.
Running head: CORPORATE FINANCE
Corporate Finance
Name of the Student:
Name of the University:
Author’s Note:
Corporate Finance
Name of the Student:
Name of the University:
Author’s Note:
Secure Best Marks with AI Grader
Need help grading? Try our AI Grader for instant feedback on your assignments.
1CORPORATE FINANCE
Table of Contents
Question 1........................................................................................................................................2
Question 2........................................................................................................................................3
Question 3........................................................................................................................................3
Question 4........................................................................................................................................4
Bibliography....................................................................................................................................6
2CORPORATE FINANCE
Question 1
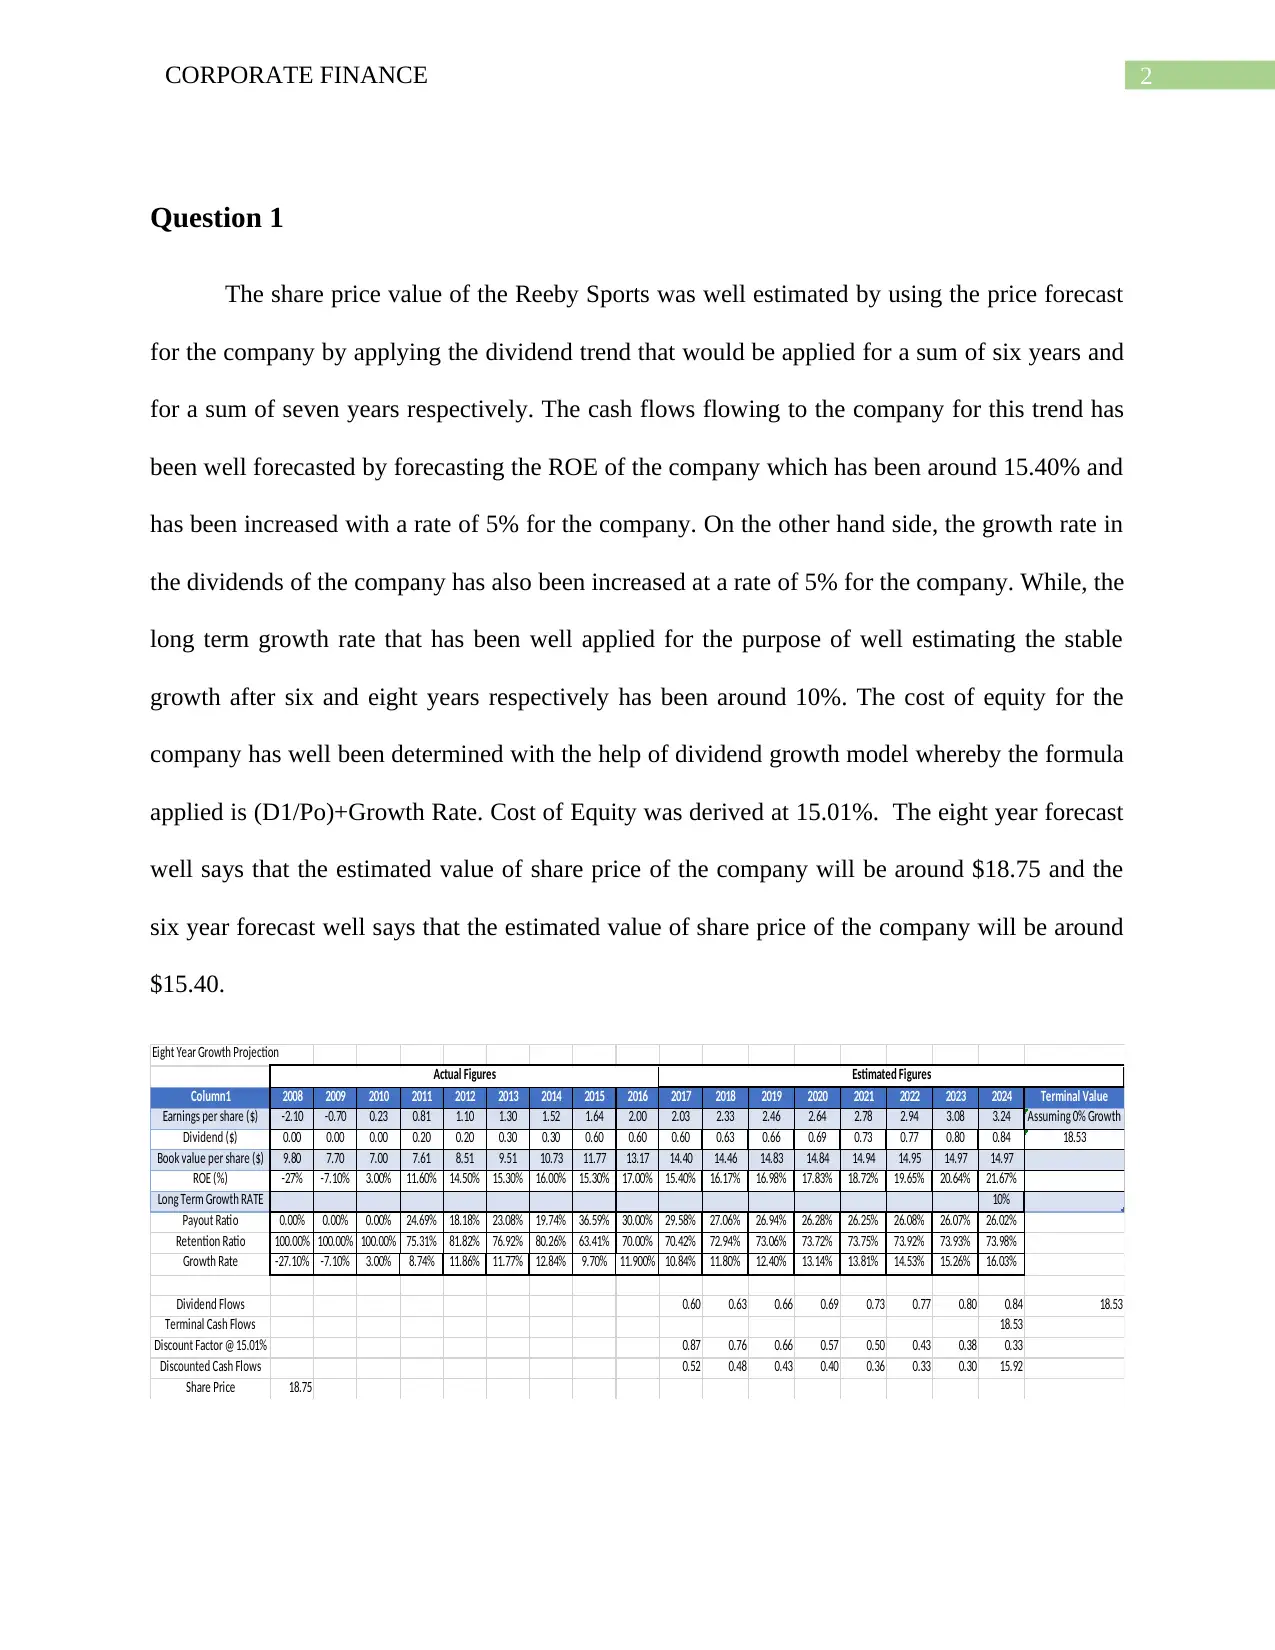
The share price value of the Reeby Sports was well estimated by using the price forecast
for the company by applying the dividend trend that would be applied for a sum of six years and
for a sum of seven years respectively. The cash flows flowing to the company for this trend has
been well forecasted by forecasting the ROE of the company which has been around 15.40% and
has been increased with a rate of 5% for the company. On the other hand side, the growth rate in
the dividends of the company has also been increased at a rate of 5% for the company. While, the
long term growth rate that has been well applied for the purpose of well estimating the stable
growth after six and eight years respectively has been around 10%. The cost of equity for the
company has well been determined with the help of dividend growth model whereby the formula
applied is (D1/Po)+Growth Rate. Cost of Equity was derived at 15.01%. The eight year forecast
well says that the estimated value of share price of the company will be around $18.75 and the
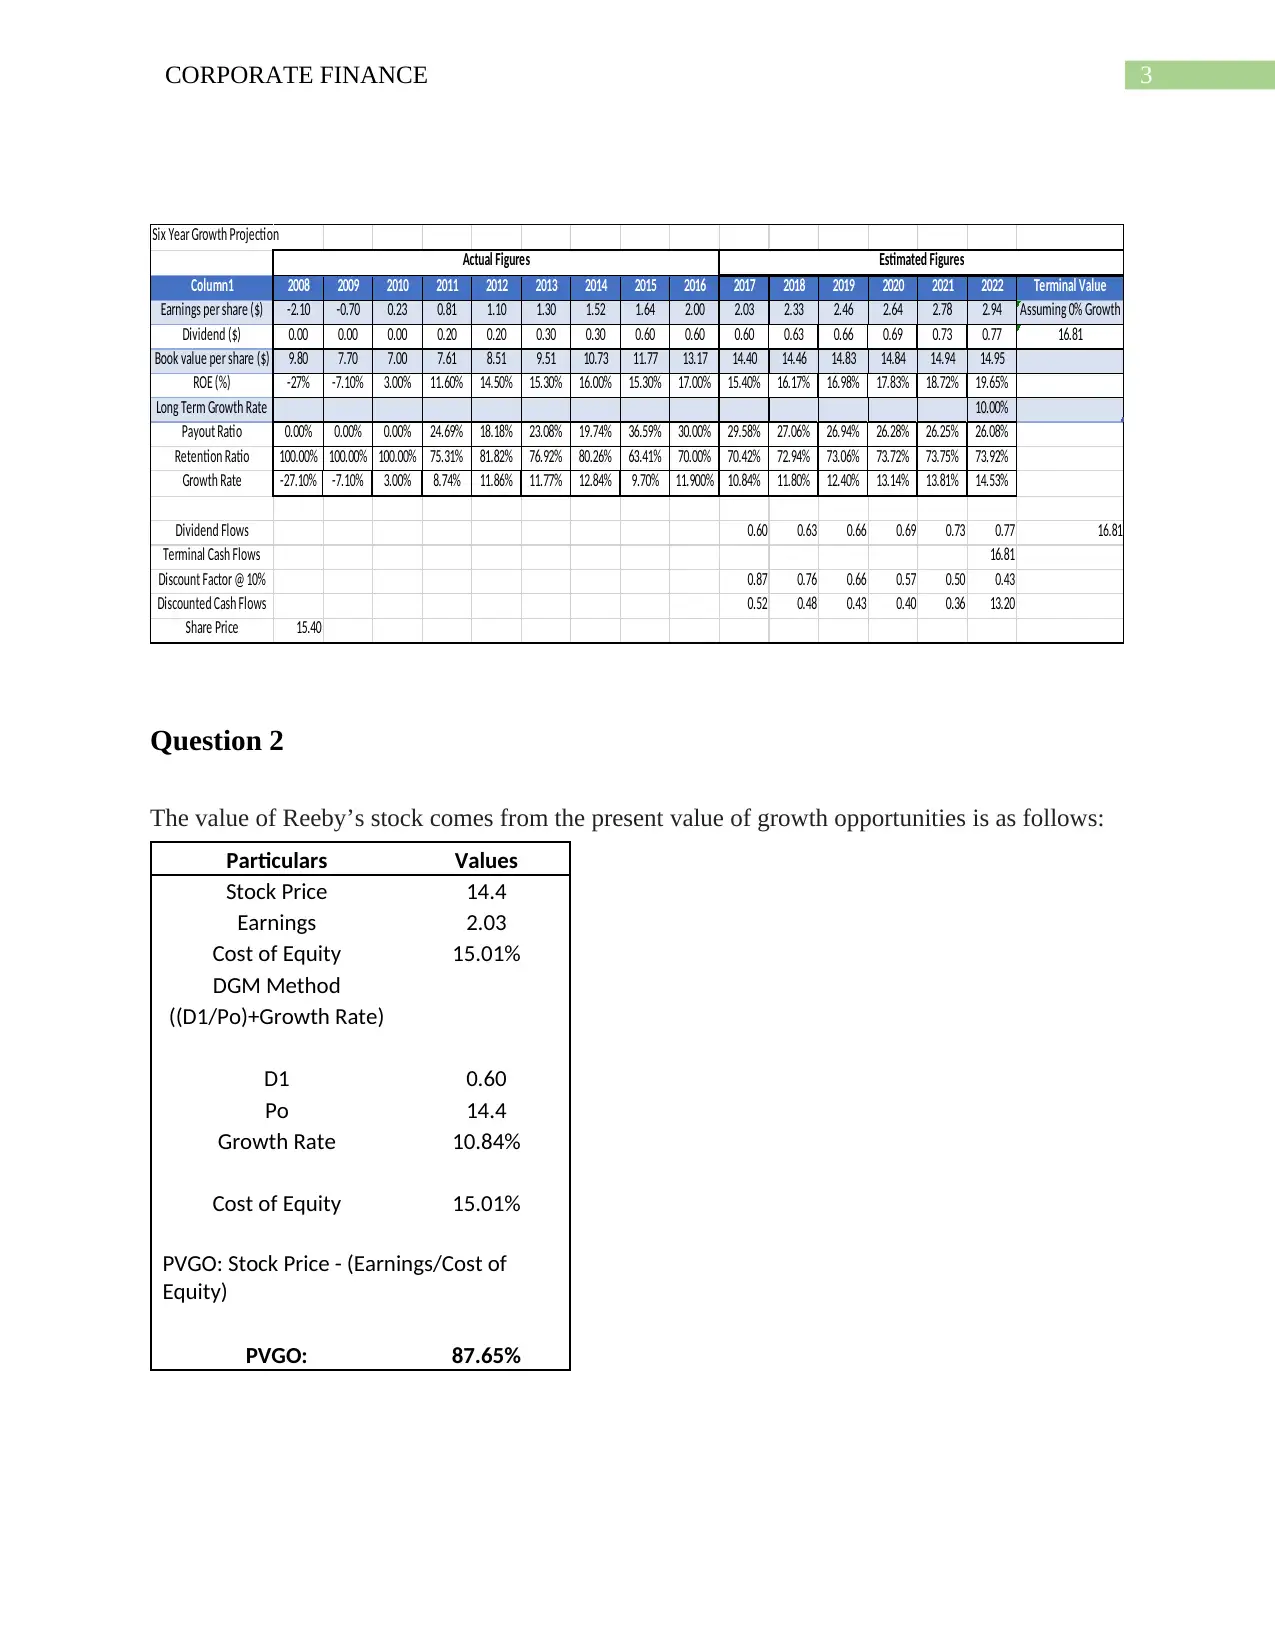
six year forecast well says that the estimated value of share price of the company will be around
$15.40.
Eight Year Growth Projection
Column1 2008 2009 2010 2011 2012 2013 2014 2015 2016 2017 2018 2019 2020 2021 2022 2023 2024 Terminal Value
Earnings per share ($) -2.10 -0.70 0.23 0.81 1.10 1.30 1.52 1.64 2.00 2.03 2.33 2.46 2.64 2.78 2.94 3.08 3.24 Assuming 0% Growth
Dividend ($) 0.00 0.00 0.00 0.20 0.20 0.30 0.30 0.60 0.60 0.60 0.63 0.66 0.69 0.73 0.77 0.80 0.84 18.53
Book value per share ($) 9.80 7.70 7.00 7.61 8.51 9.51 10.73 11.77 13.17 14.40 14.46 14.83 14.84 14.94 14.95 14.97 14.97
ROE (%) -27% -7.10% 3.00% 11.60% 14.50% 15.30% 16.00% 15.30% 17.00% 15.40% 16.17% 16.98% 17.83% 18.72% 19.65% 20.64% 21.67%
Long Term Growth RATE 10%
Payout Ratio 0.00% 0.00% 0.00% 24.69% 18.18% 23.08% 19.74% 36.59% 30.00% 29.58% 27.06% 26.94% 26.28% 26.25% 26.08% 26.07% 26.02%
Retention Ratio 100.00% 100.00% 100.00% 75.31% 81.82% 76.92% 80.26% 63.41% 70.00% 70.42% 72.94% 73.06% 73.72% 73.75% 73.92% 73.93% 73.98%
Growth Rate -27.10% -7.10% 3.00% 8.74% 11.86% 11.77% 12.84% 9.70% 11.900% 10.84% 11.80% 12.40% 13.14% 13.81% 14.53% 15.26% 16.03%
Dividend Flows 0.60 0.63 0.66 0.69 0.73 0.77 0.80 0.84 18.53
Terminal Cash Flows 18.53
Discount Factor @ 15.01% 0.87 0.76 0.66 0.57 0.50 0.43 0.38 0.33
Discounted Cash Flows 0.52 0.48 0.43 0.40 0.36 0.33 0.30 15.92
Share Price 18.75
Actual Figures Estimated Figures
Question 1
The share price value of the Reeby Sports was well estimated by using the price forecast
for the company by applying the dividend trend that would be applied for a sum of six years and
for a sum of seven years respectively. The cash flows flowing to the company for this trend has
been well forecasted by forecasting the ROE of the company which has been around 15.40% and
has been increased with a rate of 5% for the company. On the other hand side, the growth rate in
the dividends of the company has also been increased at a rate of 5% for the company. While, the
long term growth rate that has been well applied for the purpose of well estimating the stable
growth after six and eight years respectively has been around 10%. The cost of equity for the
company has well been determined with the help of dividend growth model whereby the formula
applied is (D1/Po)+Growth Rate. Cost of Equity was derived at 15.01%. The eight year forecast
well says that the estimated value of share price of the company will be around $18.75 and the
six year forecast well says that the estimated value of share price of the company will be around
$15.40.
Eight Year Growth Projection
Column1 2008 2009 2010 2011 2012 2013 2014 2015 2016 2017 2018 2019 2020 2021 2022 2023 2024 Terminal Value
Earnings per share ($) -2.10 -0.70 0.23 0.81 1.10 1.30 1.52 1.64 2.00 2.03 2.33 2.46 2.64 2.78 2.94 3.08 3.24 Assuming 0% Growth
Dividend ($) 0.00 0.00 0.00 0.20 0.20 0.30 0.30 0.60 0.60 0.60 0.63 0.66 0.69 0.73 0.77 0.80 0.84 18.53
Book value per share ($) 9.80 7.70 7.00 7.61 8.51 9.51 10.73 11.77 13.17 14.40 14.46 14.83 14.84 14.94 14.95 14.97 14.97
ROE (%) -27% -7.10% 3.00% 11.60% 14.50% 15.30% 16.00% 15.30% 17.00% 15.40% 16.17% 16.98% 17.83% 18.72% 19.65% 20.64% 21.67%
Long Term Growth RATE 10%
Payout Ratio 0.00% 0.00% 0.00% 24.69% 18.18% 23.08% 19.74% 36.59% 30.00% 29.58% 27.06% 26.94% 26.28% 26.25% 26.08% 26.07% 26.02%
Retention Ratio 100.00% 100.00% 100.00% 75.31% 81.82% 76.92% 80.26% 63.41% 70.00% 70.42% 72.94% 73.06% 73.72% 73.75% 73.92% 73.93% 73.98%
Growth Rate -27.10% -7.10% 3.00% 8.74% 11.86% 11.77% 12.84% 9.70% 11.900% 10.84% 11.80% 12.40% 13.14% 13.81% 14.53% 15.26% 16.03%
Dividend Flows 0.60 0.63 0.66 0.69 0.73 0.77 0.80 0.84 18.53
Terminal Cash Flows 18.53
Discount Factor @ 15.01% 0.87 0.76 0.66 0.57 0.50 0.43 0.38 0.33
Discounted Cash Flows 0.52 0.48 0.43 0.40 0.36 0.33 0.30 15.92
Share Price 18.75
Actual Figures Estimated Figures
3CORPORATE FINANCE
Six Year Growth Projection
Column1 2008 2009 2010 2011 2012 2013 2014 2015 2016 2017 2018 2019 2020 2021 2022 Terminal Value
Earnings per share ($) -2.10 -0.70 0.23 0.81 1.10 1.30 1.52 1.64 2.00 2.03 2.33 2.46 2.64 2.78 2.94 Assuming 0% Growth
Dividend ($) 0.00 0.00 0.00 0.20 0.20 0.30 0.30 0.60 0.60 0.60 0.63 0.66 0.69 0.73 0.77 16.81
Book value per share ($) 9.80 7.70 7.00 7.61 8.51 9.51 10.73 11.77 13.17 14.40 14.46 14.83 14.84 14.94 14.95
ROE (%) -27% -7.10% 3.00% 11.60% 14.50% 15.30% 16.00% 15.30% 17.00% 15.40% 16.17% 16.98% 17.83% 18.72% 19.65%
Long Term Growth Rate 10.00%
Payout Ratio 0.00% 0.00% 0.00% 24.69% 18.18% 23.08% 19.74% 36.59% 30.00% 29.58% 27.06% 26.94% 26.28% 26.25% 26.08%
Retention Ratio 100.00% 100.00% 100.00% 75.31% 81.82% 76.92% 80.26% 63.41% 70.00% 70.42% 72.94% 73.06% 73.72% 73.75% 73.92%
Growth Rate -27.10% -7.10% 3.00% 8.74% 11.86% 11.77% 12.84% 9.70% 11.900% 10.84% 11.80% 12.40% 13.14% 13.81% 14.53%
Dividend Flows 0.60 0.63 0.66 0.69 0.73 0.77 16.81
Terminal Cash Flows 16.81
Discount Factor @ 10% 0.87 0.76 0.66 0.57 0.50 0.43
Discounted Cash Flows 0.52 0.48 0.43 0.40 0.36 13.20
Share Price 15.40
Actual Figures Estimated Figures
Question 2
The value of Reeby’s stock comes from the present value of growth opportunities is as follows:
Particulars Values
Stock Price 14.4
Earnings 2.03
Cost of Equity 15.01%
DGM Method
((D1/Po)+Growth Rate)
D1 0.60
Po 14.4
Growth Rate 10.84%
Cost of Equity 15.01%
PVGO: Stock Price - (Earnings/Cost of
Equity)
PVGO: 87.65%
Secure Best Marks with AI Grader
Need help grading? Try our AI Grader for instant feedback on your assignments.
4CORPORATE FINANCE
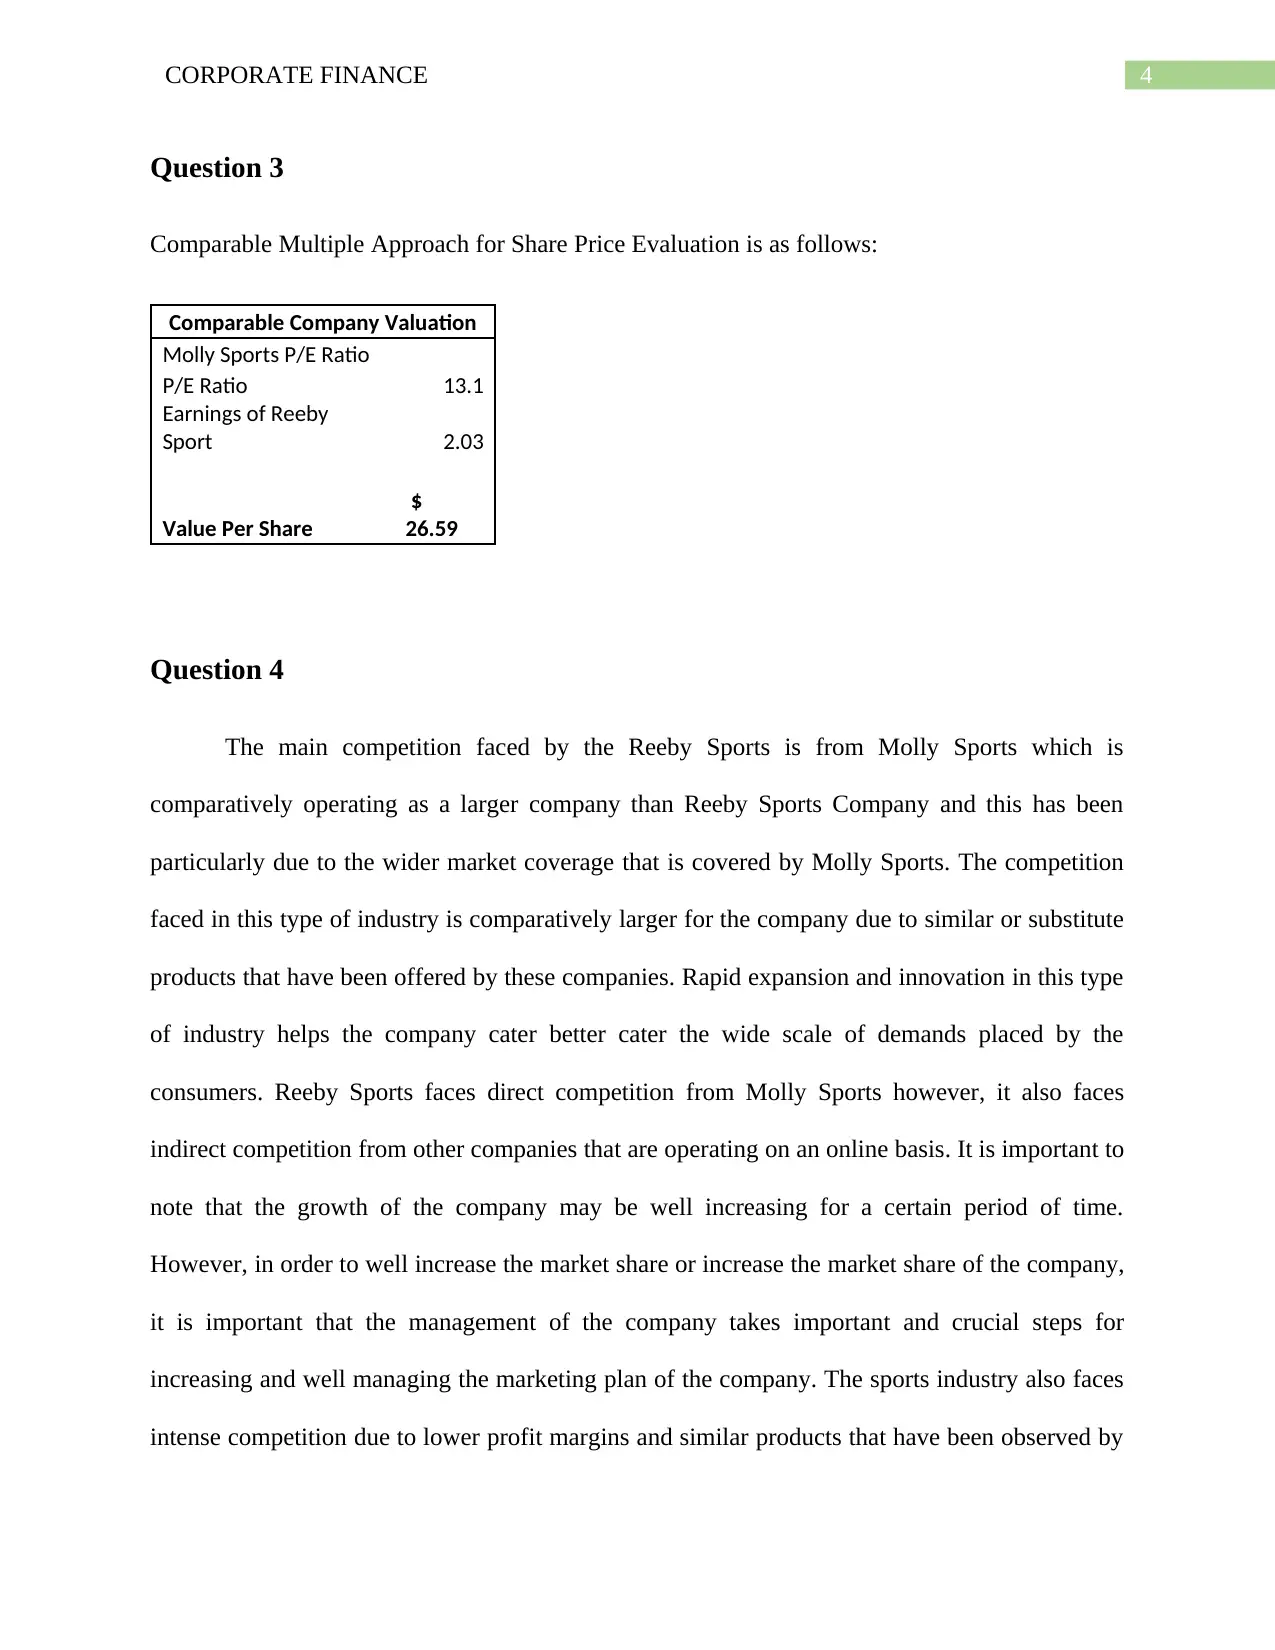
Question 3
Comparable Multiple Approach for Share Price Evaluation is as follows:
Comparable Company Valuation
Molly Sports P/E Ratio
P/E Ratio 13.1
Earnings of Reeby
Sport 2.03
Value Per Share
$
26.59
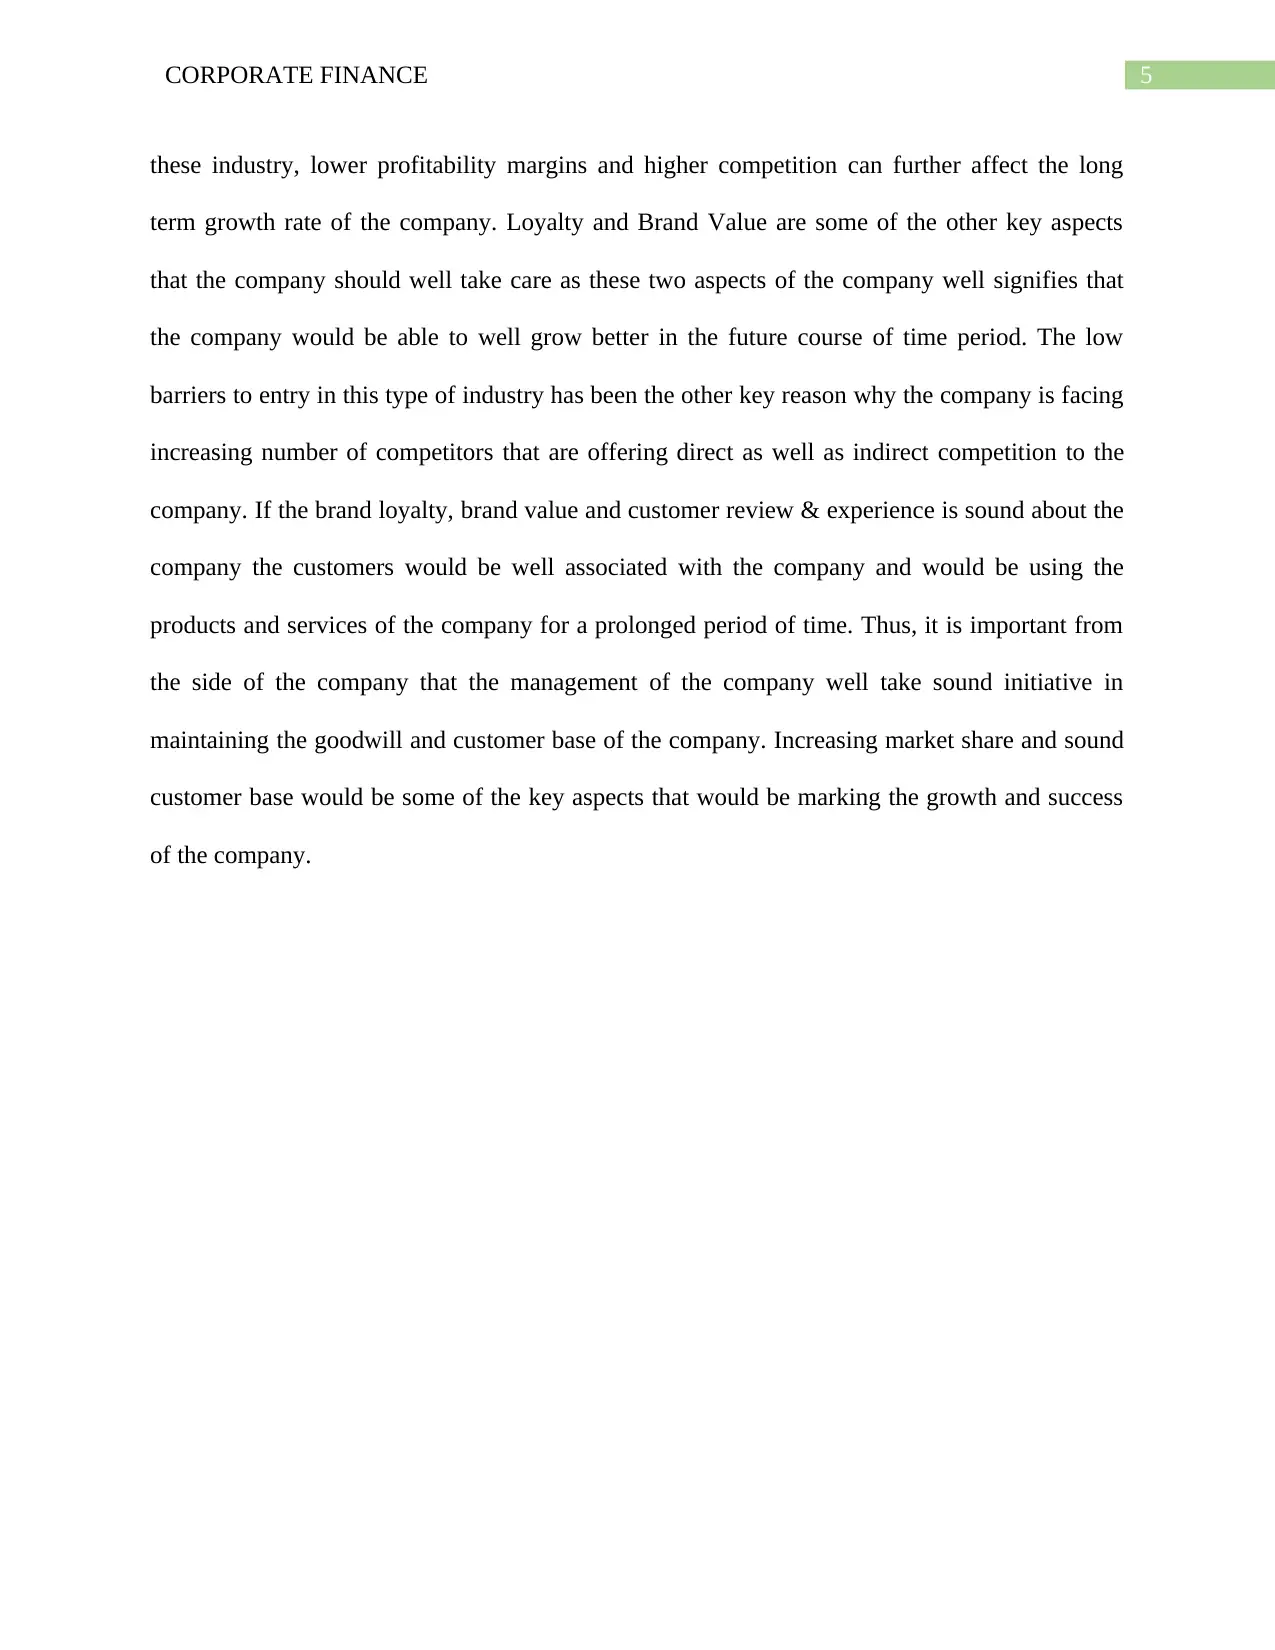
Question 4
The main competition faced by the Reeby Sports is from Molly Sports which is
comparatively operating as a larger company than Reeby Sports Company and this has been
particularly due to the wider market coverage that is covered by Molly Sports. The competition
faced in this type of industry is comparatively larger for the company due to similar or substitute
products that have been offered by these companies. Rapid expansion and innovation in this type
of industry helps the company cater better cater the wide scale of demands placed by the
consumers. Reeby Sports faces direct competition from Molly Sports however, it also faces
indirect competition from other companies that are operating on an online basis. It is important to
note that the growth of the company may be well increasing for a certain period of time.
However, in order to well increase the market share or increase the market share of the company,
it is important that the management of the company takes important and crucial steps for
increasing and well managing the marketing plan of the company. The sports industry also faces
intense competition due to lower profit margins and similar products that have been observed by
Question 3
Comparable Multiple Approach for Share Price Evaluation is as follows:
Comparable Company Valuation
Molly Sports P/E Ratio
P/E Ratio 13.1
Earnings of Reeby
Sport 2.03
Value Per Share
$
26.59
Question 4
The main competition faced by the Reeby Sports is from Molly Sports which is
comparatively operating as a larger company than Reeby Sports Company and this has been
particularly due to the wider market coverage that is covered by Molly Sports. The competition
faced in this type of industry is comparatively larger for the company due to similar or substitute
products that have been offered by these companies. Rapid expansion and innovation in this type
of industry helps the company cater better cater the wide scale of demands placed by the
consumers. Reeby Sports faces direct competition from Molly Sports however, it also faces
indirect competition from other companies that are operating on an online basis. It is important to
note that the growth of the company may be well increasing for a certain period of time.
However, in order to well increase the market share or increase the market share of the company,
it is important that the management of the company takes important and crucial steps for
increasing and well managing the marketing plan of the company. The sports industry also faces
intense competition due to lower profit margins and similar products that have been observed by
5CORPORATE FINANCE
these industry, lower profitability margins and higher competition can further affect the long
term growth rate of the company. Loyalty and Brand Value are some of the other key aspects
that the company should well take care as these two aspects of the company well signifies that
the company would be able to well grow better in the future course of time period. The low
barriers to entry in this type of industry has been the other key reason why the company is facing
increasing number of competitors that are offering direct as well as indirect competition to the
company. If the brand loyalty, brand value and customer review & experience is sound about the
company the customers would be well associated with the company and would be using the
products and services of the company for a prolonged period of time. Thus, it is important from
the side of the company that the management of the company well take sound initiative in
maintaining the goodwill and customer base of the company. Increasing market share and sound
customer base would be some of the key aspects that would be marking the growth and success
of the company.
6CORPORATE FINANCE
Bibliography
Adler, R.M., 2020. Competitive Marketing Strategy. In Bending the Law of Unintended
Consequences (pp. 153-171). Springer, Cham.
Cotterill, R.W., 2019. Competitive strategy analysis for agricultural marketing cooperatives.
CRC Press.
Cotterill, R.W., 2019. Competitive strategy analysis in the food system. CRC Press.
Spink, J.W., 2019. Marketing, Competitive Strategy, and Competitive Intelligence. In Food
Fraud Prevention (pp. 479-500). Springer, New York, NY.
1 out of 7
Related Documents


Your All-in-One AI-Powered Toolkit for Academic Success.
+13062052269
info@desklib.com
Available 24*7 on WhatsApp / Email
![[object Object]](/_next/static/media/star-bottom.7253800d.svg)
Unlock your academic potential
© 2024 | Zucol Services PVT LTD | All rights reserved.