LLP221 Corporate Finance: Financial Modeling and Revenue Projection
VerifiedAdded on 2023/06/12
|15
|3022
|345
Homework Assignment
AI Summary
This assignment solution delves into key corporate finance concepts, beginning with trend extrapolation methods for sales forecasting, comparing historical nominal and real growth rates, weighting historical growth rates, and using fundamentals based on GDP changes. It identifies the historical nominal growth rate as the most effective approach for sales growth. The solution also includes a sensitivity analysis for Take Five Systems, a startup developing a new app, examining various sales levels and growth rates under different scenarios, including changes in development time, unit sales, and selling prices, to determine the most favorable conditions for revenue generation. Finally, it provides a revenue forecast for a membership-based business, comparing actual and forecasted performance to assess the effectiveness of proposed revenue-increasing strategies.

LLP221 Corporate Finance
Paraphrase This Document
Need a fresh take? Get an instant paraphrase of this document with our AI Paraphraser
Table of Contents
TASK...............................................................................................................................................3
Question 1...............................................................................................................................3
Question 2...............................................................................................................................8
Question 3.............................................................................................................................11
Question 4.............................................................................................................................13
Question 5.............................................................................................................................14
TASK
Question 1
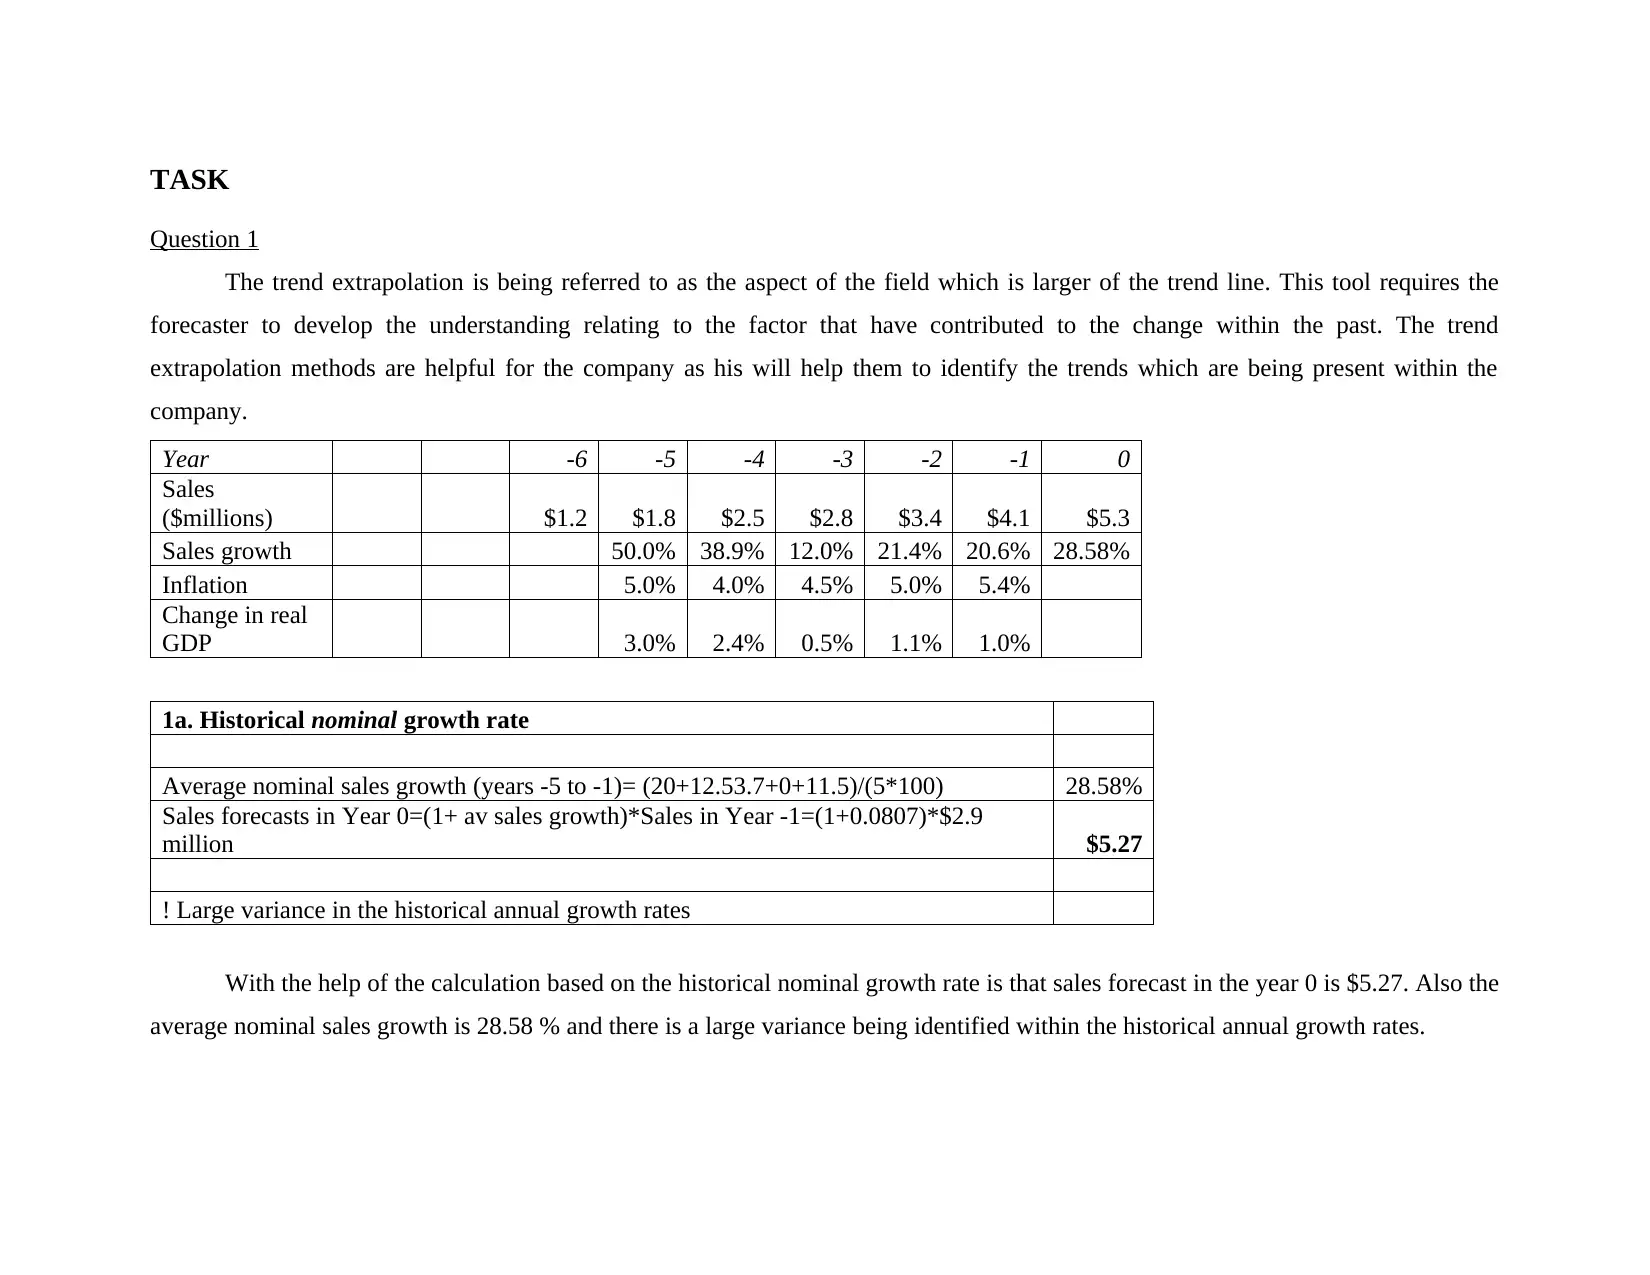
The trend extrapolation is being referred to as the aspect of the field which is larger of the trend line. This tool requires the
forecaster to develop the understanding relating to the factor that have contributed to the change within the past. The trend
extrapolation methods are helpful for the company as his will help them to identify the trends which are being present within the
company.
Year -6 -5 -4 -3 -2 -1 0
Sales
($millions) $1.2 $1.8 $2.5 $2.8 $3.4 $4.1 $5.3
Sales growth 50.0% 38.9% 12.0% 21.4% 20.6% 28.58%
Inflation 5.0% 4.0% 4.5% 5.0% 5.4%
Change in real
GDP 3.0% 2.4% 0.5% 1.1% 1.0%
1a. Historical nominal growth rate
Average nominal sales growth (years -5 to -1)= (20+12.53.7+0+11.5)/(5*100) 28.58%
Sales forecasts in Year 0=(1+ av sales growth)*Sales in Year -1=(1+0.0807)*$2.9
million $5.27
! Large variance in the historical annual growth rates
With the help of the calculation based on the historical nominal growth rate is that sales forecast in the year 0 is $5.27. Also the
average nominal sales growth is 28.58 % and there is a large variance being identified within the historical annual growth rates.
Question 1
The trend extrapolation is being referred to as the aspect of the field which is larger of the trend line. This tool requires the
forecaster to develop the understanding relating to the factor that have contributed to the change within the past. The trend
extrapolation methods are helpful for the company as his will help them to identify the trends which are being present within the
company.
Year -6 -5 -4 -3 -2 -1 0
Sales
($millions) $1.2 $1.8 $2.5 $2.8 $3.4 $4.1 $5.3
Sales growth 50.0% 38.9% 12.0% 21.4% 20.6% 28.58%
Inflation 5.0% 4.0% 4.5% 5.0% 5.4%
Change in real
GDP 3.0% 2.4% 0.5% 1.1% 1.0%
1a. Historical nominal growth rate
Average nominal sales growth (years -5 to -1)= (20+12.53.7+0+11.5)/(5*100) 28.58%
Sales forecasts in Year 0=(1+ av sales growth)*Sales in Year -1=(1+0.0807)*$2.9
million $5.27
! Large variance in the historical annual growth rates
With the help of the calculation based on the historical nominal growth rate is that sales forecast in the year 0 is $5.27. Also the
average nominal sales growth is 28.58 % and there is a large variance being identified within the historical annual growth rates.
⊘ This is a preview!⊘
Do you want full access?
Subscribe today to unlock all pages.
Trusted by 1+ million students worldwide
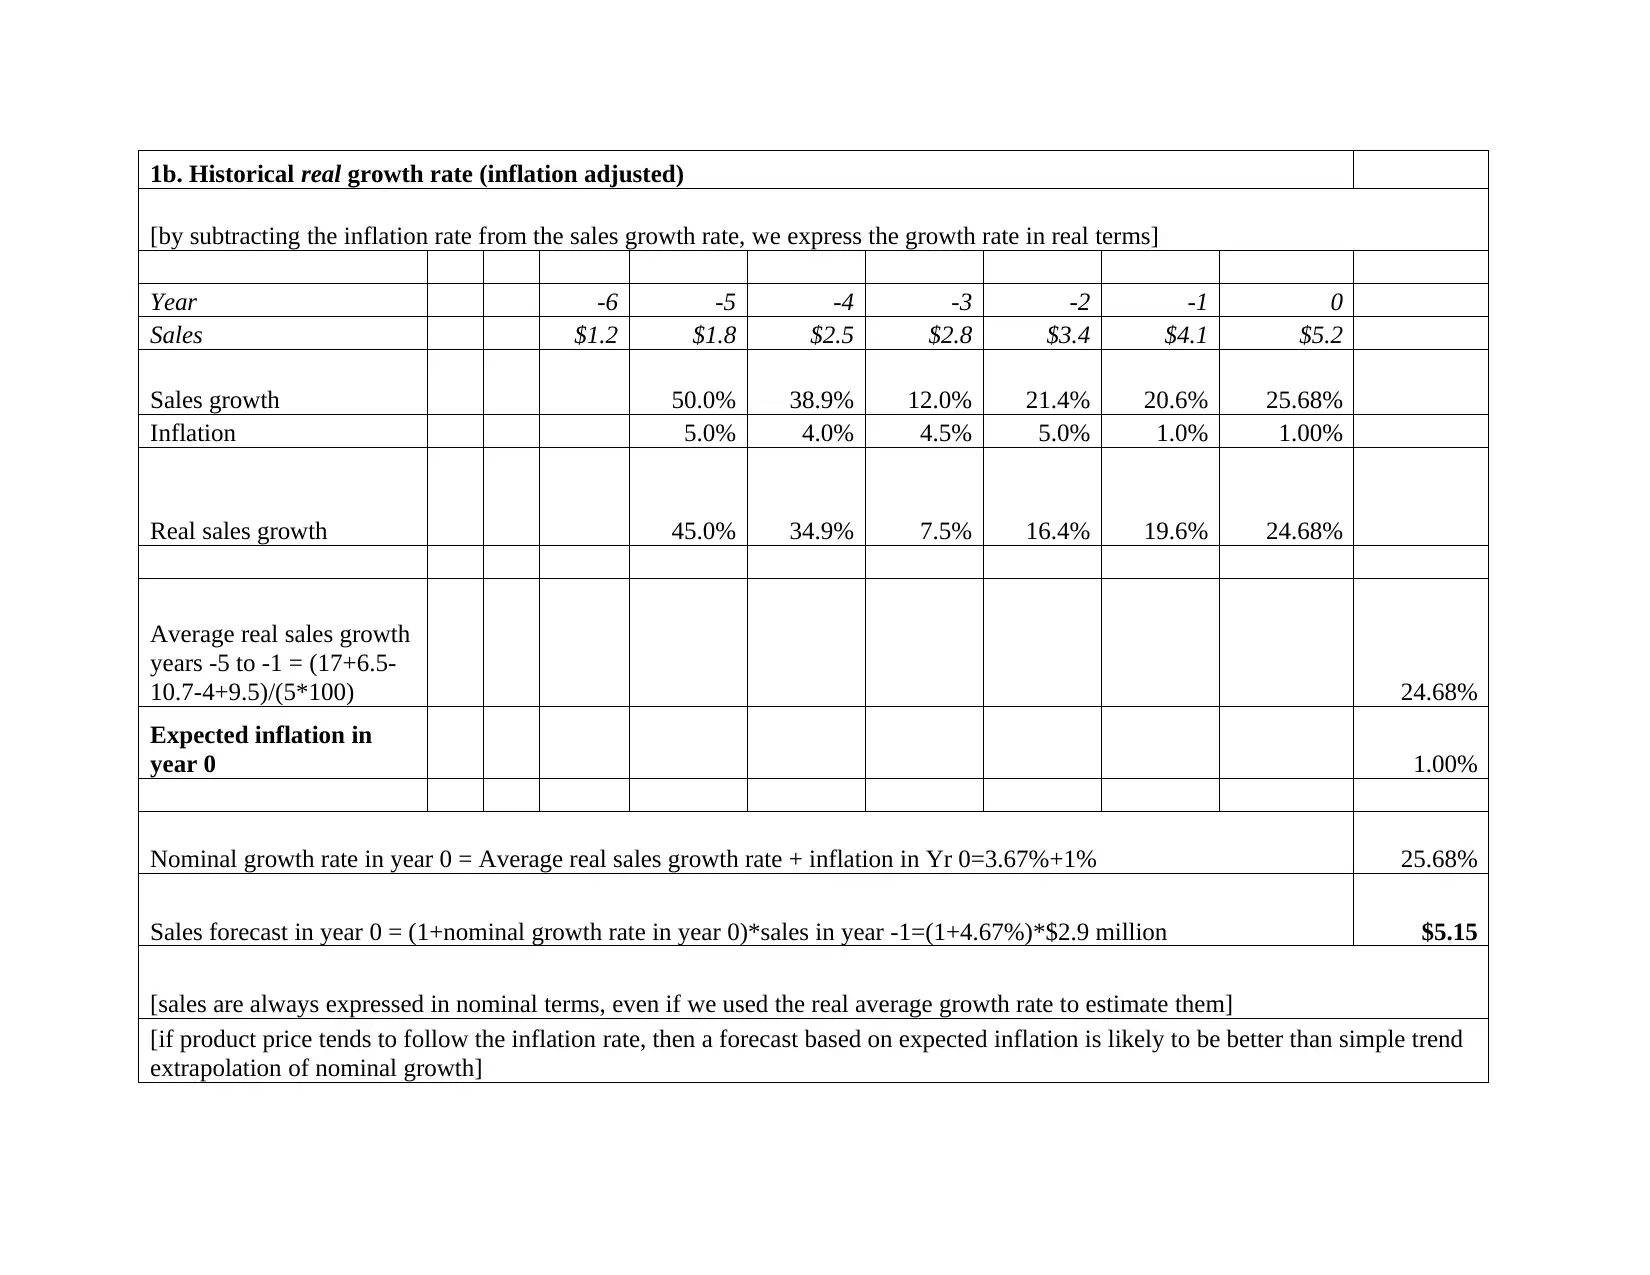
1b. Historical real growth rate (inflation adjusted)
[by subtracting the inflation rate from the sales growth rate, we express the growth rate in real terms]
Year -6 -5 -4 -3 -2 -1 0
Sales $1.2 $1.8 $2.5 $2.8 $3.4 $4.1 $5.2
Sales growth 50.0% 38.9% 12.0% 21.4% 20.6% 25.68%
Inflation 5.0% 4.0% 4.5% 5.0% 1.0% 1.00%
Real sales growth 45.0% 34.9% 7.5% 16.4% 19.6% 24.68%
Average real sales growth
years -5 to -1 = (17+6.5-
10.7-4+9.5)/(5*100) 24.68%
Expected inflation in
year 0 1.00%
Nominal growth rate in year 0 = Average real sales growth rate + inflation in Yr 0=3.67%+1% 25.68%
Sales forecast in year 0 = (1+nominal growth rate in year 0)*sales in year -1=(1+4.67%)*$2.9 million $5.15
[sales are always expressed in nominal terms, even if we used the real average growth rate to estimate them]
[if product price tends to follow the inflation rate, then a forecast based on expected inflation is likely to be better than simple trend
extrapolation of nominal growth]
Paraphrase This Document
Need a fresh take? Get an instant paraphrase of this document with our AI Paraphraser
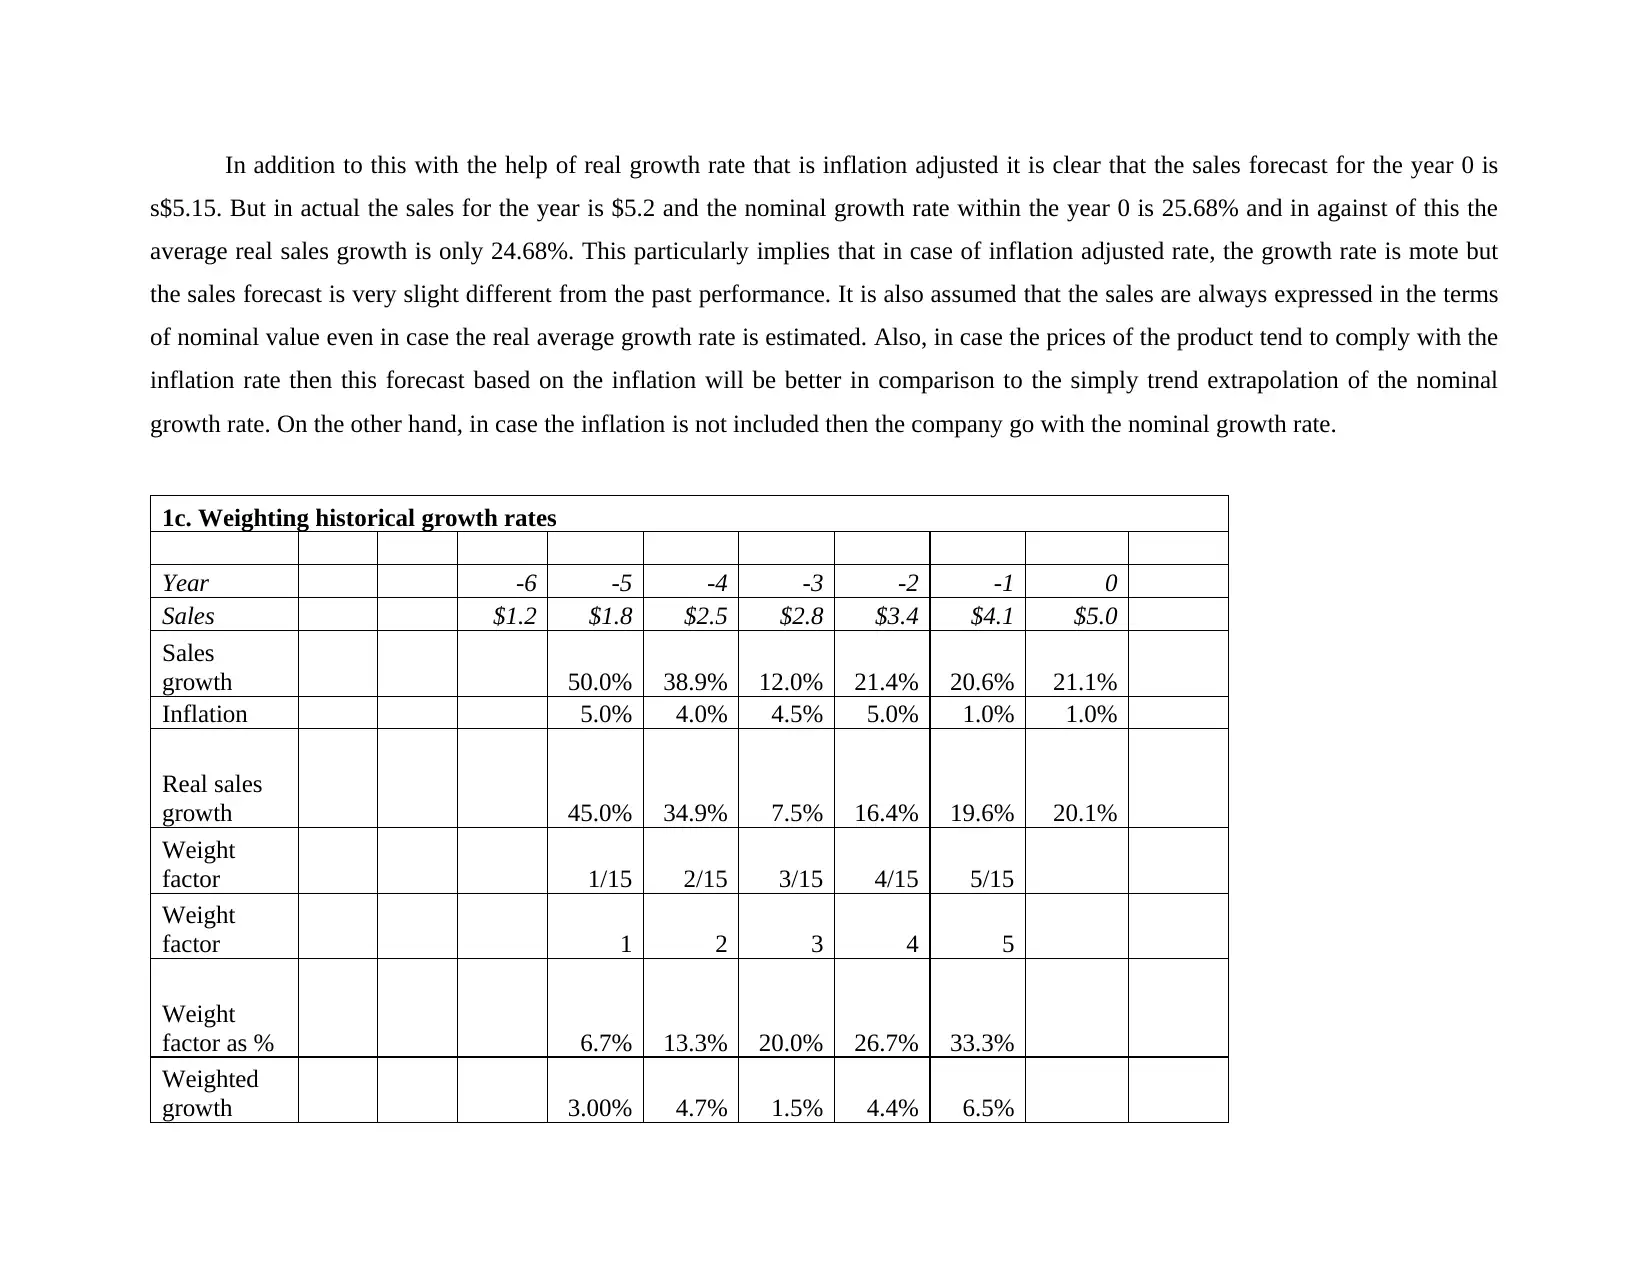
In addition to this with the help of real growth rate that is inflation adjusted it is clear that the sales forecast for the year 0 is
s$5.15. But in actual the sales for the year is $5.2 and the nominal growth rate within the year 0 is 25.68% and in against of this the
average real sales growth is only 24.68%. This particularly implies that in case of inflation adjusted rate, the growth rate is mote but
the sales forecast is very slight different from the past performance. It is also assumed that the sales are always expressed in the terms
of nominal value even in case the real average growth rate is estimated. Also, in case the prices of the product tend to comply with the
inflation rate then this forecast based on the inflation will be better in comparison to the simply trend extrapolation of the nominal
growth rate. On the other hand, in case the inflation is not included then the company go with the nominal growth rate.
1c. Weighting historical growth rates
Year -6 -5 -4 -3 -2 -1 0
Sales $1.2 $1.8 $2.5 $2.8 $3.4 $4.1 $5.0
Sales
growth 50.0% 38.9% 12.0% 21.4% 20.6% 21.1%
Inflation 5.0% 4.0% 4.5% 5.0% 1.0% 1.0%
Real sales
growth 45.0% 34.9% 7.5% 16.4% 19.6% 20.1%
Weight
factor 1/15 2/15 3/15 4/15 5/15
Weight
factor 1 2 3 4 5
Weight
factor as % 6.7% 13.3% 20.0% 26.7% 33.3%
Weighted
growth 3.00% 4.7% 1.5% 4.4% 6.5%
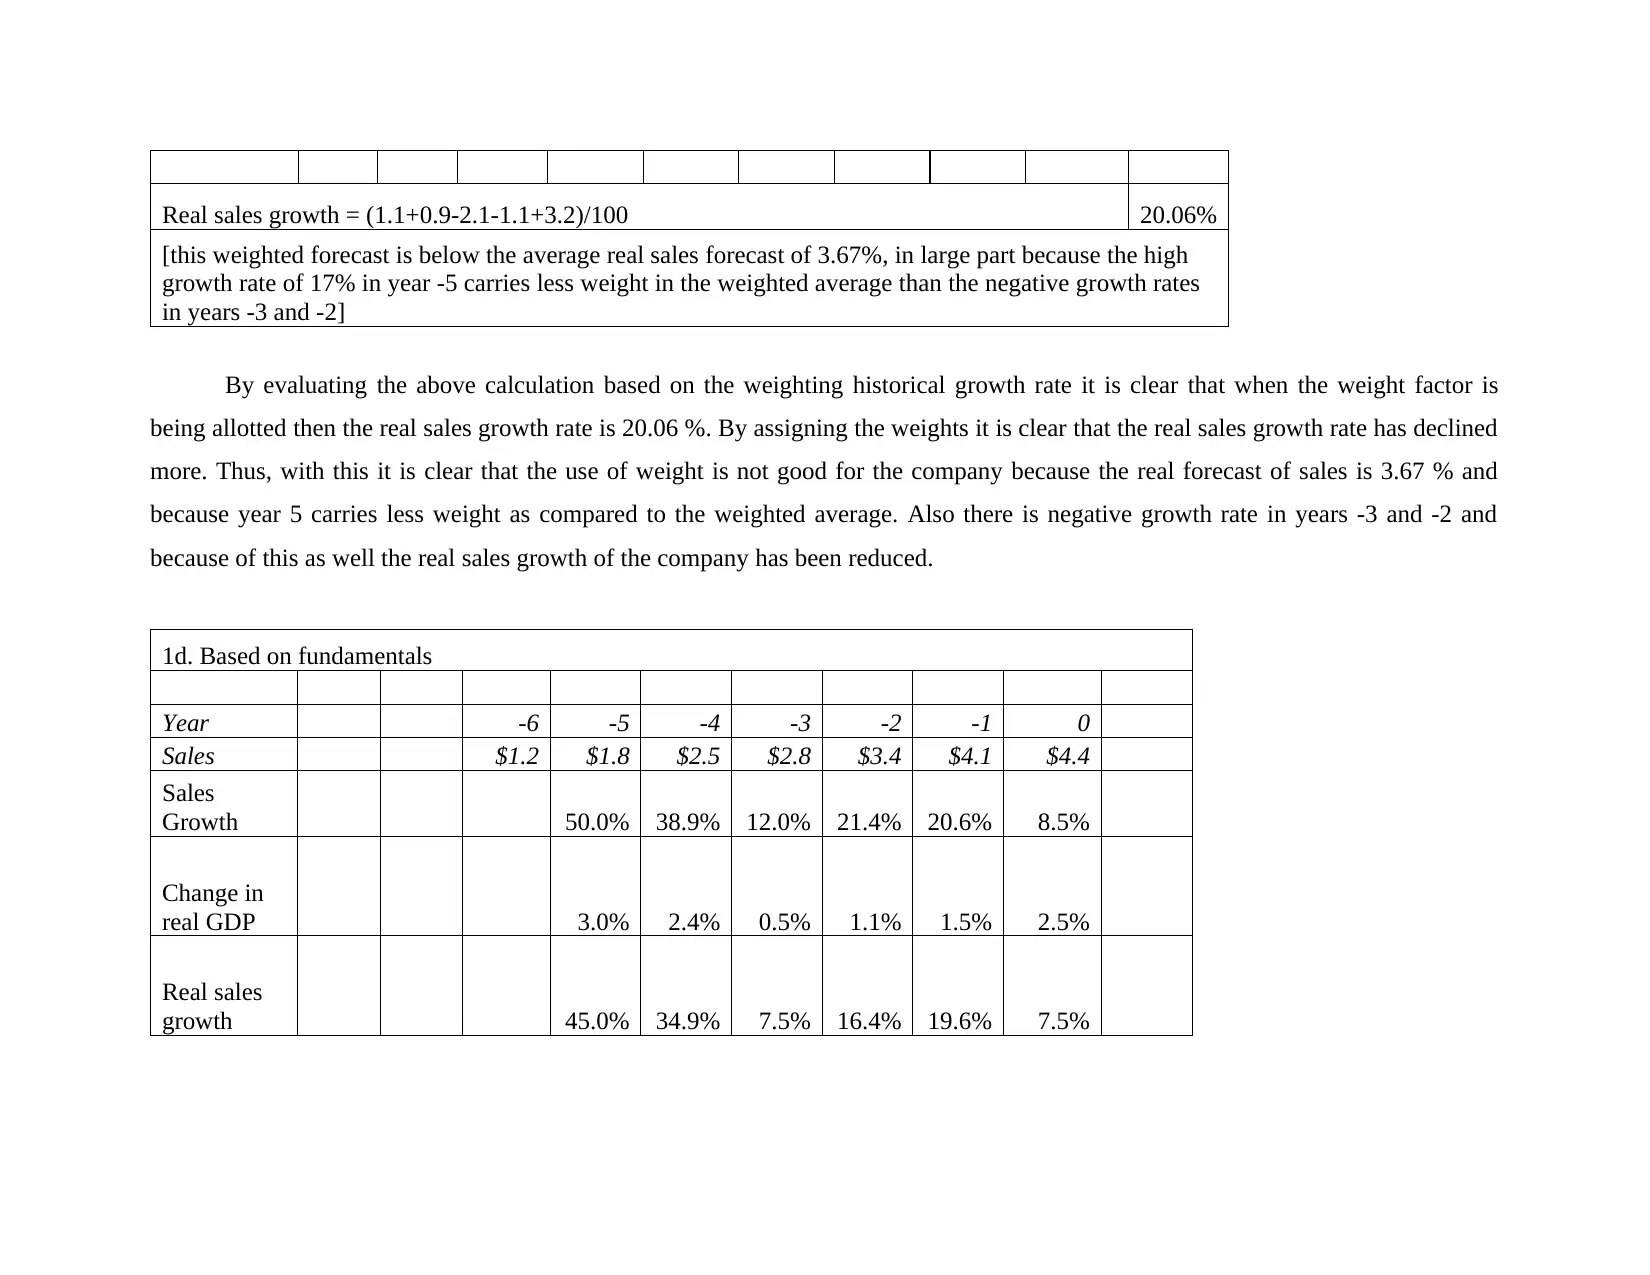
Real sales growth = (1.1+0.9-2.1-1.1+3.2)/100 20.06%
[this weighted forecast is below the average real sales forecast of 3.67%, in large part because the high
growth rate of 17% in year -5 carries less weight in the weighted average than the negative growth rates
in years -3 and -2]
By evaluating the above calculation based on the weighting historical growth rate it is clear that when the weight factor is
being allotted then the real sales growth rate is 20.06 %. By assigning the weights it is clear that the real sales growth rate has declined
more. Thus, with this it is clear that the use of weight is not good for the company because the real forecast of sales is 3.67 % and
because year 5 carries less weight as compared to the weighted average. Also there is negative growth rate in years -3 and -2 and
because of this as well the real sales growth of the company has been reduced.
1d. Based on fundamentals
Year -6 -5 -4 -3 -2 -1 0
Sales $1.2 $1.8 $2.5 $2.8 $3.4 $4.1 $4.4
Sales
Growth 50.0% 38.9% 12.0% 21.4% 20.6% 8.5%
Change in
real GDP 3.0% 2.4% 0.5% 1.1% 1.5% 2.5%
Real sales
growth 45.0% 34.9% 7.5% 16.4% 19.6% 7.5%
⊘ This is a preview!⊘
Do you want full access?
Subscribe today to unlock all pages.
Trusted by 1+ million students worldwide
Real sales
growth/
Change in
GDP 15x 15x 15x 15x 13x
Expected
sales
growth (x5) 15.0% 12.0% 2.5% 5.5% 7.5%
Difference 30.0% 22.9% 5.0% 10.9% 12.1%
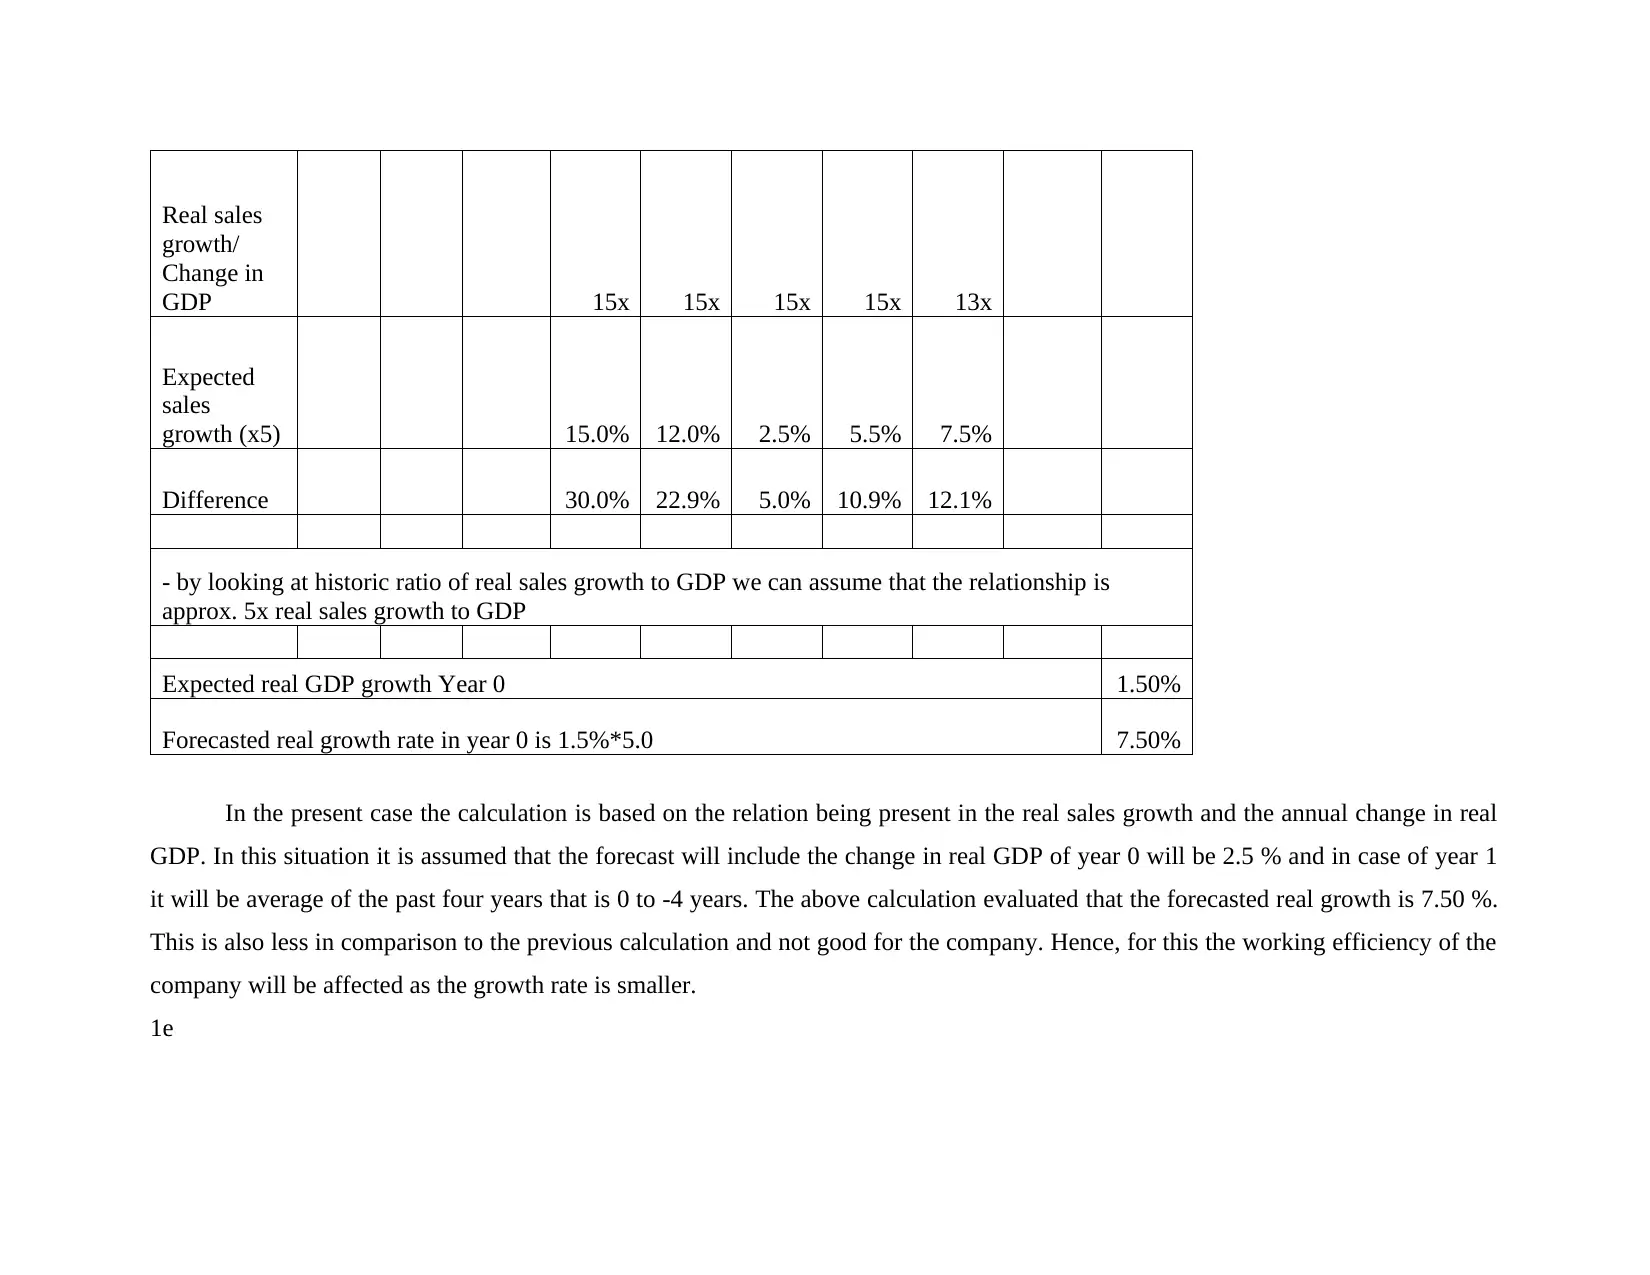
- by looking at historic ratio of real sales growth to GDP we can assume that the relationship is
approx. 5x real sales growth to GDP
Expected real GDP growth Year 0 1.50%
Forecasted real growth rate in year 0 is 1.5%*5.0 7.50%
In the present case the calculation is based on the relation being present in the real sales growth and the annual change in real
GDP. In this situation it is assumed that the forecast will include the change in real GDP of year 0 will be 2.5 % and in case of year 1
it will be average of the past four years that is 0 to -4 years. The above calculation evaluated that the forecasted real growth is 7.50 %.
This is also less in comparison to the previous calculation and not good for the company. Hence, for this the working efficiency of the
company will be affected as the growth rate is smaller.
1e
growth/
Change in
GDP 15x 15x 15x 15x 13x
Expected
sales
growth (x5) 15.0% 12.0% 2.5% 5.5% 7.5%
Difference 30.0% 22.9% 5.0% 10.9% 12.1%
- by looking at historic ratio of real sales growth to GDP we can assume that the relationship is
approx. 5x real sales growth to GDP
Expected real GDP growth Year 0 1.50%
Forecasted real growth rate in year 0 is 1.5%*5.0 7.50%
In the present case the calculation is based on the relation being present in the real sales growth and the annual change in real
GDP. In this situation it is assumed that the forecast will include the change in real GDP of year 0 will be 2.5 % and in case of year 1
it will be average of the past four years that is 0 to -4 years. The above calculation evaluated that the forecasted real growth is 7.50 %.
This is also less in comparison to the previous calculation and not good for the company. Hence, for this the working efficiency of the
company will be affected as the growth rate is smaller.
1e
Paraphrase This Document
Need a fresh take? Get an instant paraphrase of this document with our AI Paraphraser
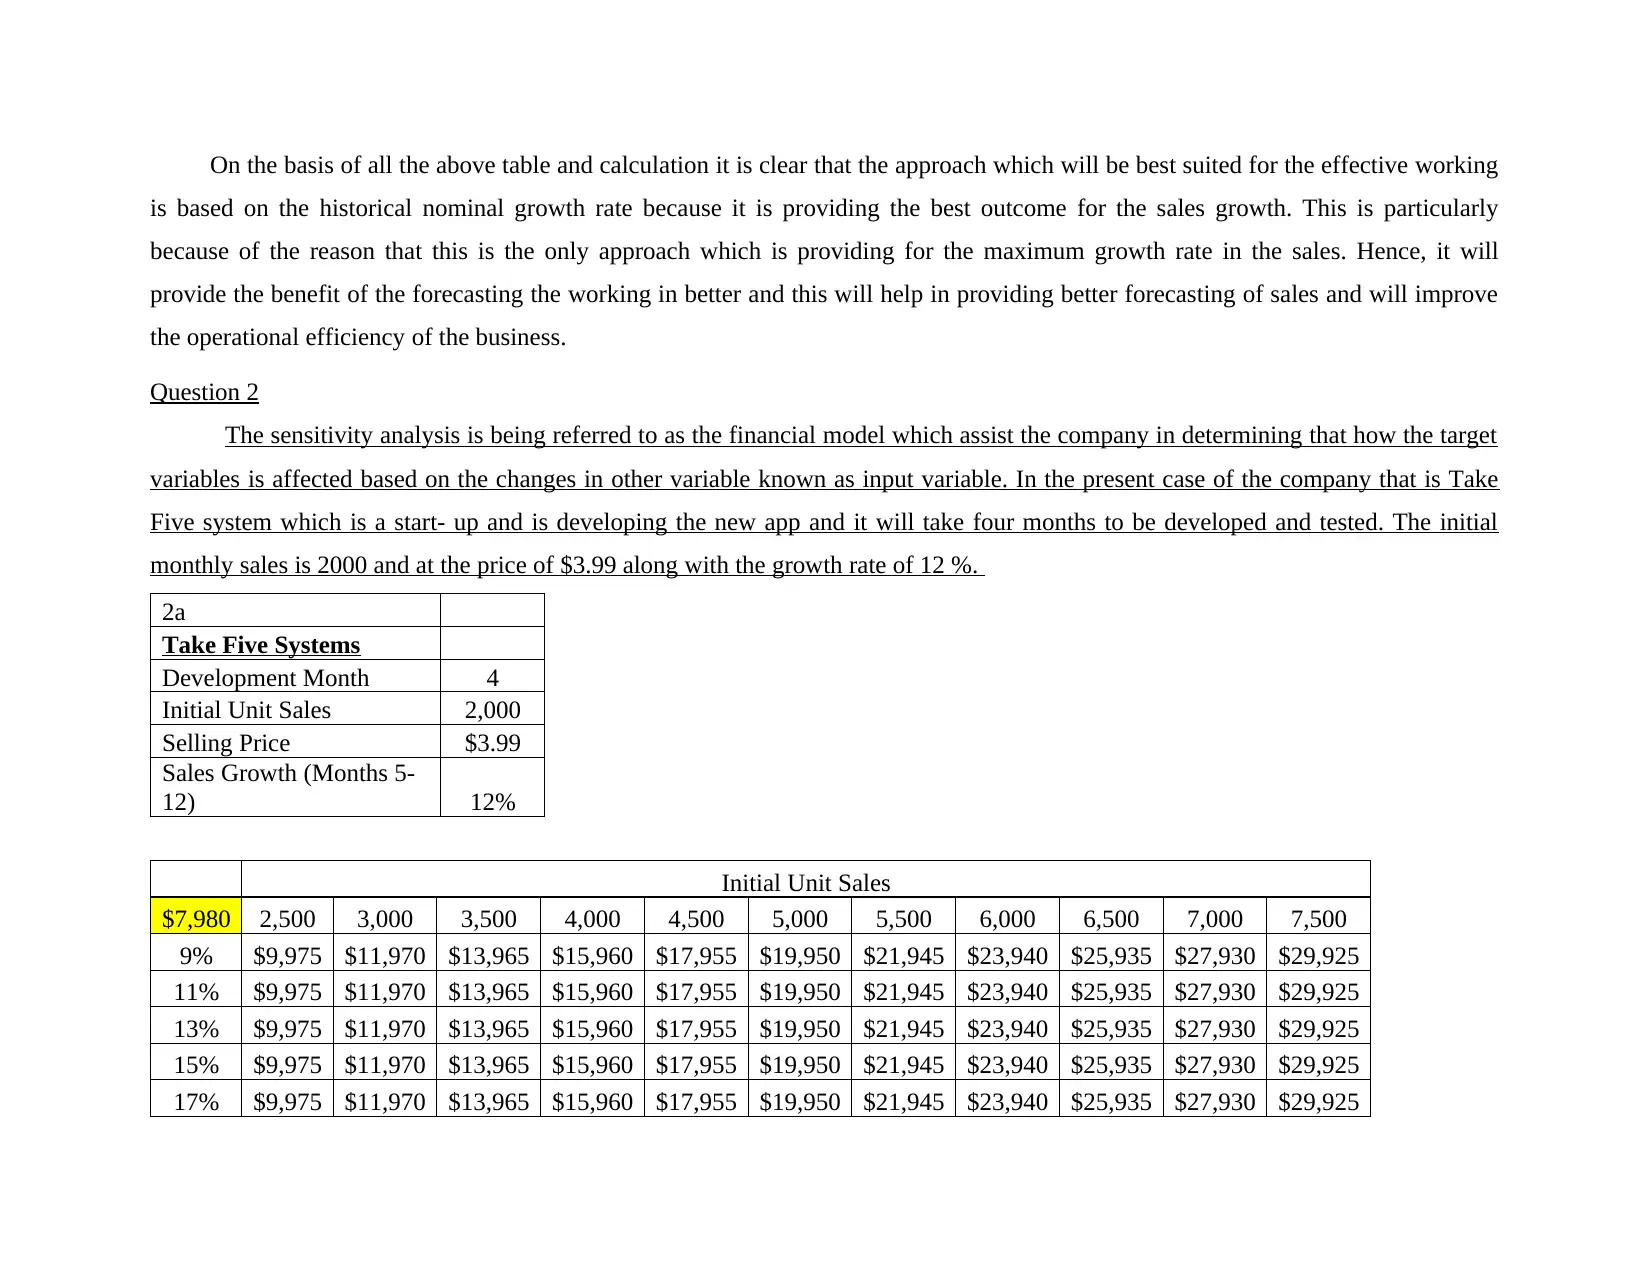
On the basis of all the above table and calculation it is clear that the approach which will be best suited for the effective working
is based on the historical nominal growth rate because it is providing the best outcome for the sales growth. This is particularly
because of the reason that this is the only approach which is providing for the maximum growth rate in the sales. Hence, it will
provide the benefit of the forecasting the working in better and this will help in providing better forecasting of sales and will improve
the operational efficiency of the business.
Question 2
The sensitivity analysis is being referred to as the financial model which assist the company in determining that how the target
variables is affected based on the changes in other variable known as input variable. In the present case of the company that is Take
Five system which is a start- up and is developing the new app and it will take four months to be developed and tested. The initial
monthly sales is 2000 and at the price of $3.99 along with the growth rate of 12 %.
2a
Take Five Systems
Development Month 4
Initial Unit Sales 2,000
Selling Price $3.99
Sales Growth (Months 5-
12) 12%
Initial Unit Sales
$7,980 2,500 3,000 3,500 4,000 4,500 5,000 5,500 6,000 6,500 7,000 7,500
9% $9,975 $11,970 $13,965 $15,960 $17,955 $19,950 $21,945 $23,940 $25,935 $27,930 $29,925
11% $9,975 $11,970 $13,965 $15,960 $17,955 $19,950 $21,945 $23,940 $25,935 $27,930 $29,925
13% $9,975 $11,970 $13,965 $15,960 $17,955 $19,950 $21,945 $23,940 $25,935 $27,930 $29,925
15% $9,975 $11,970 $13,965 $15,960 $17,955 $19,950 $21,945 $23,940 $25,935 $27,930 $29,925
17% $9,975 $11,970 $13,965 $15,960 $17,955 $19,950 $21,945 $23,940 $25,935 $27,930 $29,925
19% $9,975 $11,970 $13,965 $15,960 $17,955 $19,950 $21,945 $23,940 $25,935 $27,930 $29,925
21% $9,975 $11,970 $13,965 $15,960 $17,955 $19,950 $21,945 $23,940 $25,935 $27,930 $29,925
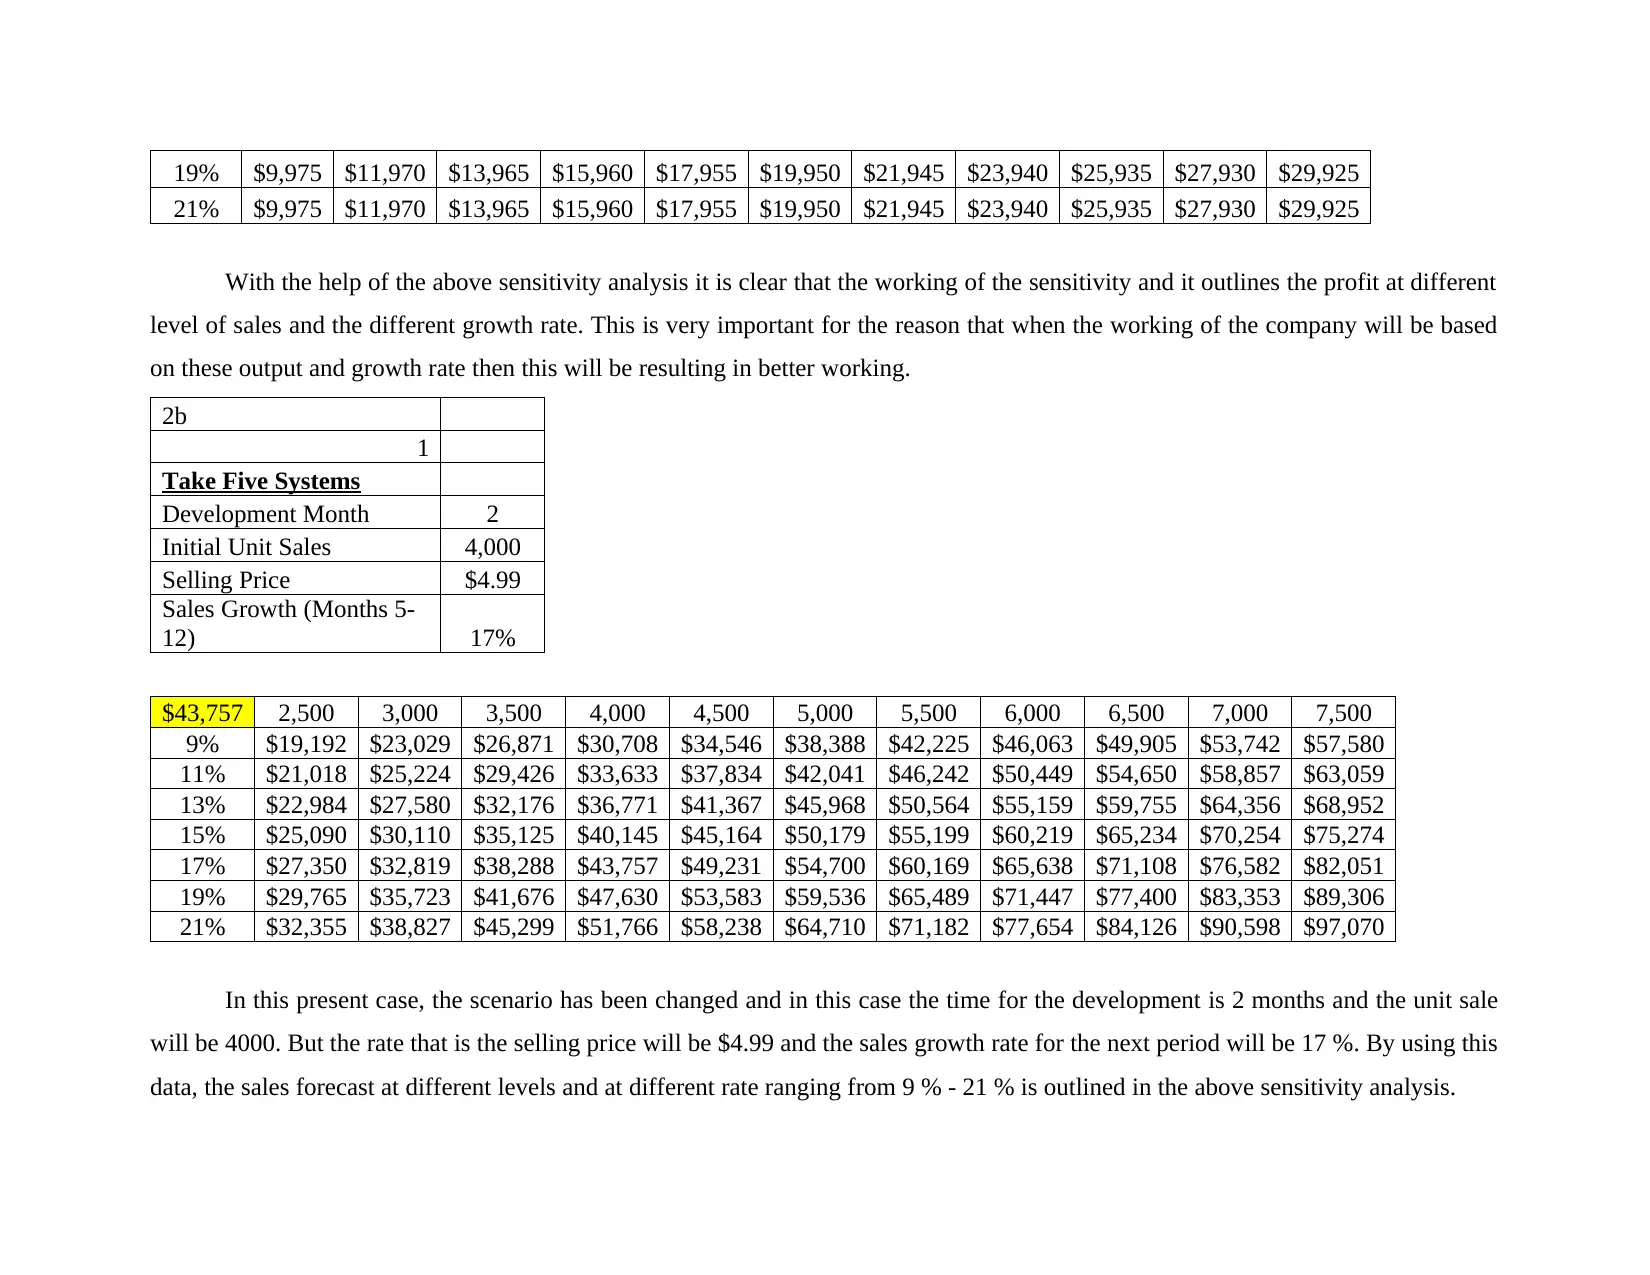
With the help of the above sensitivity analysis it is clear that the working of the sensitivity and it outlines the profit at different
level of sales and the different growth rate. This is very important for the reason that when the working of the company will be based
on these output and growth rate then this will be resulting in better working.
2b
1
Take Five Systems
Development Month 2
Initial Unit Sales 4,000
Selling Price $4.99
Sales Growth (Months 5-
12) 17%
$43,757 2,500 3,000 3,500 4,000 4,500 5,000 5,500 6,000 6,500 7,000 7,500
9% $19,192 $23,029 $26,871 $30,708 $34,546 $38,388 $42,225 $46,063 $49,905 $53,742 $57,580
11% $21,018 $25,224 $29,426 $33,633 $37,834 $42,041 $46,242 $50,449 $54,650 $58,857 $63,059
13% $22,984 $27,580 $32,176 $36,771 $41,367 $45,968 $50,564 $55,159 $59,755 $64,356 $68,952
15% $25,090 $30,110 $35,125 $40,145 $45,164 $50,179 $55,199 $60,219 $65,234 $70,254 $75,274
17% $27,350 $32,819 $38,288 $43,757 $49,231 $54,700 $60,169 $65,638 $71,108 $76,582 $82,051
19% $29,765 $35,723 $41,676 $47,630 $53,583 $59,536 $65,489 $71,447 $77,400 $83,353 $89,306
21% $32,355 $38,827 $45,299 $51,766 $58,238 $64,710 $71,182 $77,654 $84,126 $90,598 $97,070
In this present case, the scenario has been changed and in this case the time for the development is 2 months and the unit sale
will be 4000. But the rate that is the selling price will be $4.99 and the sales growth rate for the next period will be 17 %. By using this
data, the sales forecast at different levels and at different rate ranging from 9 % - 21 % is outlined in the above sensitivity analysis.
21% $9,975 $11,970 $13,965 $15,960 $17,955 $19,950 $21,945 $23,940 $25,935 $27,930 $29,925
With the help of the above sensitivity analysis it is clear that the working of the sensitivity and it outlines the profit at different
level of sales and the different growth rate. This is very important for the reason that when the working of the company will be based
on these output and growth rate then this will be resulting in better working.
2b
1
Take Five Systems
Development Month 2
Initial Unit Sales 4,000
Selling Price $4.99
Sales Growth (Months 5-
12) 17%
$43,757 2,500 3,000 3,500 4,000 4,500 5,000 5,500 6,000 6,500 7,000 7,500
9% $19,192 $23,029 $26,871 $30,708 $34,546 $38,388 $42,225 $46,063 $49,905 $53,742 $57,580
11% $21,018 $25,224 $29,426 $33,633 $37,834 $42,041 $46,242 $50,449 $54,650 $58,857 $63,059
13% $22,984 $27,580 $32,176 $36,771 $41,367 $45,968 $50,564 $55,159 $59,755 $64,356 $68,952
15% $25,090 $30,110 $35,125 $40,145 $45,164 $50,179 $55,199 $60,219 $65,234 $70,254 $75,274
17% $27,350 $32,819 $38,288 $43,757 $49,231 $54,700 $60,169 $65,638 $71,108 $76,582 $82,051
19% $29,765 $35,723 $41,676 $47,630 $53,583 $59,536 $65,489 $71,447 $77,400 $83,353 $89,306
21% $32,355 $38,827 $45,299 $51,766 $58,238 $64,710 $71,182 $77,654 $84,126 $90,598 $97,070
In this present case, the scenario has been changed and in this case the time for the development is 2 months and the unit sale
will be 4000. But the rate that is the selling price will be $4.99 and the sales growth rate for the next period will be 17 %. By using this
data, the sales forecast at different levels and at different rate ranging from 9 % - 21 % is outlined in the above sensitivity analysis.
⊘ This is a preview!⊘
Do you want full access?
Subscribe today to unlock all pages.
Trusted by 1+ million students worldwide
2
Take Five Systems
Development Month 7
Initial Unit Sales 1,000
Selling Price $1.99
Sales Growth (Months 5-
12) 10%
$3,876.52 2,500 3,000 3,500 4,000 4,500 5,000 5,500 6,000 6,500 7,000 7,500
9% 9094.3 10913 12732 14551 16370 18189 20007 21826 23645 25464 27282.9
11% 10328 12394 14459 16525 18591 20656 22722 24787 26855 28921 30986.29
13% 11703 14043 16386 18726 21066 23408 25749 28089 30429 32771 35111.56
15% 13234 15880 18527 21174 23820 26467 29114 31760 34407 37054 39700.5
17% 14931 17916 20903 23888 26875 29862 32847 35834 38821 41806 44792.91
19% 16812 20173 23536 26899 30260 33623 36986 40347 43710 47073 50434.56
21% 18891 22670 26449 30226 34005 37784 41563 45340 49119 52898 56677.19
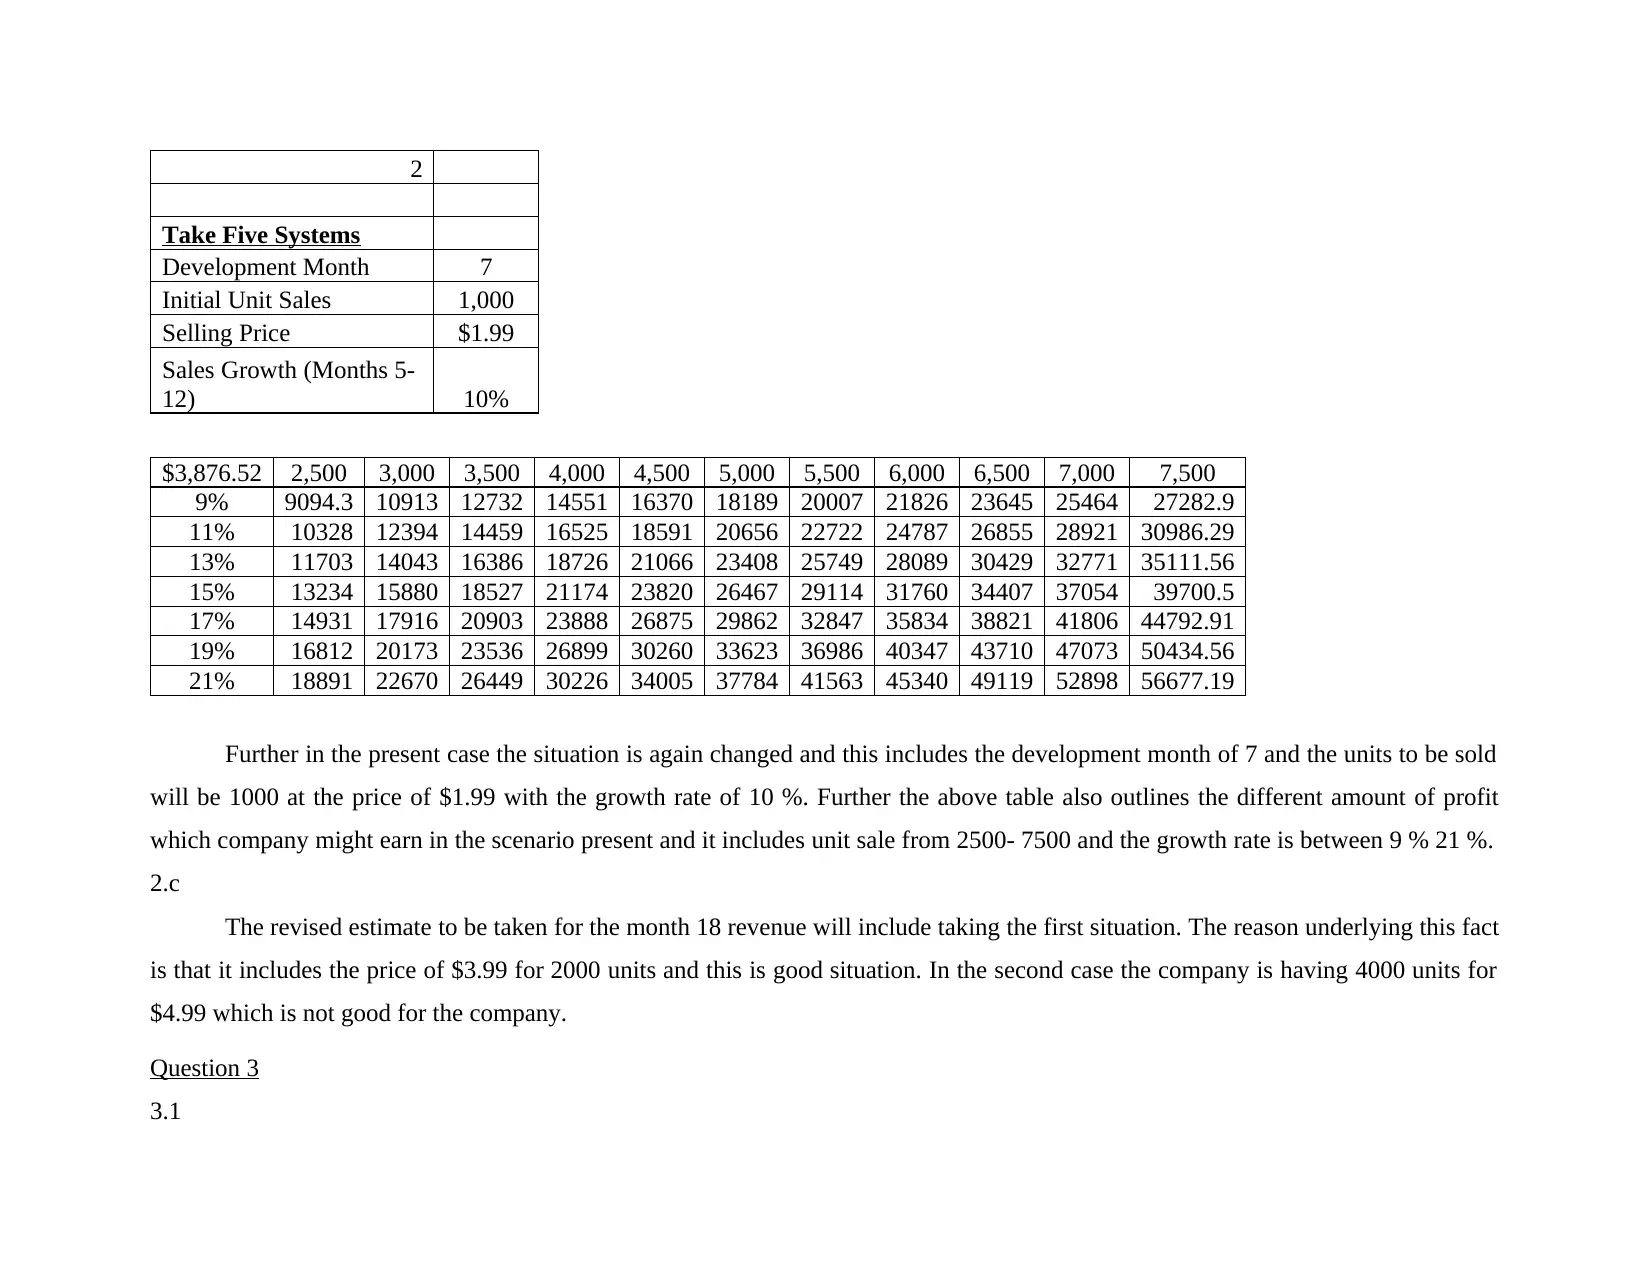
Further in the present case the situation is again changed and this includes the development month of 7 and the units to be sold
will be 1000 at the price of $1.99 with the growth rate of 10 %. Further the above table also outlines the different amount of profit
which company might earn in the scenario present and it includes unit sale from 2500- 7500 and the growth rate is between 9 % 21 %.
2.c
The revised estimate to be taken for the month 18 revenue will include taking the first situation. The reason underlying this fact
is that it includes the price of $3.99 for 2000 units and this is good situation. In the second case the company is having 4000 units for
$4.99 which is not good for the company.
Question 3
3.1
Take Five Systems
Development Month 7
Initial Unit Sales 1,000
Selling Price $1.99
Sales Growth (Months 5-
12) 10%
$3,876.52 2,500 3,000 3,500 4,000 4,500 5,000 5,500 6,000 6,500 7,000 7,500
9% 9094.3 10913 12732 14551 16370 18189 20007 21826 23645 25464 27282.9
11% 10328 12394 14459 16525 18591 20656 22722 24787 26855 28921 30986.29
13% 11703 14043 16386 18726 21066 23408 25749 28089 30429 32771 35111.56
15% 13234 15880 18527 21174 23820 26467 29114 31760 34407 37054 39700.5
17% 14931 17916 20903 23888 26875 29862 32847 35834 38821 41806 44792.91
19% 16812 20173 23536 26899 30260 33623 36986 40347 43710 47073 50434.56
21% 18891 22670 26449 30226 34005 37784 41563 45340 49119 52898 56677.19
Further in the present case the situation is again changed and this includes the development month of 7 and the units to be sold
will be 1000 at the price of $1.99 with the growth rate of 10 %. Further the above table also outlines the different amount of profit
which company might earn in the scenario present and it includes unit sale from 2500- 7500 and the growth rate is between 9 % 21 %.
2.c
The revised estimate to be taken for the month 18 revenue will include taking the first situation. The reason underlying this fact
is that it includes the price of $3.99 for 2000 units and this is good situation. In the second case the company is having 4000 units for
$4.99 which is not good for the company.
Question 3
3.1
Paraphrase This Document
Need a fresh take? Get an instant paraphrase of this document with our AI Paraphraser
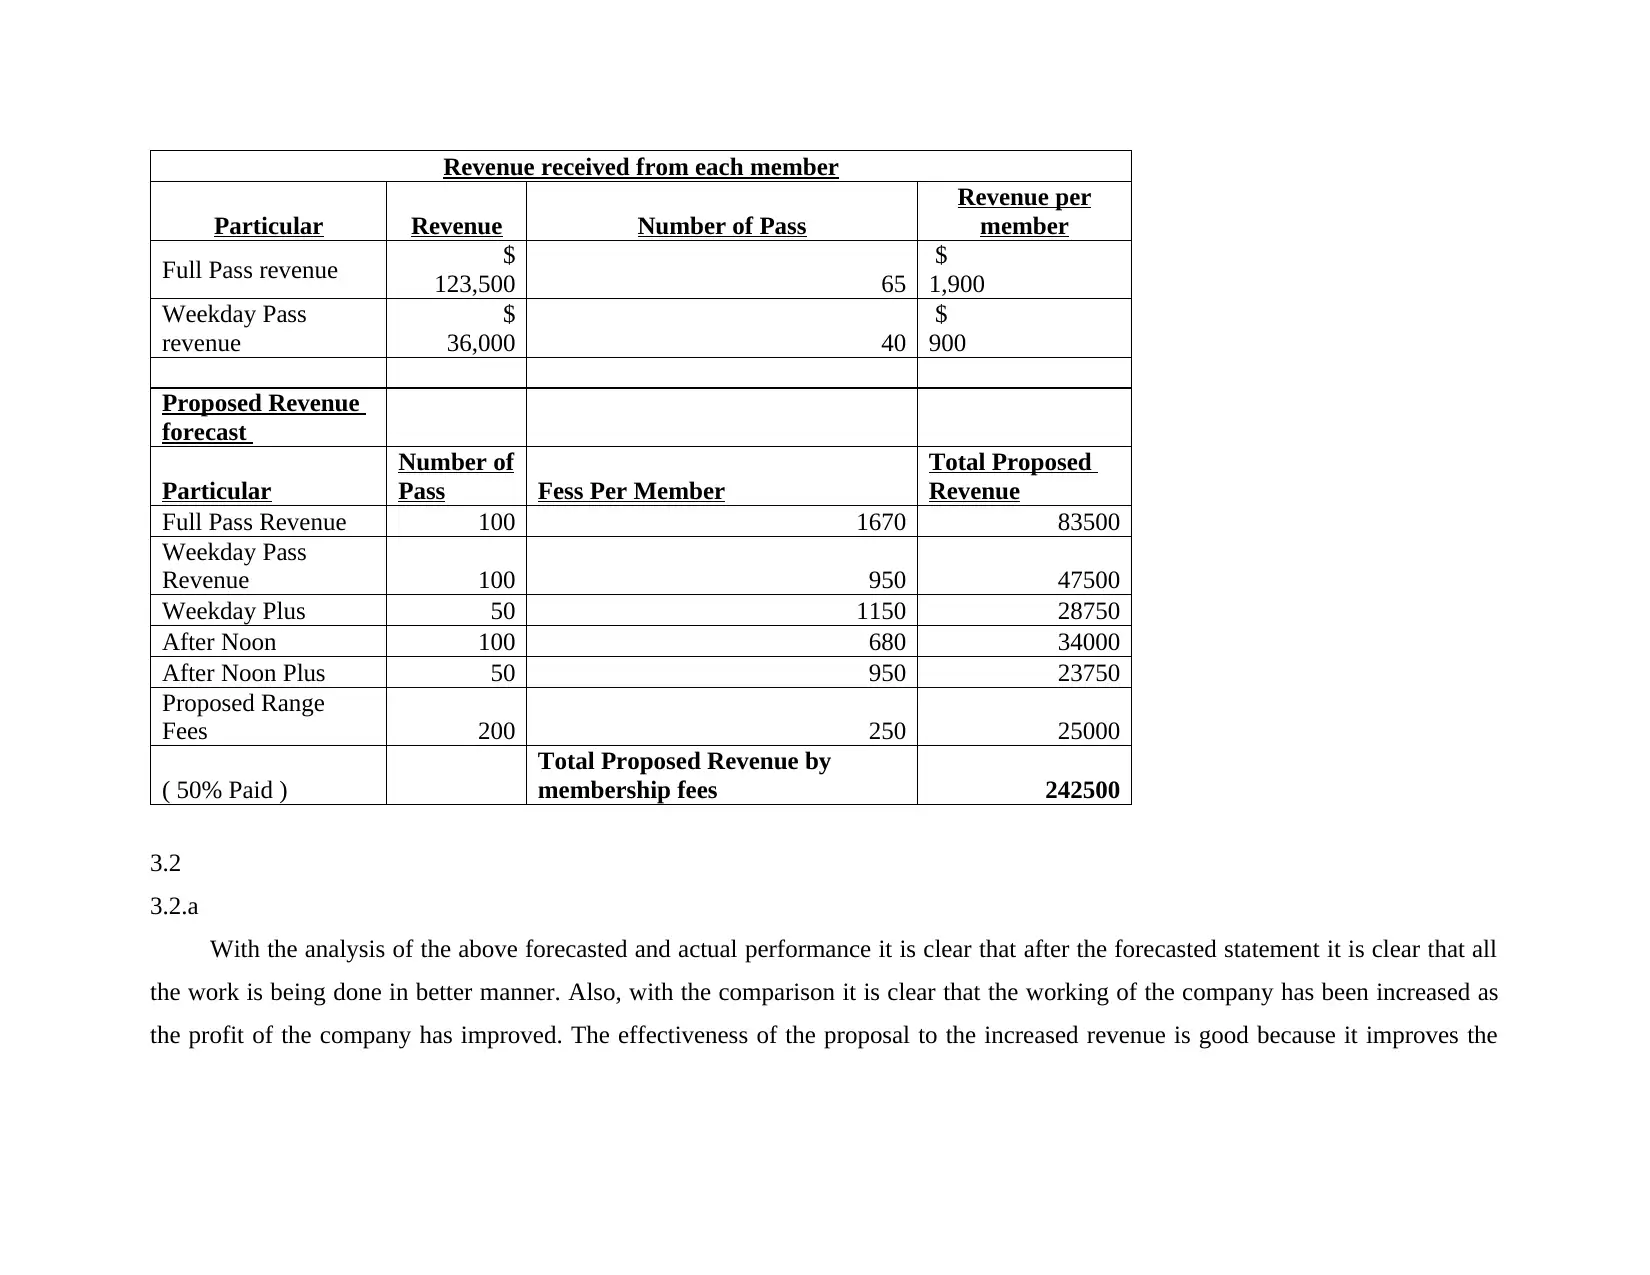
Revenue received from each member
Particular Revenue Number of Pass
Revenue per
member
Full Pass revenue $
123,500 65
$
1,900
Weekday Pass
revenue
$
36,000 40
$
900
Proposed Revenue
forecast
Particular
Number of
Pass Fess Per Member
Total Proposed
Revenue
Full Pass Revenue 100 1670 83500
Weekday Pass
Revenue 100 950 47500
Weekday Plus 50 1150 28750
After Noon 100 680 34000
After Noon Plus 50 950 23750
Proposed Range
Fees 200 250 25000
( 50% Paid )
Total Proposed Revenue by
membership fees 242500
3.2
3.2.a
With the analysis of the above forecasted and actual performance it is clear that after the forecasted statement it is clear that all
the work is being done in better manner. Also, with the comparison it is clear that the working of the company has been increased as
the profit of the company has improved. The effectiveness of the proposal to the increased revenue is good because it improves the
working efficiency of the company. All the assumption of the company was also correct and appropriate because on the basis of this
only the new proposed revenue was calculated and as a result of this the profitability increased to a great extent.
3.2.b
Based on the above both calculation it is necessary that some of the recommendation is being provided to the company. these
recommendation involves the following-
It is recommended to the company that they must also provide membership to the Weekday plus, afternoon and afternoon plus
category as well. this is particularly because of the reason that it is not having current actual membership.
Along with this it is also recommended to company that they must provide some discount on taking the membership. The
reason underlying this fact is that when the company will be providing different discount then this will be attracting more of
the people and as a result of this sales will increase and ultimately the profits.
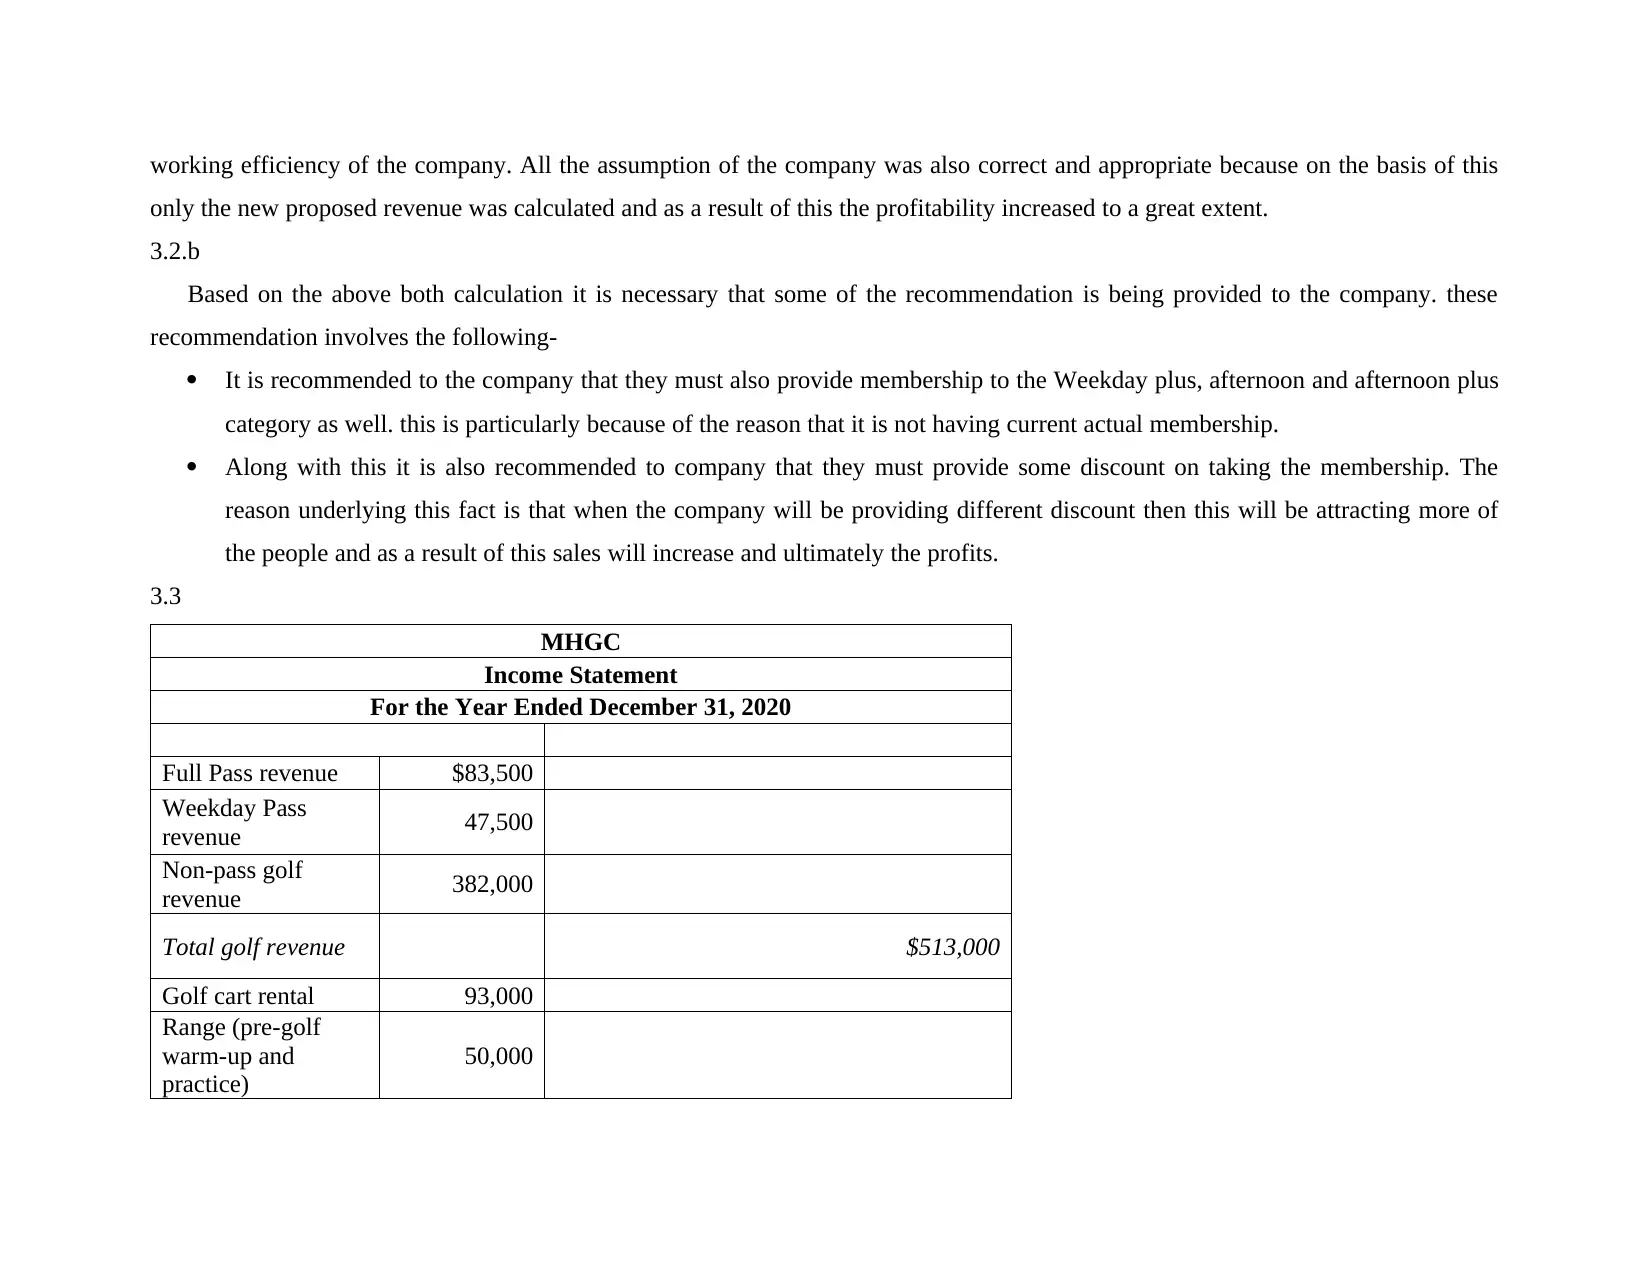
3.3
MHGC
Income Statement
For the Year Ended December 31, 2020
Full Pass revenue $83,500
Weekday Pass
revenue 47,500
Non-pass golf
revenue 382,000
Total golf revenue $513,000
Golf cart rental 93,000
Range (pre-golf
warm-up and
practice)
50,000
only the new proposed revenue was calculated and as a result of this the profitability increased to a great extent.
3.2.b
Based on the above both calculation it is necessary that some of the recommendation is being provided to the company. these
recommendation involves the following-
It is recommended to the company that they must also provide membership to the Weekday plus, afternoon and afternoon plus
category as well. this is particularly because of the reason that it is not having current actual membership.
Along with this it is also recommended to company that they must provide some discount on taking the membership. The
reason underlying this fact is that when the company will be providing different discount then this will be attracting more of
the people and as a result of this sales will increase and ultimately the profits.
3.3
MHGC
Income Statement
For the Year Ended December 31, 2020
Full Pass revenue $83,500
Weekday Pass
revenue 47,500
Non-pass golf
revenue 382,000
Total golf revenue $513,000
Golf cart rental 93,000
Range (pre-golf
warm-up and
practice)
50,000
⊘ This is a preview!⊘
Do you want full access?
Subscribe today to unlock all pages.
Trusted by 1+ million students worldwide
1 out of 15

Your All-in-One AI-Powered Toolkit for Academic Success.
+13062052269
info@desklib.com
Available 24*7 on WhatsApp / Email
![[object Object]](/_next/static/media/star-bottom.7253800d.svg)
Unlock your academic potential
Copyright © 2020–2025 A2Z Services. All Rights Reserved. Developed and managed by ZUCOL.