Corporate Financial Statement: SML, CML, MVP and CAPM
VerifiedAdded on 2023/06/07
|12
|2867
|289
AI Summary
This report focuses on the various tools of corporate financial management such as security market line (SML), capital market line (CML), capital asset pricing method (CAPM), required rate of return, minimum portfolio variances etc.
Contribute Materials
Your contribution can guide someone’s learning journey. Share your
documents today.
Running Head: Corporate Financial Statement
1
Project Report: Corporate Financial Statement
1
Project Report: Corporate Financial Statement
Secure Best Marks with AI Grader
Need help grading? Try our AI Grader for instant feedback on your assignments.

Corporate Financial Statement
2
Contents
Introduction.......................................................................................................................3
Difference of security market line from capital market line.............................................3
Minimum variance portfolio.............................................................................................5
CAPM...............................................................................................................................7
Conclusion......................................................................................................................10
References.......................................................................................................................11
Corporate Financial Statement
3
Introduction:
Corporate financial management is a management process which deals with the
different sources to fund the business and improve the capital structure level of the business.
In this management process, the business takes various decisions to improve the value of the
business among the shareholders of the business (Tian & Jiang, 2015). The main objectives
of the corporate financial management are to offer the base to improve the value of the
business in front of the shareholders.
The report focuses on the various tools of corporate financial management such as
security market line (SML), capital market line (CML), capital asset pricing method
(CAPM), required rate of return, minimum portfolio variances etc. All of these tools, their
importance and relevance have been measured in an organization.
Difference of security market line from capital market line:
Security market line (SML) is a graphical representation which is used to represent
the capital asset pricing model (CAPM) such as the risk and return. It describe about the
expected rate of return from the stock of a business along with the systematic risk of the
business. The SML represents about the opportunity cost of an investment. Consequently, the
CML is a line which is used to show about the rate of return along with the risk of a specific
portfolio. The major difference among the SML and CML is how the factors of risk are
measured. In case of CML, the measurement of risk is standard deviation and beta co-
efficient is used in the security market line to measure the risk (Seitzinger et al, 2010). The
capital market line graph depict about the efficient portfolios while the graphs of security
market line brief efficient portfolios and the non efficient portfolios both.
While measuring the return, the portfolio’s expected return for capital market line is
shown along with the Y axis. On the other hand, in case of SML, the securities’ return and
portfolios are shown beside with the Y axis. The portfolio’s standard deviation is shown on
the X axis in case of CML and in case of SML, the security’s beta re shown along with the X
axis of the graph (Peterson and Fabozzi, 2012).
Formula of CML and SML is as follows:
Corporate Financial Statement
4
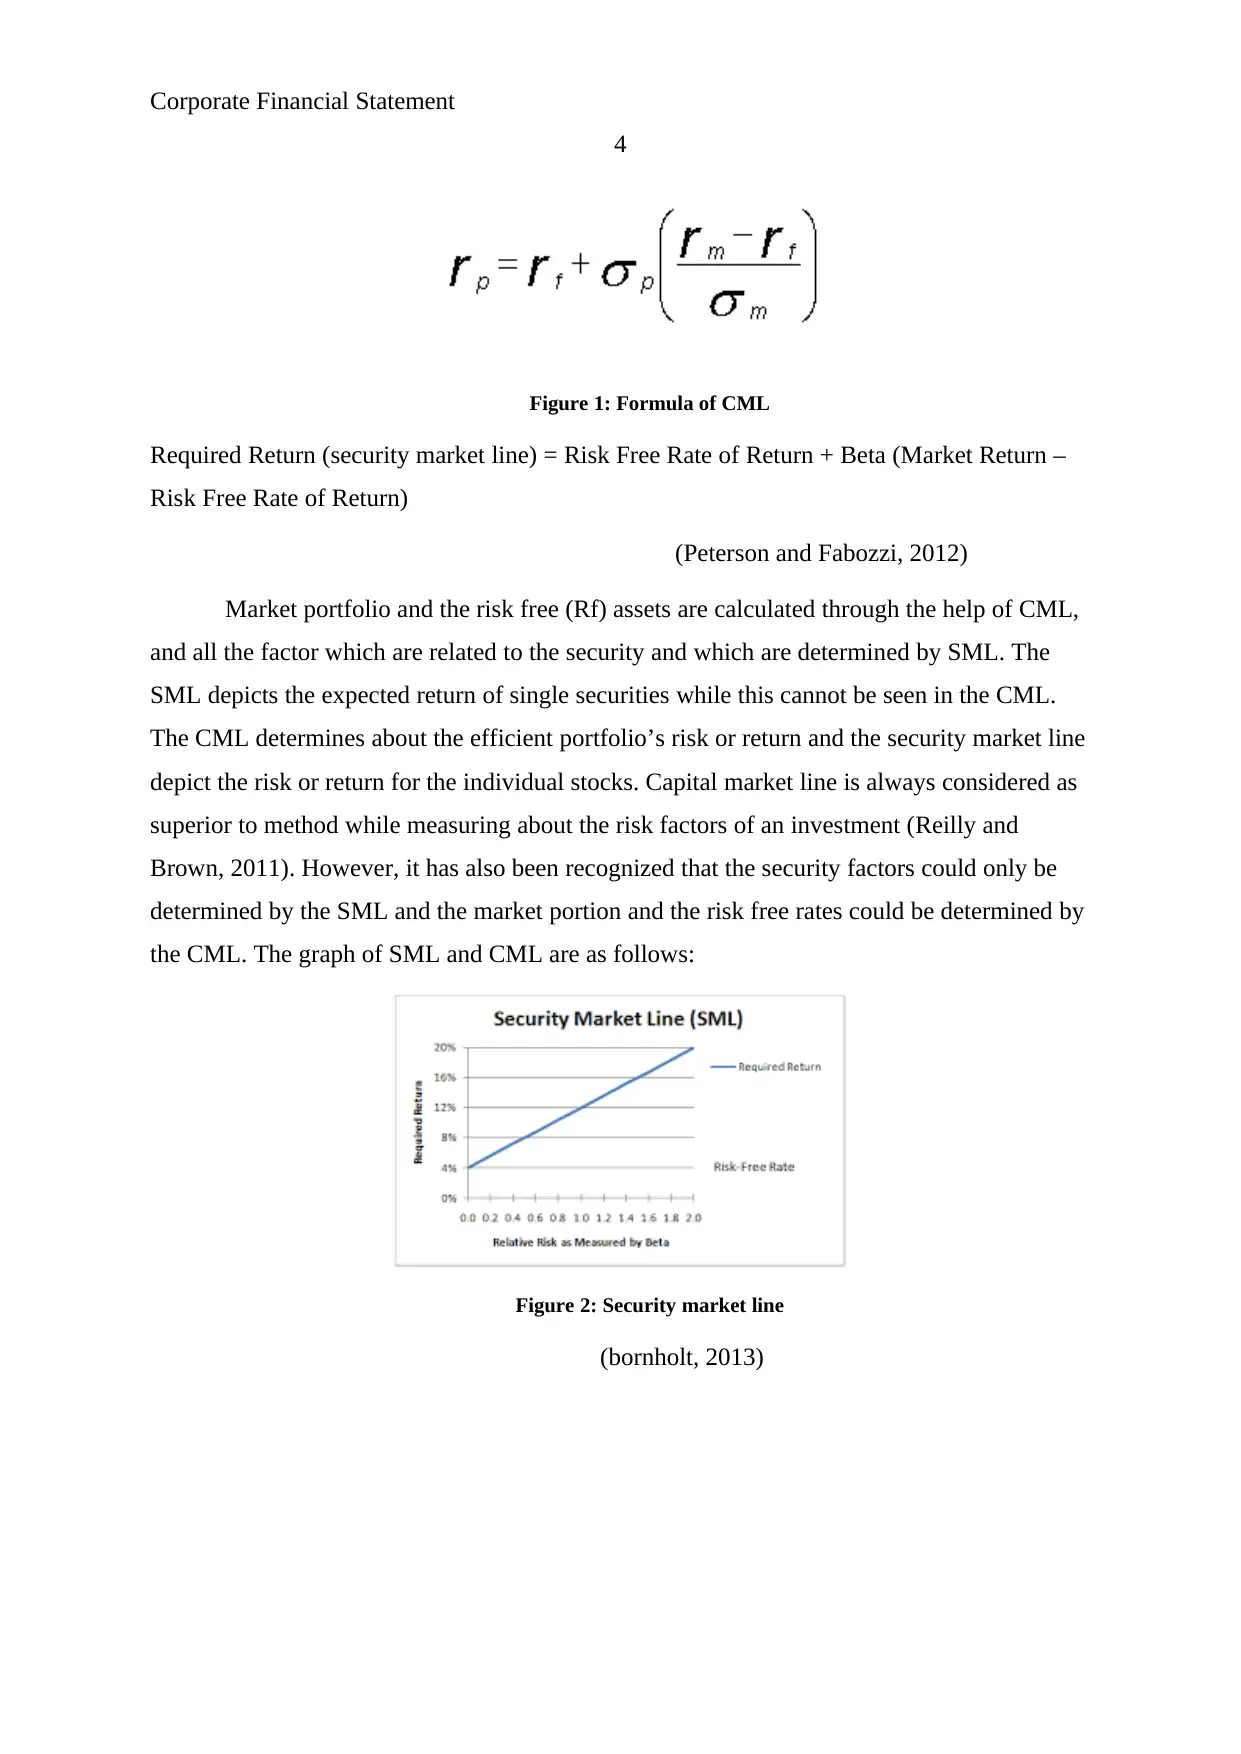
Figure 1: Formula of CML
Required Return (security market line) = Risk Free Rate of Return + Beta (Market Return –
Risk Free Rate of Return)
(Peterson and Fabozzi, 2012)
Market portfolio and the risk free (Rf) assets are calculated through the help of CML,
and all the factor which are related to the security and which are determined by SML. The
SML depicts the expected return of single securities while this cannot be seen in the CML.
The CML determines about the efficient portfolio’s risk or return and the security market line
depict the risk or return for the individual stocks. Capital market line is always considered as
superior to method while measuring about the risk factors of an investment (Reilly and
Brown, 2011). However, it has also been recognized that the security factors could only be
determined by the SML and the market portion and the risk free rates could be determined by
the CML. The graph of SML and CML are as follows:
Figure 2: Security market line
(bornholt, 2013)
4
Figure 1: Formula of CML
Required Return (security market line) = Risk Free Rate of Return + Beta (Market Return –
Risk Free Rate of Return)
(Peterson and Fabozzi, 2012)
Market portfolio and the risk free (Rf) assets are calculated through the help of CML,
and all the factor which are related to the security and which are determined by SML. The
SML depicts the expected return of single securities while this cannot be seen in the CML.
The CML determines about the efficient portfolio’s risk or return and the security market line
depict the risk or return for the individual stocks. Capital market line is always considered as
superior to method while measuring about the risk factors of an investment (Reilly and
Brown, 2011). However, it has also been recognized that the security factors could only be
determined by the SML and the market portion and the risk free rates could be determined by
the CML. The graph of SML and CML are as follows:
Figure 2: Security market line
(bornholt, 2013)
Secure Best Marks with AI Grader
Need help grading? Try our AI Grader for instant feedback on your assignments.
Corporate Financial Statement
5
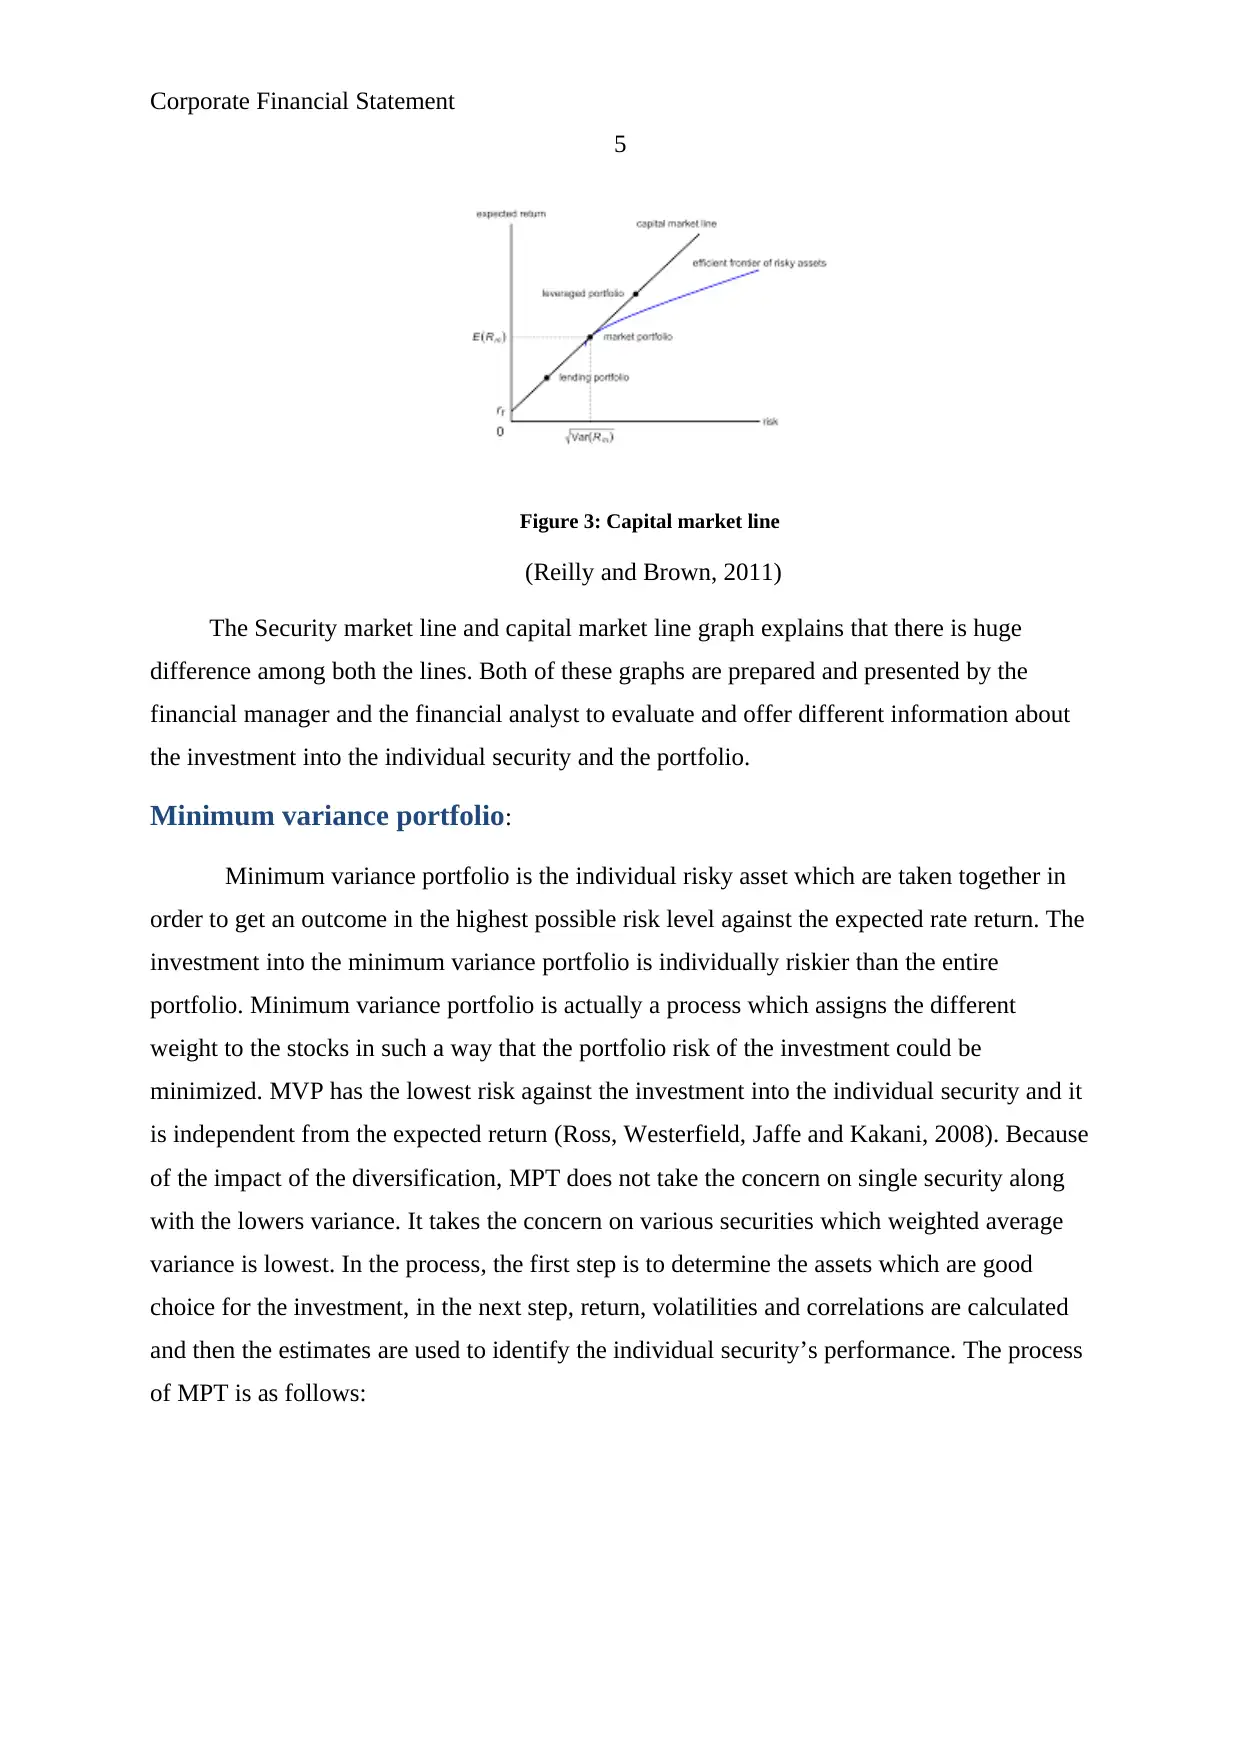
Figure 3: Capital market line
(Reilly and Brown, 2011)
The Security market line and capital market line graph explains that there is huge
difference among both the lines. Both of these graphs are prepared and presented by the
financial manager and the financial analyst to evaluate and offer different information about
the investment into the individual security and the portfolio.
Minimum variance portfolio:
Minimum variance portfolio is the individual risky asset which are taken together in
order to get an outcome in the highest possible risk level against the expected rate return. The
investment into the minimum variance portfolio is individually riskier than the entire
portfolio. Minimum variance portfolio is actually a process which assigns the different
weight to the stocks in such a way that the portfolio risk of the investment could be
minimized. MVP has the lowest risk against the investment into the individual security and it
is independent from the expected return (Ross, Westerfield, Jaffe and Kakani, 2008). Because
of the impact of the diversification, MPT does not take the concern on single security along
with the lowers variance. It takes the concern on various securities which weighted average
variance is lowest. In the process, the first step is to determine the assets which are good
choice for the investment, in the next step, return, volatilities and correlations are calculated
and then the estimates are used to identify the individual security’s performance. The process
of MPT is as follows:
5
Figure 3: Capital market line
(Reilly and Brown, 2011)
The Security market line and capital market line graph explains that there is huge
difference among both the lines. Both of these graphs are prepared and presented by the
financial manager and the financial analyst to evaluate and offer different information about
the investment into the individual security and the portfolio.
Minimum variance portfolio:
Minimum variance portfolio is the individual risky asset which are taken together in
order to get an outcome in the highest possible risk level against the expected rate return. The
investment into the minimum variance portfolio is individually riskier than the entire
portfolio. Minimum variance portfolio is actually a process which assigns the different
weight to the stocks in such a way that the portfolio risk of the investment could be
minimized. MVP has the lowest risk against the investment into the individual security and it
is independent from the expected return (Ross, Westerfield, Jaffe and Kakani, 2008). Because
of the impact of the diversification, MPT does not take the concern on single security along
with the lowers variance. It takes the concern on various securities which weighted average
variance is lowest. In the process, the first step is to determine the assets which are good
choice for the investment, in the next step, return, volatilities and correlations are calculated
and then the estimates are used to identify the individual security’s performance. The process
of MPT is as follows:
Corporate Financial Statement
6
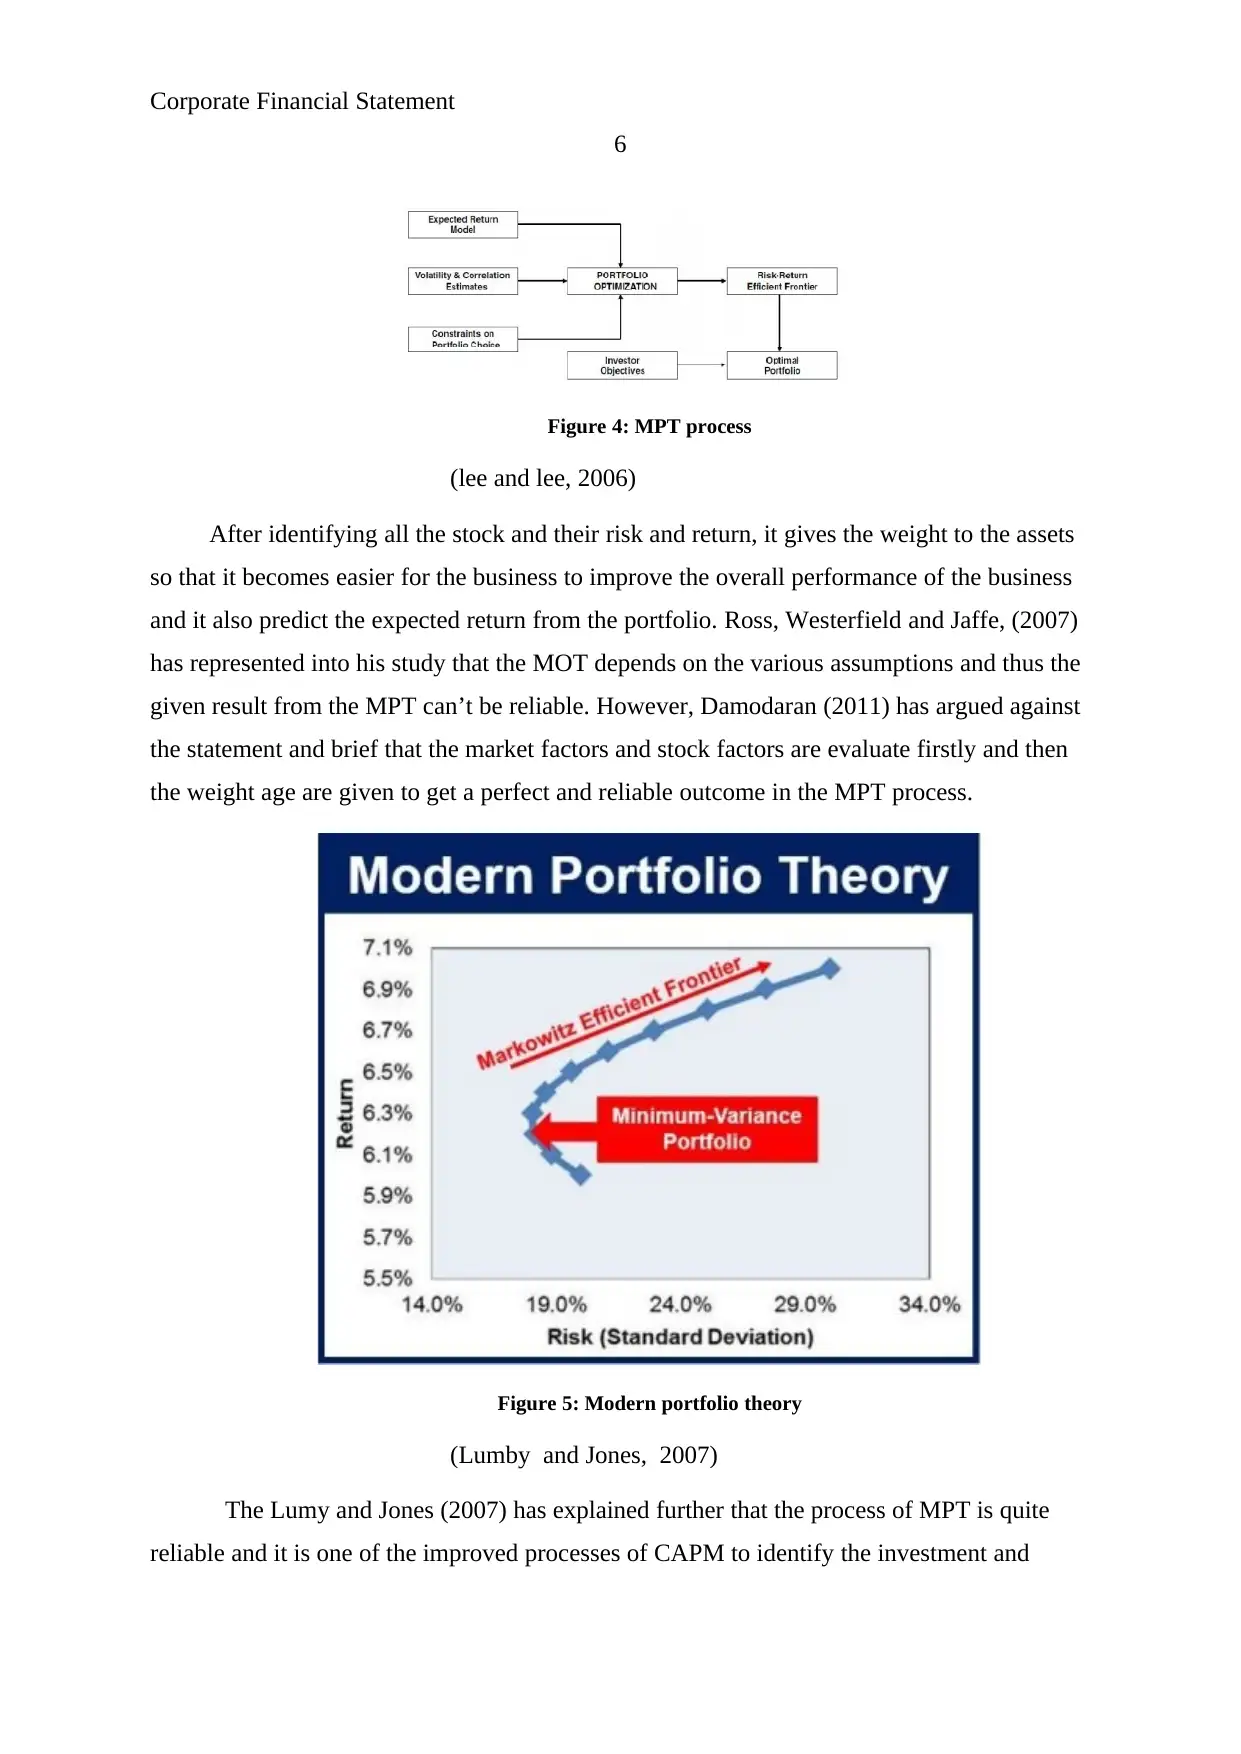
Figure 4: MPT process
(lee and lee, 2006)
After identifying all the stock and their risk and return, it gives the weight to the assets
so that it becomes easier for the business to improve the overall performance of the business
and it also predict the expected return from the portfolio. Ross, Westerfield and Jaffe, (2007)
has represented into his study that the MOT depends on the various assumptions and thus the
given result from the MPT can’t be reliable. However, Damodaran (2011) has argued against
the statement and brief that the market factors and stock factors are evaluate firstly and then
the weight age are given to get a perfect and reliable outcome in the MPT process.
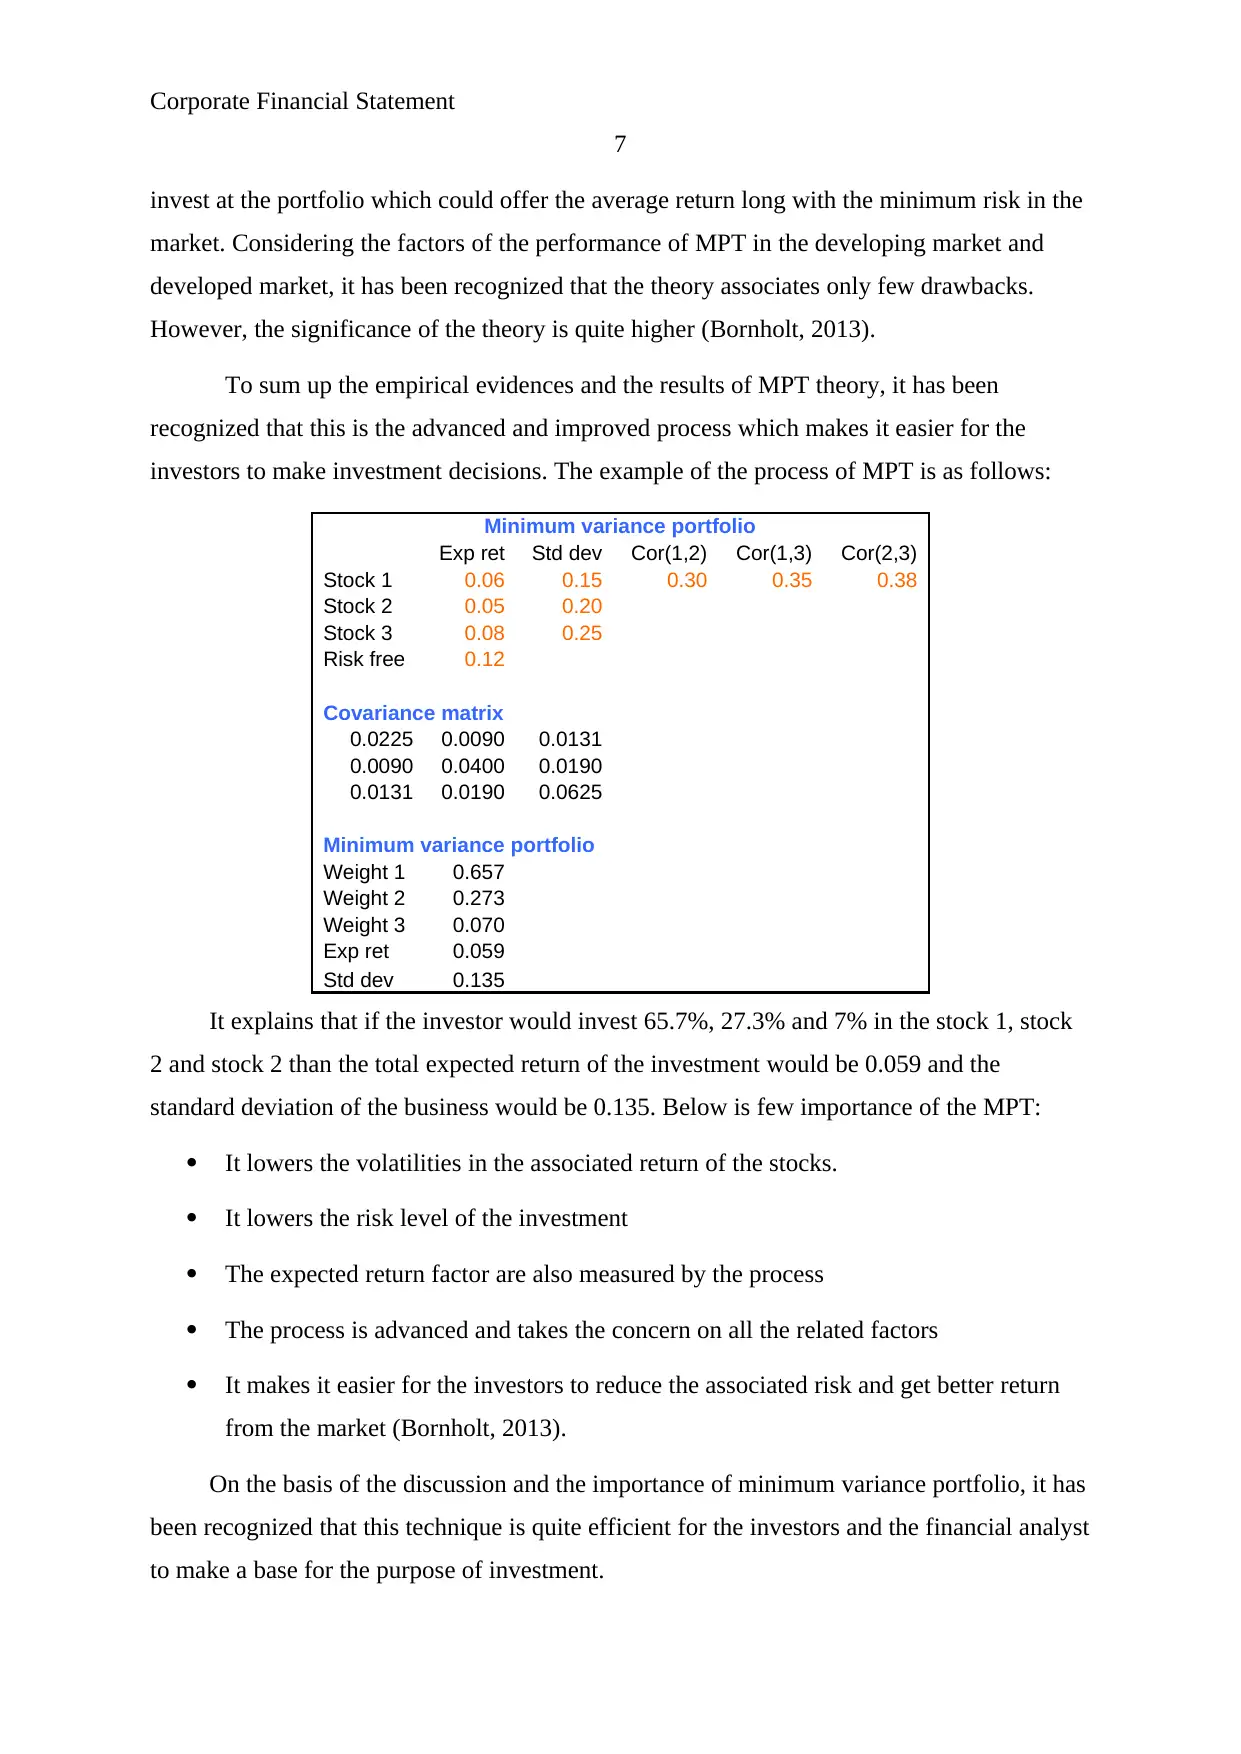
Figure 5: Modern portfolio theory
(Lumby and Jones, 2007)
The Lumy and Jones (2007) has explained further that the process of MPT is quite
reliable and it is one of the improved processes of CAPM to identify the investment and
6
Figure 4: MPT process
(lee and lee, 2006)
After identifying all the stock and their risk and return, it gives the weight to the assets
so that it becomes easier for the business to improve the overall performance of the business
and it also predict the expected return from the portfolio. Ross, Westerfield and Jaffe, (2007)
has represented into his study that the MOT depends on the various assumptions and thus the
given result from the MPT can’t be reliable. However, Damodaran (2011) has argued against
the statement and brief that the market factors and stock factors are evaluate firstly and then
the weight age are given to get a perfect and reliable outcome in the MPT process.
Figure 5: Modern portfolio theory
(Lumby and Jones, 2007)
The Lumy and Jones (2007) has explained further that the process of MPT is quite
reliable and it is one of the improved processes of CAPM to identify the investment and
Corporate Financial Statement
7
invest at the portfolio which could offer the average return long with the minimum risk in the
market. Considering the factors of the performance of MPT in the developing market and
developed market, it has been recognized that the theory associates only few drawbacks.
However, the significance of the theory is quite higher (Bornholt, 2013).
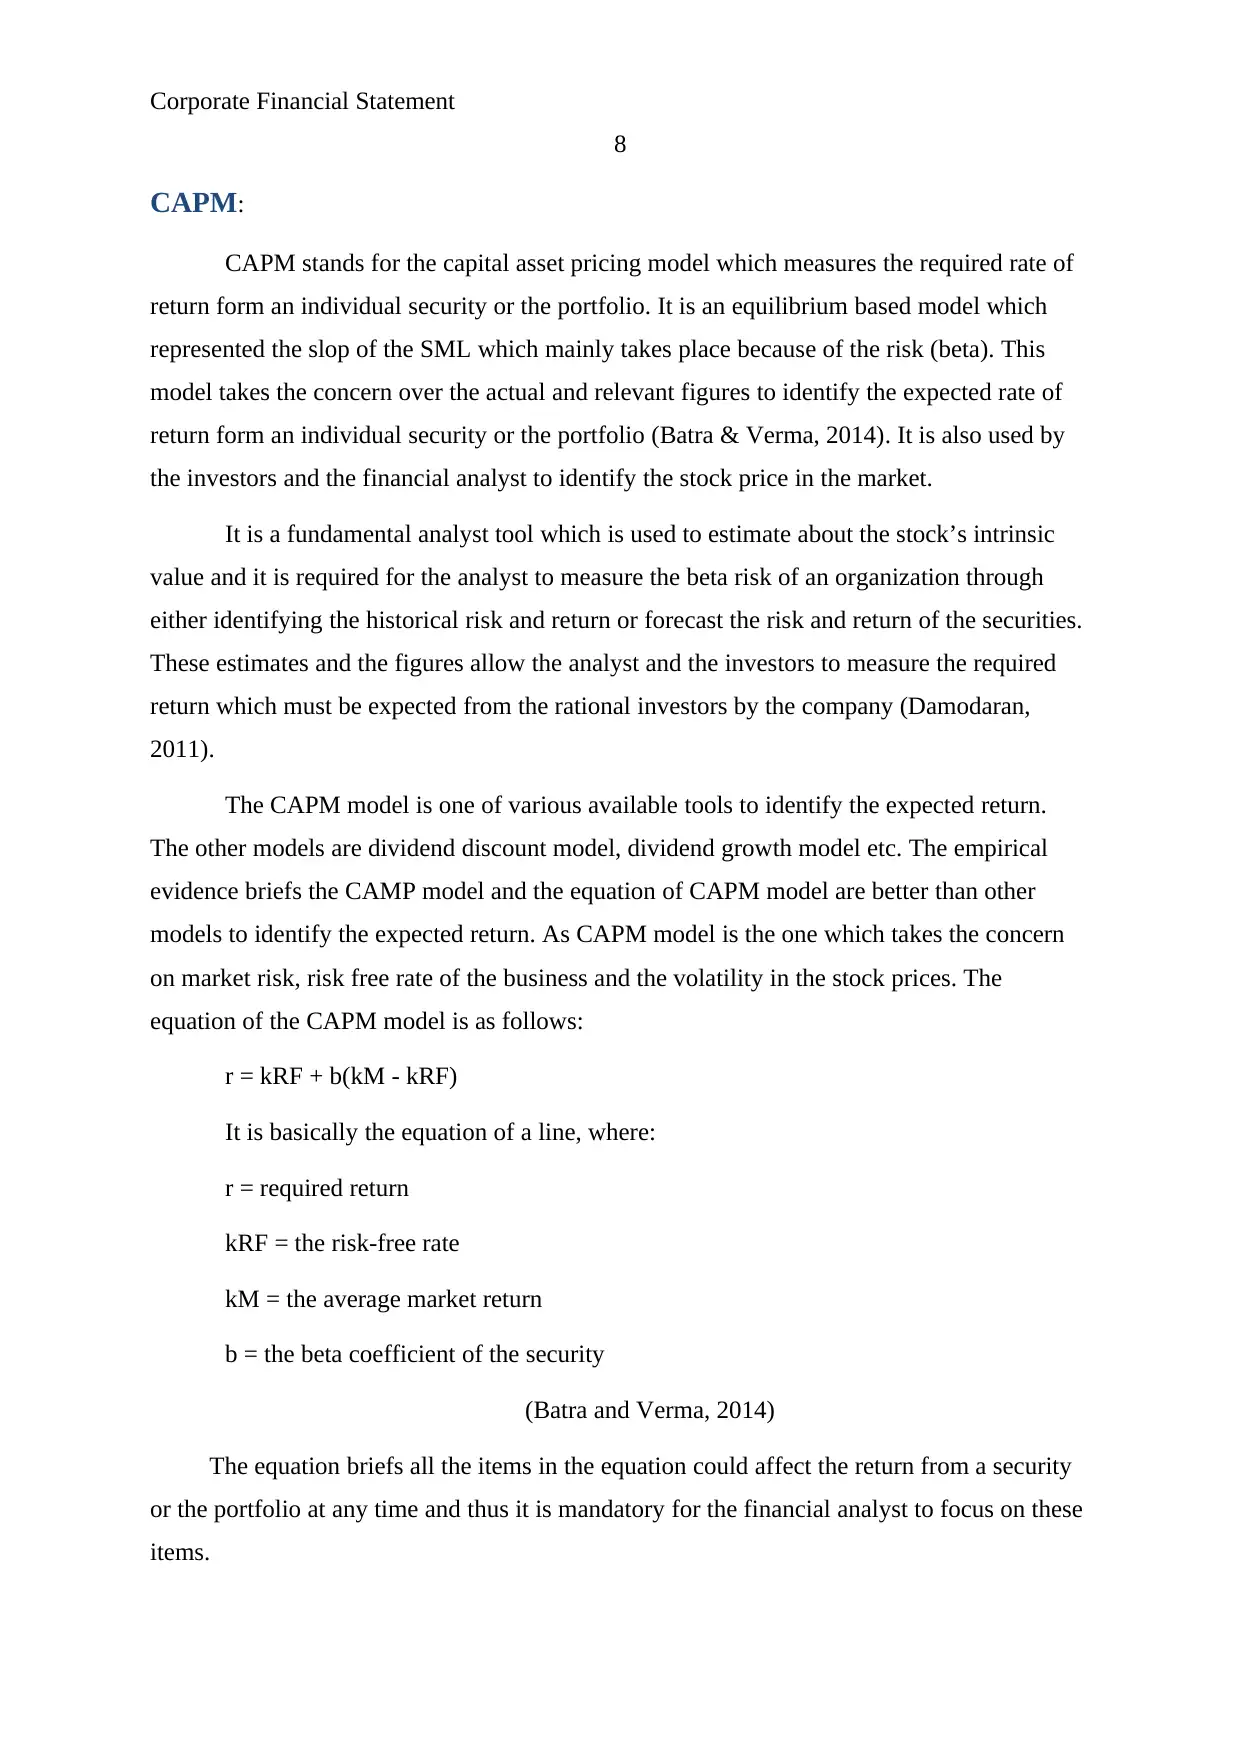
To sum up the empirical evidences and the results of MPT theory, it has been
recognized that this is the advanced and improved process which makes it easier for the
investors to make investment decisions. The example of the process of MPT is as follows:
Minimum variance portfolio
Exp ret Std dev Cor(1,2) Cor(1,3) Cor(2,3)
Stock 1 0.06 0.15 0.30 0.35 0.38
Stock 2 0.05 0.20
Stock 3 0.08 0.25
Risk free 0.12
Covariance matrix
0.0225 0.0090 0.0131
0.0090 0.0400 0.0190
0.0131 0.0190 0.0625
Minimum variance portfolio
Weight 1 0.657
Weight 2 0.273
Weight 3 0.070
Exp ret 0.059
Std dev 0.135
It explains that if the investor would invest 65.7%, 27.3% and 7% in the stock 1, stock
2 and stock 2 than the total expected return of the investment would be 0.059 and the
standard deviation of the business would be 0.135. Below is few importance of the MPT:
It lowers the volatilities in the associated return of the stocks.
It lowers the risk level of the investment
The expected return factor are also measured by the process
The process is advanced and takes the concern on all the related factors
It makes it easier for the investors to reduce the associated risk and get better return
from the market (Bornholt, 2013).
On the basis of the discussion and the importance of minimum variance portfolio, it has
been recognized that this technique is quite efficient for the investors and the financial analyst
to make a base for the purpose of investment.
7
invest at the portfolio which could offer the average return long with the minimum risk in the
market. Considering the factors of the performance of MPT in the developing market and
developed market, it has been recognized that the theory associates only few drawbacks.
However, the significance of the theory is quite higher (Bornholt, 2013).
To sum up the empirical evidences and the results of MPT theory, it has been
recognized that this is the advanced and improved process which makes it easier for the
investors to make investment decisions. The example of the process of MPT is as follows:
Minimum variance portfolio
Exp ret Std dev Cor(1,2) Cor(1,3) Cor(2,3)
Stock 1 0.06 0.15 0.30 0.35 0.38
Stock 2 0.05 0.20
Stock 3 0.08 0.25
Risk free 0.12
Covariance matrix
0.0225 0.0090 0.0131
0.0090 0.0400 0.0190
0.0131 0.0190 0.0625
Minimum variance portfolio
Weight 1 0.657
Weight 2 0.273
Weight 3 0.070
Exp ret 0.059
Std dev 0.135
It explains that if the investor would invest 65.7%, 27.3% and 7% in the stock 1, stock
2 and stock 2 than the total expected return of the investment would be 0.059 and the
standard deviation of the business would be 0.135. Below is few importance of the MPT:
It lowers the volatilities in the associated return of the stocks.
It lowers the risk level of the investment
The expected return factor are also measured by the process
The process is advanced and takes the concern on all the related factors
It makes it easier for the investors to reduce the associated risk and get better return
from the market (Bornholt, 2013).
On the basis of the discussion and the importance of minimum variance portfolio, it has
been recognized that this technique is quite efficient for the investors and the financial analyst
to make a base for the purpose of investment.
Paraphrase This Document
Need a fresh take? Get an instant paraphrase of this document with our AI Paraphraser
Corporate Financial Statement
8
CAPM:
CAPM stands for the capital asset pricing model which measures the required rate of
return form an individual security or the portfolio. It is an equilibrium based model which
represented the slop of the SML which mainly takes place because of the risk (beta). This
model takes the concern over the actual and relevant figures to identify the expected rate of
return form an individual security or the portfolio (Batra & Verma, 2014). It is also used by
the investors and the financial analyst to identify the stock price in the market.
It is a fundamental analyst tool which is used to estimate about the stock’s intrinsic
value and it is required for the analyst to measure the beta risk of an organization through
either identifying the historical risk and return or forecast the risk and return of the securities.
These estimates and the figures allow the analyst and the investors to measure the required
return which must be expected from the rational investors by the company (Damodaran,
2011).
The CAPM model is one of various available tools to identify the expected return.
The other models are dividend discount model, dividend growth model etc. The empirical
evidence briefs the CAMP model and the equation of CAPM model are better than other
models to identify the expected return. As CAPM model is the one which takes the concern
on market risk, risk free rate of the business and the volatility in the stock prices. The
equation of the CAPM model is as follows:
r = kRF + b(kM - kRF)
It is basically the equation of a line, where:
r = required return
kRF = the risk-free rate
kM = the average market return
b = the beta coefficient of the security
(Batra and Verma, 2014)
The equation briefs all the items in the equation could affect the return from a security
or the portfolio at any time and thus it is mandatory for the financial analyst to focus on these
items.
Corporate Financial Statement
9
Beta:
Each of the stock is different by nature and the associated risk of each stock is also
different. The beta coefficient describes about the associated risk of the stock. The rate of
return (r) of an asset explains about the risk which can’t be diversified away even in the case
of a portfolio. Beta coefficient mainly briefs the changes into the stock prices. The beta
values play a significant role in order to identify the exact return from the security or the
portfolio (Moles, Parrino and Kidwekk, 2011).
Risk free rate:
R (f) Risk free rate is estimated by the Australia’s government treasury bonds. It
explains that how long an investors wants to hold the investment and if for the same time, the
investment would be done in the fixed rate treasury bond of the country than how much
return could be got by the investors (Lee and lee, 2006). It is the minimum return which is
expected from the investors through investing into the security.
Market risk premium:
Market risk premium explains about the expected return of risky investment which is
in excess of the risk free rate of the country. This define that the changes into the market
stock price is so and thus the required rate of return from an individual security must be
accordingly (Zabarankin, Pavlikov and Uryasev, 2014).
Required return:
Required return is the total % of return which is expected from the company by
investors. That is the minimum return for which an investor makes the investment into the
company. The required return is calculated in CAPM model by measuring the beta, risk free
rate of the market and the average market return of the index (Lumby and Jones, 2007). It
offers the better outcome to the investors than the other model because of its wider
application and the focus.
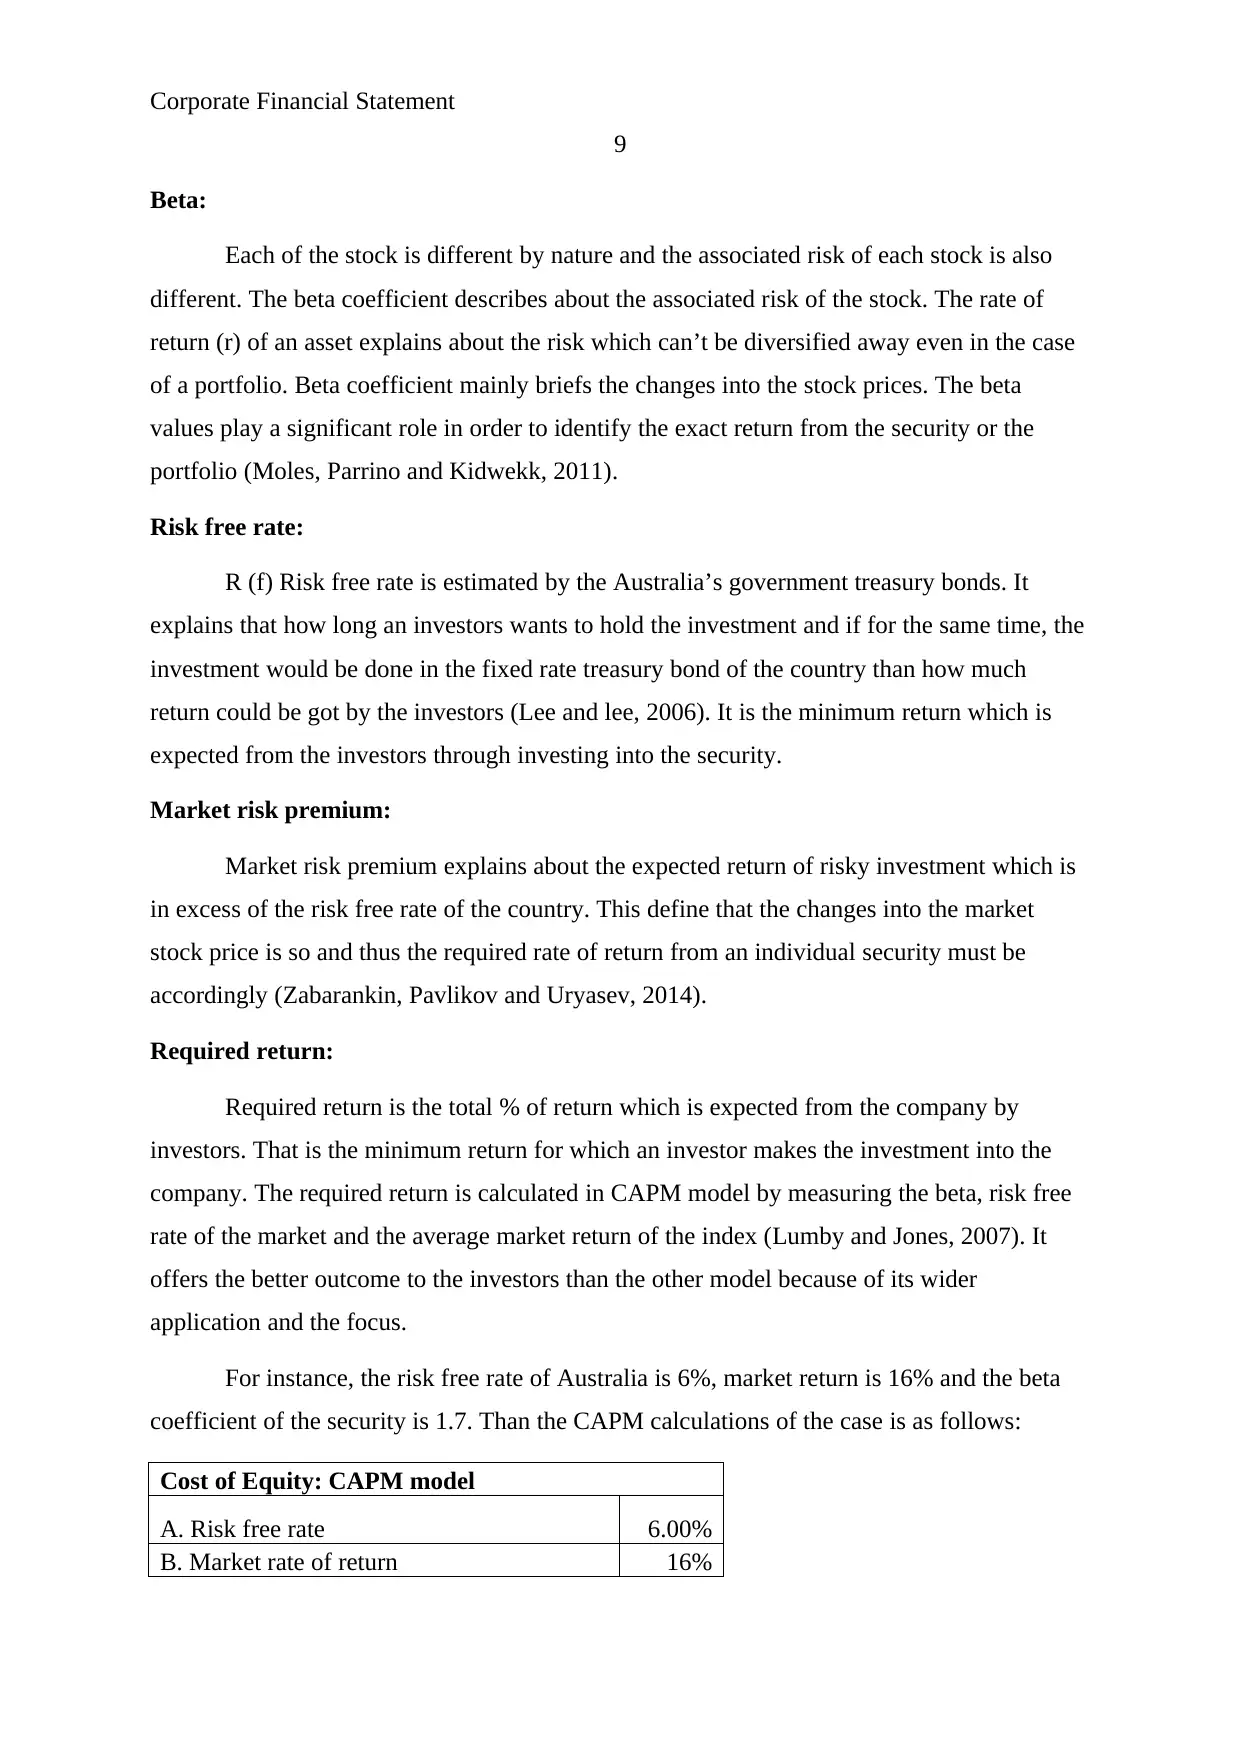
For instance, the risk free rate of Australia is 6%, market return is 16% and the beta
coefficient of the security is 1.7. Than the CAPM calculations of the case is as follows:
Cost of Equity: CAPM model
A. Risk free rate 6.00%
B. Market rate of return 16%
9
Beta:
Each of the stock is different by nature and the associated risk of each stock is also
different. The beta coefficient describes about the associated risk of the stock. The rate of
return (r) of an asset explains about the risk which can’t be diversified away even in the case
of a portfolio. Beta coefficient mainly briefs the changes into the stock prices. The beta
values play a significant role in order to identify the exact return from the security or the
portfolio (Moles, Parrino and Kidwekk, 2011).
Risk free rate:
R (f) Risk free rate is estimated by the Australia’s government treasury bonds. It
explains that how long an investors wants to hold the investment and if for the same time, the
investment would be done in the fixed rate treasury bond of the country than how much
return could be got by the investors (Lee and lee, 2006). It is the minimum return which is
expected from the investors through investing into the security.
Market risk premium:
Market risk premium explains about the expected return of risky investment which is
in excess of the risk free rate of the country. This define that the changes into the market
stock price is so and thus the required rate of return from an individual security must be
accordingly (Zabarankin, Pavlikov and Uryasev, 2014).
Required return:
Required return is the total % of return which is expected from the company by
investors. That is the minimum return for which an investor makes the investment into the
company. The required return is calculated in CAPM model by measuring the beta, risk free
rate of the market and the average market return of the index (Lumby and Jones, 2007). It
offers the better outcome to the investors than the other model because of its wider
application and the focus.
For instance, the risk free rate of Australia is 6%, market return is 16% and the beta
coefficient of the security is 1.7. Than the CAPM calculations of the case is as follows:
Cost of Equity: CAPM model
A. Risk free rate 6.00%
B. Market rate of return 16%
Corporate Financial Statement
10
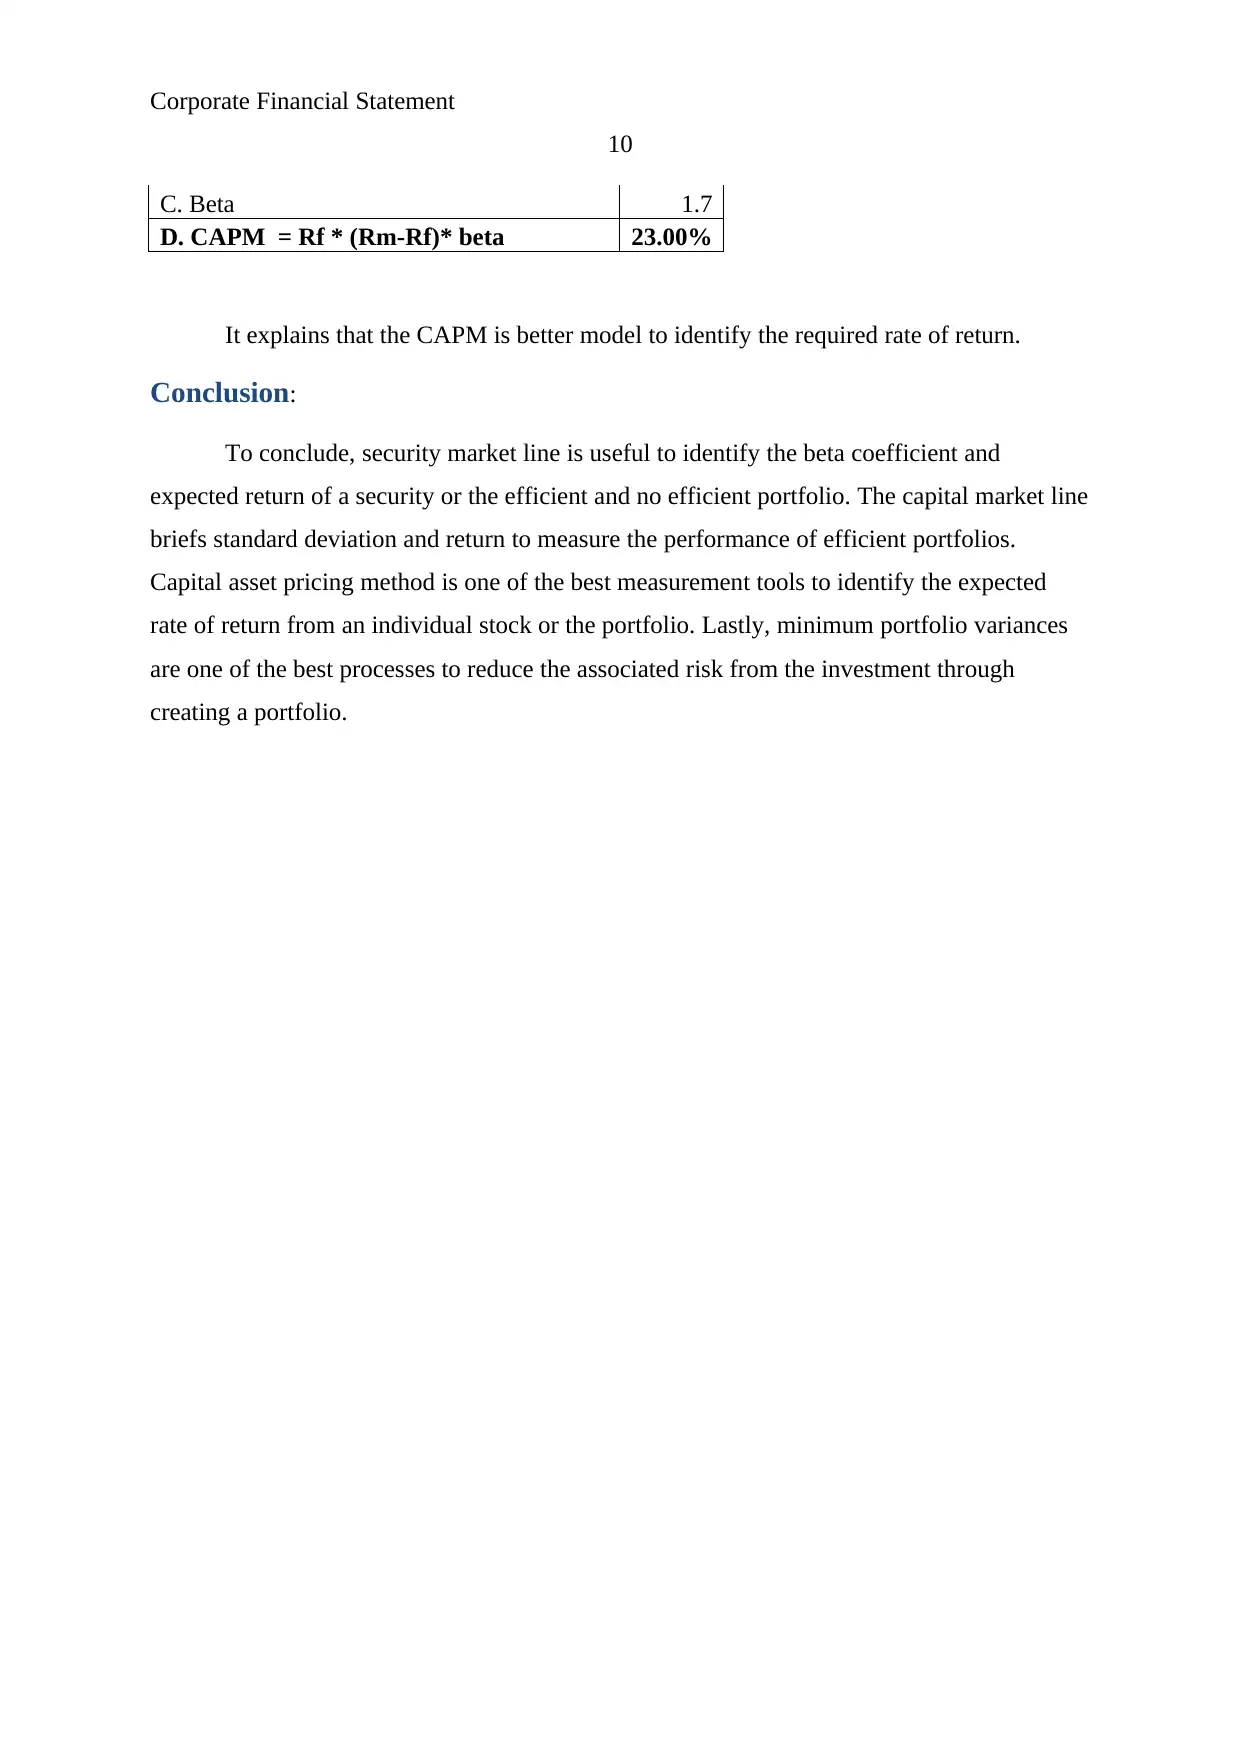
C. Beta 1.7
D. CAPM = Rf * (Rm-Rf)* beta 23.00%
It explains that the CAPM is better model to identify the required rate of return.
Conclusion:
To conclude, security market line is useful to identify the beta coefficient and
expected return of a security or the efficient and no efficient portfolio. The capital market line
briefs standard deviation and return to measure the performance of efficient portfolios.
Capital asset pricing method is one of the best measurement tools to identify the expected
rate of return from an individual stock or the portfolio. Lastly, minimum portfolio variances
are one of the best processes to reduce the associated risk from the investment through
creating a portfolio.
10
C. Beta 1.7
D. CAPM = Rf * (Rm-Rf)* beta 23.00%
It explains that the CAPM is better model to identify the required rate of return.
Conclusion:
To conclude, security market line is useful to identify the beta coefficient and
expected return of a security or the efficient and no efficient portfolio. The capital market line
briefs standard deviation and return to measure the performance of efficient portfolios.
Capital asset pricing method is one of the best measurement tools to identify the expected
rate of return from an individual stock or the portfolio. Lastly, minimum portfolio variances
are one of the best processes to reduce the associated risk from the investment through
creating a portfolio.
Secure Best Marks with AI Grader
Need help grading? Try our AI Grader for instant feedback on your assignments.
Corporate Financial Statement
11
References:
Barlow.J.F., 2006, Excel models for business and operations management, 2nd edition, John
Wiley & sons ltd, England.
Batra, R. and Verma, S. 2014, "An Empirical Insight into Different Stages of Capital
Budgeting", Global Business Review, 15 (2), pp. 339-362.
Bornholt, G. 2013, "The Failure of the Capital Asset Pricing Model (CAPM): An Update and
Discussion: The Capital Asset Pricing Model", Abacus, 49 (1), pp. 36-43.
Damodaran, A, 2011, Applied corporate finance. 3rd edition, John Wiley & sons, USA.
Lee.C.F and Lee, A, C,.2006. Encyclopedia of finance. Springer science, new York.
Lumby,S and Jones,C,.2007, Corporate finance theory & practice, 7th edition, Thomson,
London.
Moles, P. Parrino, R and Kidwekk, D,.2011. Corporate finance. European edition, John
Wiley &sons, United Kingdom.
Peterson, P,P and Fabozzi,F,J,. 2012. Capital budgeting: theory and practice. John Wiley &
sons, Canada.
Reilly.F.K and Brown.K.C,.2011. Investment analysis & portfolio management. 10th edition,
South western Cengage learning, India.
Ross, A,. Westerfield, R,W,. Jaffe,J,.and Kakani,R,K,.2008. Corporate Finance. 8th edition,
Tata McGraw hill education private limited, New Delhi, India
Ross, S, A,. Westerfield, R, W,. And Jaffe, J,.2007. Corporate Finance. the McGraw-hill,
India
Seitzinger, S.P., Mayorga, E., Bouwman, A.F., Kroeze, C., Beusen, A.H.W., Billen, G., cht,
v., G, Dumont, E.L., Fekete, B.M., Garnier, J. and Harrison, J. 2010, "Global River Nutrient
Export: A Scenario Analysis of Past and Future Trends", Global Biogeochemical Cycles, 24
(3) pp. GB0A08-GB0A08.
Tian, D. and Jiang, L. 2015, "Quasiconvex risk statistics with scenario
analysis", Mathematics and Financial Economics, 9(2), pp. 111-121.

Corporate Financial Statement
12
Zabarankin, M., Pavlikov, K. and Uryasev, S. 2014. "Capital Asset Pricing Model with
drawdown measure", European Journal of Operational Research, 234 (2), pp. 508.
12
Zabarankin, M., Pavlikov, K. and Uryasev, S. 2014. "Capital Asset Pricing Model with
drawdown measure", European Journal of Operational Research, 234 (2), pp. 508.
1 out of 12
Related Documents


Your All-in-One AI-Powered Toolkit for Academic Success.
+13062052269
info@desklib.com
Available 24*7 on WhatsApp / Email
![[object Object]](/_next/static/media/star-bottom.7253800d.svg)
Unlock your academic potential
© 2024 | Zucol Services PVT LTD | All rights reserved.