logo

Corporate Financial Statement: SML, CML, MVP and CAPM

12 Pages2867 Words289 Views
   

Added on  2023-06-07

About This Document

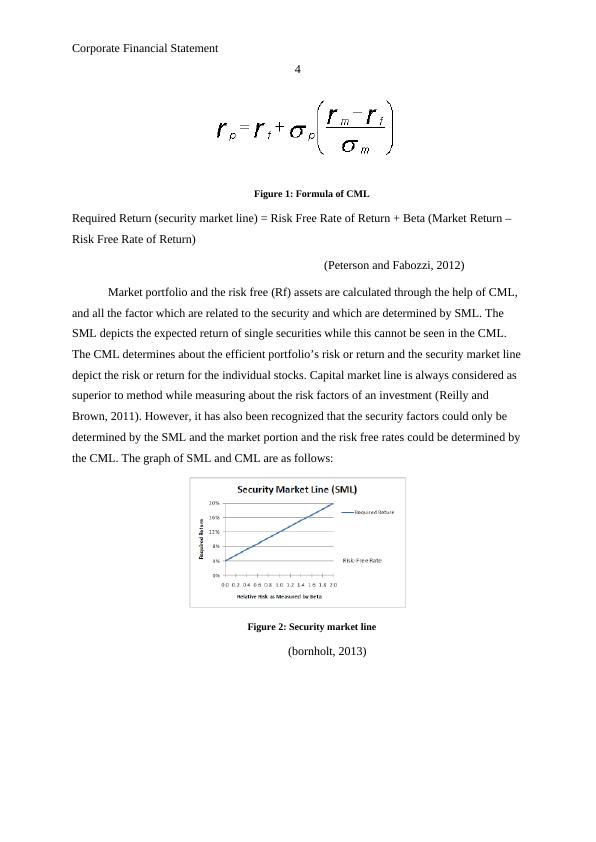
This report focuses on the various tools of corporate financial management such as security market line (SML), capital market line (CML), capital asset pricing method (CAPM), required rate of return, minimum portfolio variances etc.

Corporate Financial Statement: SML, CML, MVP and CAPM

   Added on 2023-06-07

ShareRelated Documents
Running Head: Corporate Financial Statement
1
Project Report: Corporate Financial Statement
Corporate Financial Statement: SML, CML, MVP and CAPM_1
Corporate Financial Statement
2
Contents
Introduction.......................................................................................................................3
Difference of security market line from capital market line.............................................3
Minimum variance portfolio.............................................................................................5
CAPM...............................................................................................................................7
Conclusion......................................................................................................................10
References.......................................................................................................................11
Corporate Financial Statement: SML, CML, MVP and CAPM_2
Corporate Financial Statement
3
Introduction:
Corporate financial management is a management process which deals with the
different sources to fund the business and improve the capital structure level of the business.
In this management process, the business takes various decisions to improve the value of the
business among the shareholders of the business (Tian & Jiang, 2015). The main objectives
of the corporate financial management are to offer the base to improve the value of the
business in front of the shareholders.
The report focuses on the various tools of corporate financial management such as
security market line (SML), capital market line (CML), capital asset pricing method
(CAPM), required rate of return, minimum portfolio variances etc. All of these tools, their
importance and relevance have been measured in an organization.
Difference of security market line from capital market line:
Security market line (SML) is a graphical representation which is used to represent
the capital asset pricing model (CAPM) such as the risk and return. It describe about the
expected rate of return from the stock of a business along with the systematic risk of the
business. The SML represents about the opportunity cost of an investment. Consequently, the
CML is a line which is used to show about the rate of return along with the risk of a specific
portfolio. The major difference among the SML and CML is how the factors of risk are
measured. In case of CML, the measurement of risk is standard deviation and beta co-
efficient is used in the security market line to measure the risk (Seitzinger et al, 2010). The
capital market line graph depict about the efficient portfolios while the graphs of security
market line brief efficient portfolios and the non efficient portfolios both.
While measuring the return, the portfolio’s expected return for capital market line is
shown along with the Y axis. On the other hand, in case of SML, the securities’ return and
portfolios are shown beside with the Y axis. The portfolio’s standard deviation is shown on
the X axis in case of CML and in case of SML, the security’s beta re shown along with the X
axis of the graph (Peterson and Fabozzi, 2012).
Formula of CML and SML is as follows:
Corporate Financial Statement: SML, CML, MVP and CAPM_3
Corporate Financial Statement
4
Figure 1: Formula of CML
Required Return (security market line) = Risk Free Rate of Return + Beta (Market Return –
Risk Free Rate of Return)
(Peterson and Fabozzi, 2012)
Market portfolio and the risk free (Rf) assets are calculated through the help of CML,
and all the factor which are related to the security and which are determined by SML. The
SML depicts the expected return of single securities while this cannot be seen in the CML.
The CML determines about the efficient portfolio’s risk or return and the security market line
depict the risk or return for the individual stocks. Capital market line is always considered as
superior to method while measuring about the risk factors of an investment (Reilly and
Brown, 2011). However, it has also been recognized that the security factors could only be
determined by the SML and the market portion and the risk free rates could be determined by
the CML. The graph of SML and CML are as follows:
Figure 2: Security market line
(bornholt, 2013)
Corporate Financial Statement: SML, CML, MVP and CAPM_4

End of preview

Want to access all the pages? Upload your documents or become a member.

Related Documents
Corporate Financial Management
|13
|2400
|478

Understanding Security Market Line and Capital Market Line in Financial Management
|13
|3198
|120

Corporate Financial Management: Differences between SML and CML, Minimum Variance Portfolios, and Relevancy of CAPM Approach
|12
|958
|375

Security Market Line Assignment
|10
|2565
|91

Corporate Finance: Security Market Line, Minimum Variance Portfolio, CAPM Equation
|11
|2772
|250

Comparative Analysis of Security Market Line and Capital Market Line
|11
|2573
|269