MATH125 Unit 4 Assignment: Counting Techniques and Probability
VerifiedAdded on 2023/06/15
|8
|979
|390
Homework Assignment
AI Summary
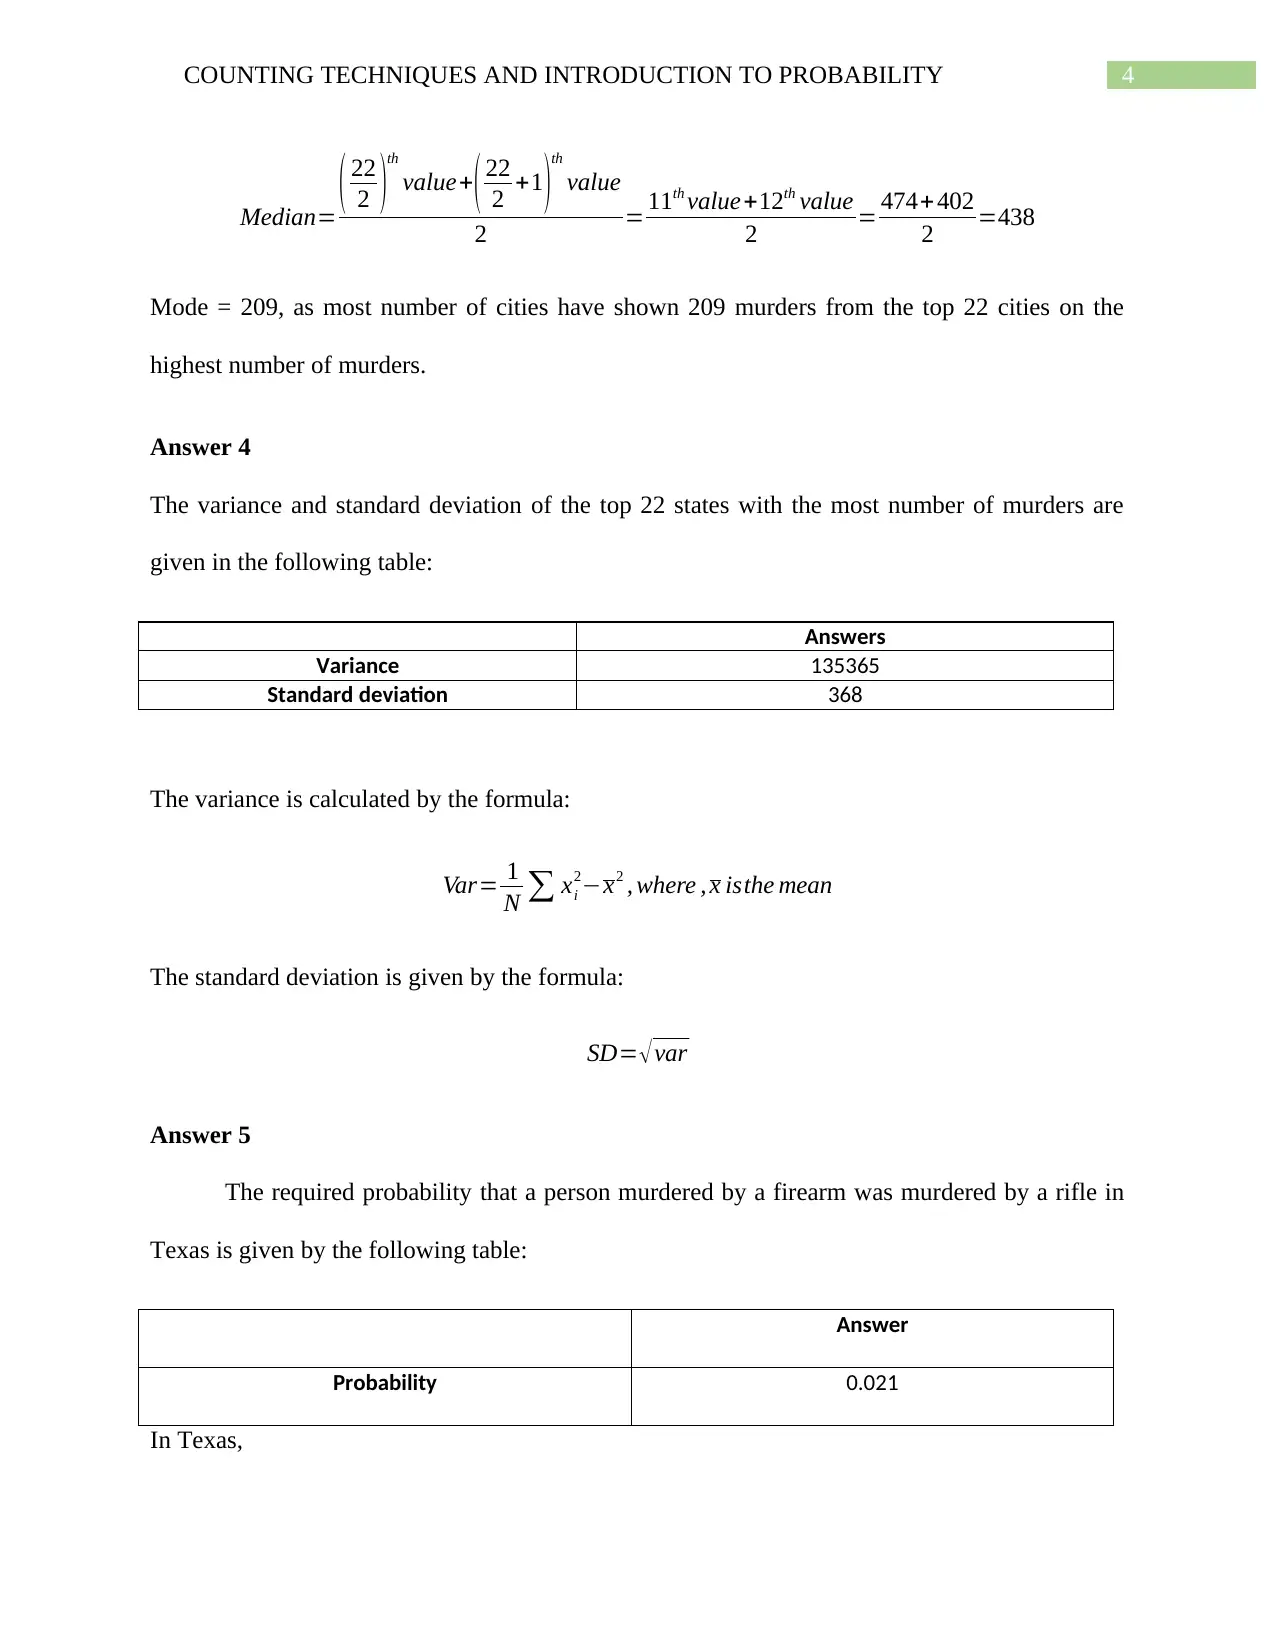
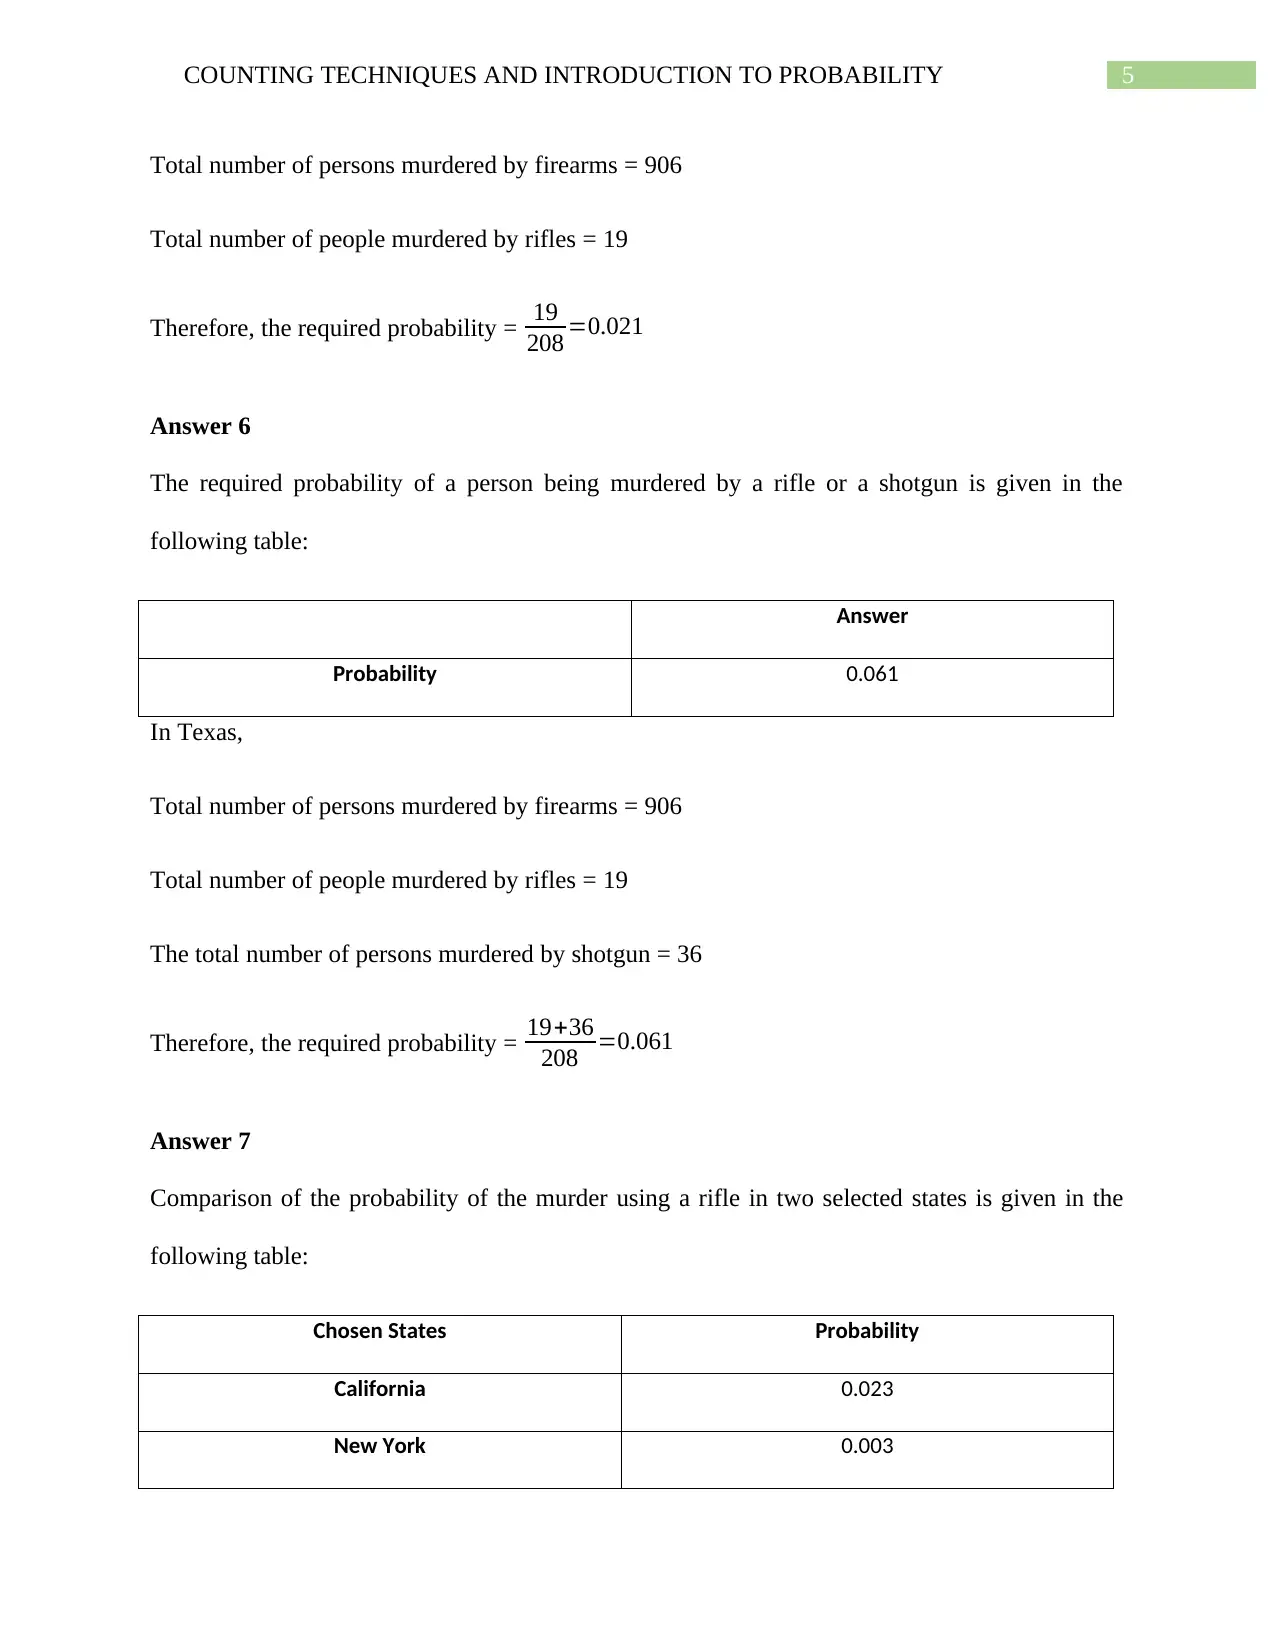
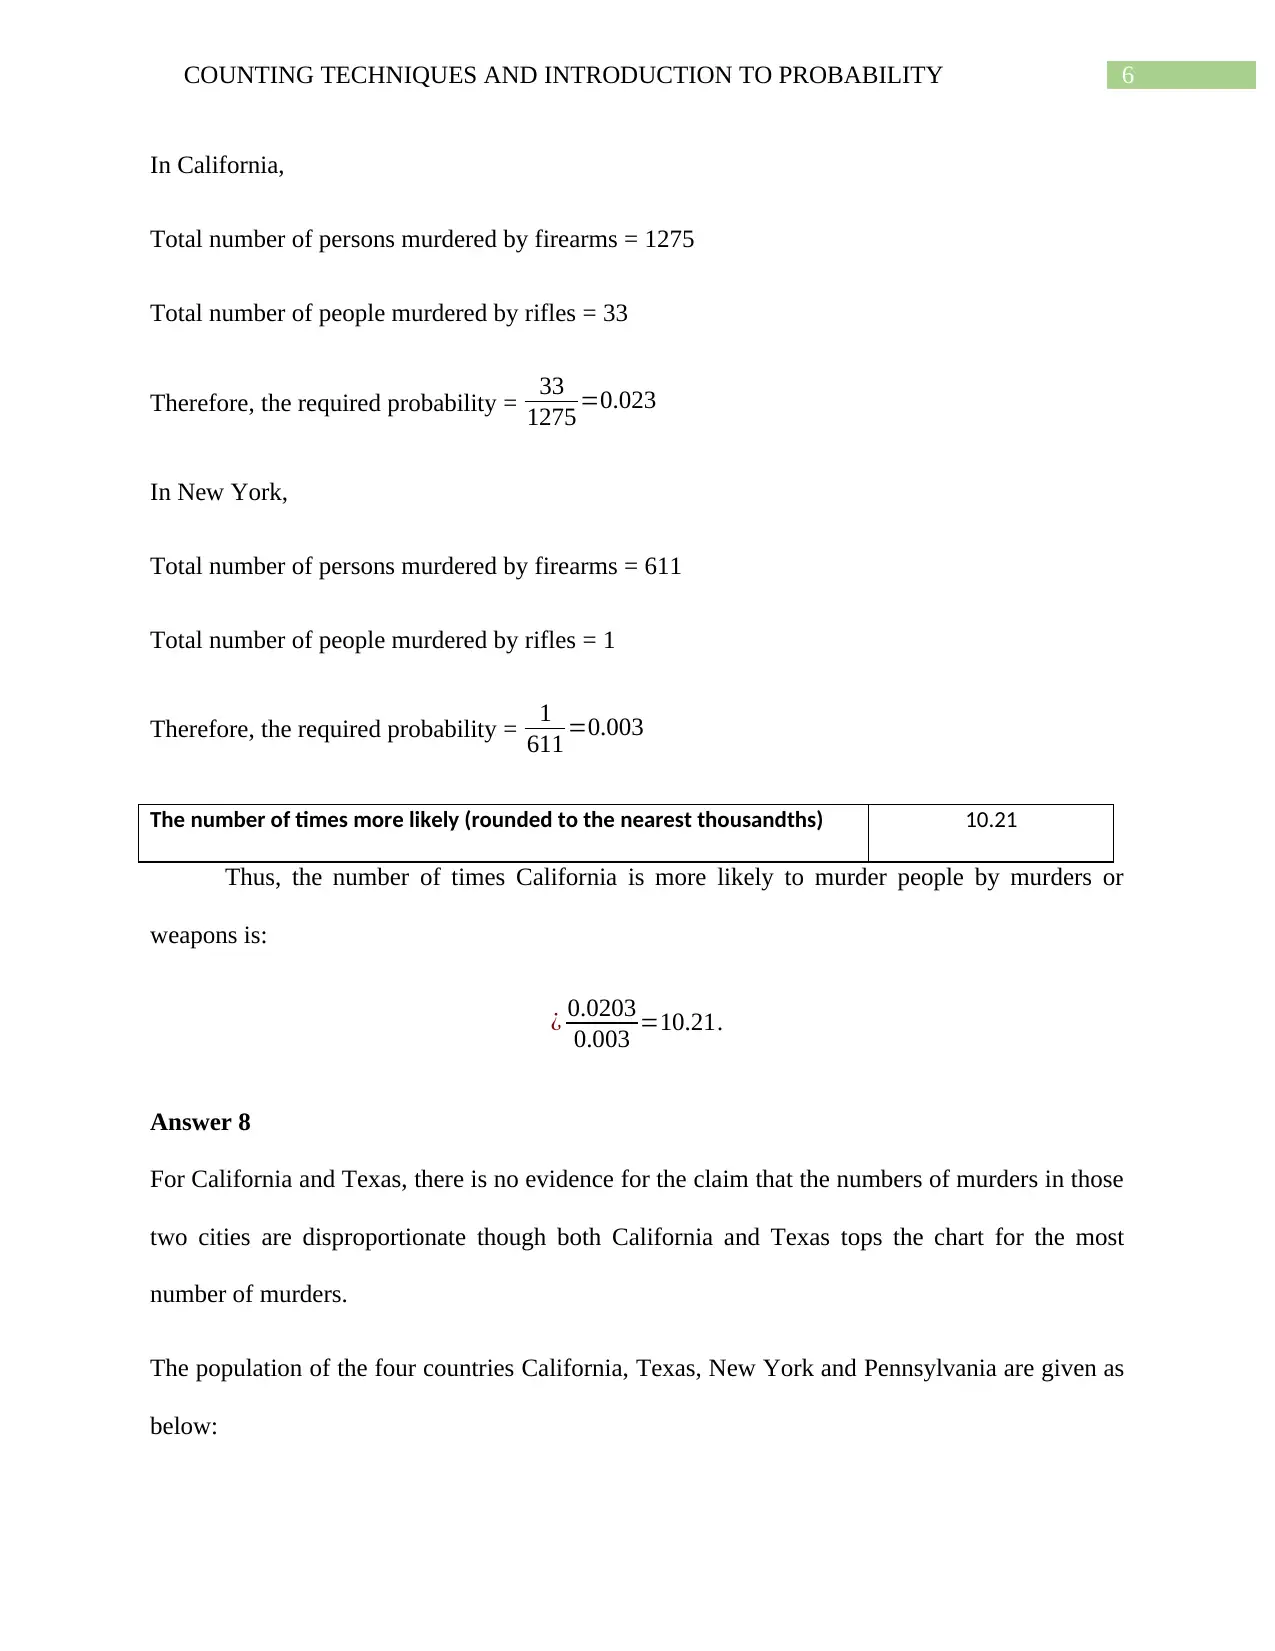
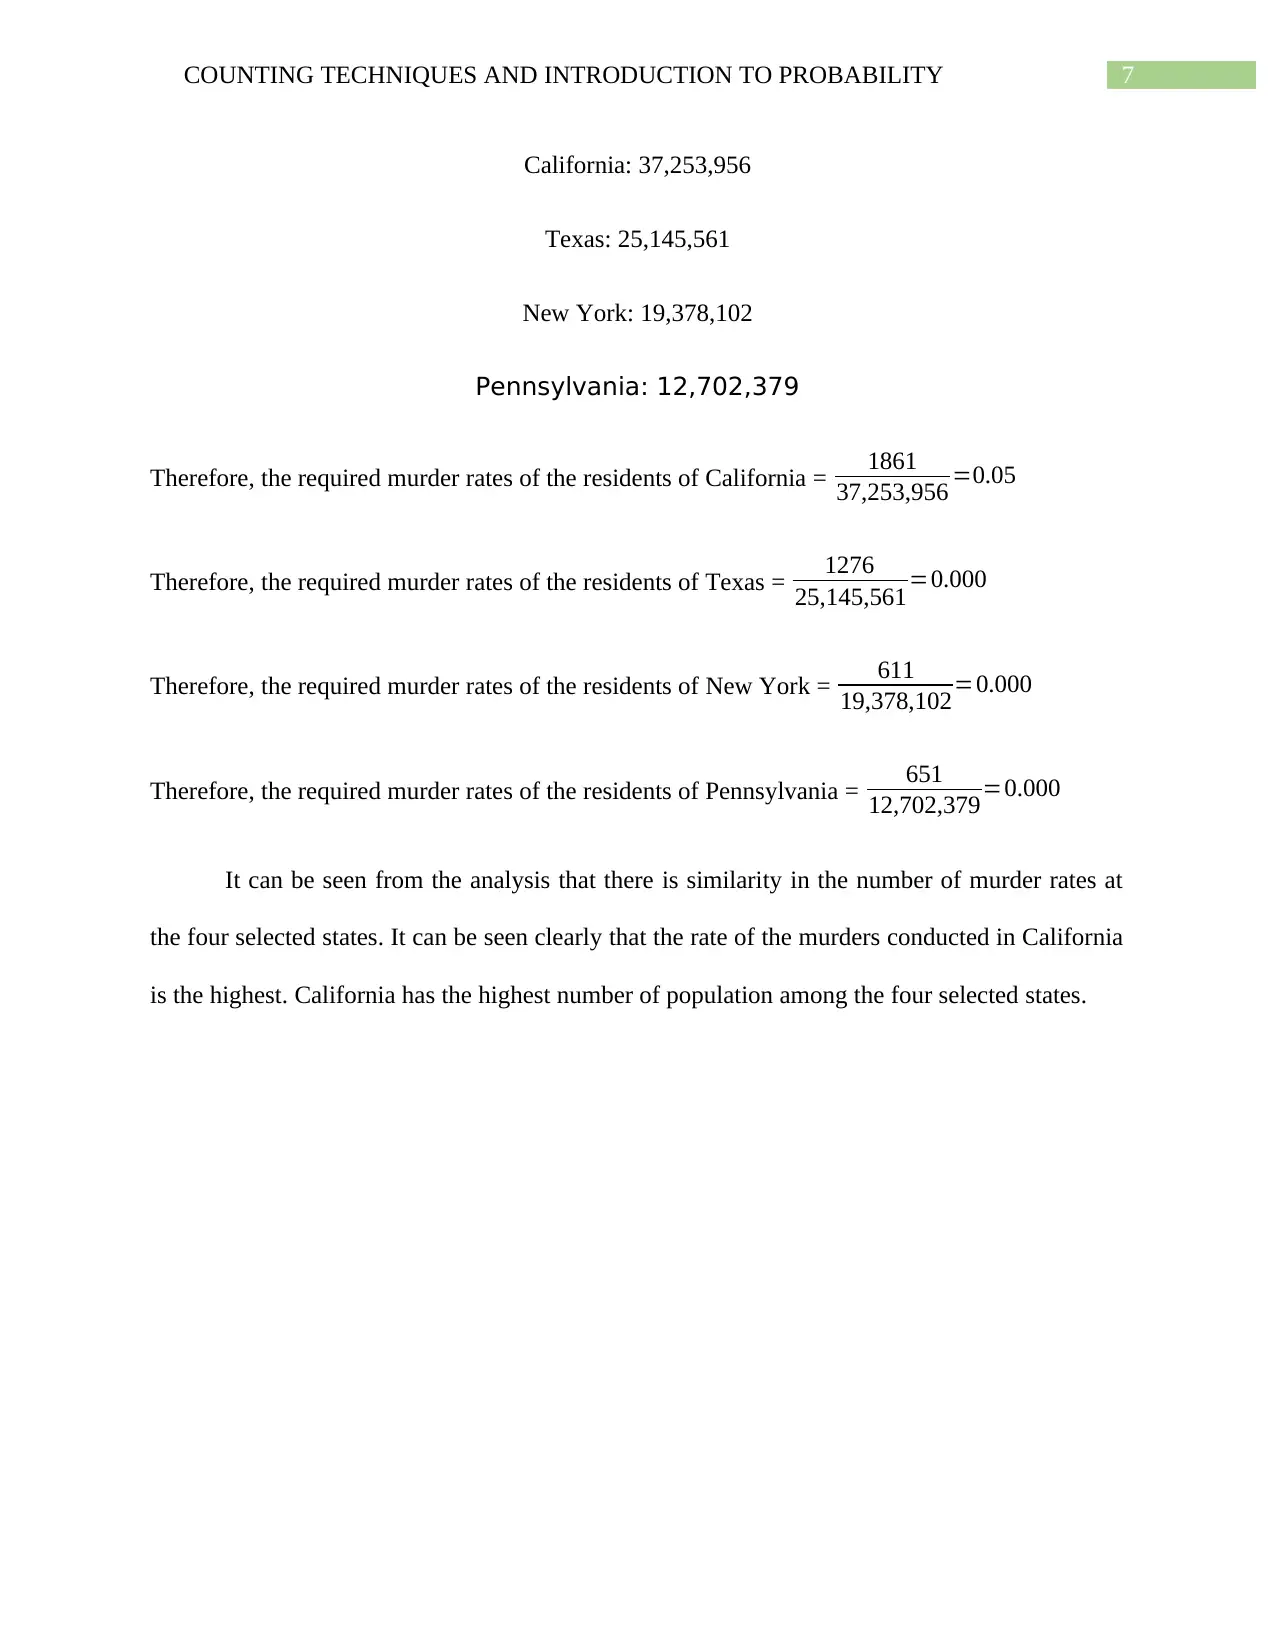
This assignment solution for MATH125 focuses on counting techniques and probability, applying these concepts to analyze murder statistics across different states. It calculates the number of ways to select states based on murder rates, considering both ordered and unordered selections. The solution also determines probabilities related to murder incidents, including those involving specific weapons like rifles and shotguns, and compares murder rates between states like California and New York. Furthermore, the assignment calculates statistical measures such as mean, median, mode, variance, and standard deviation for the top states with the highest number of murders. The analysis extends to comparing murder rates relative to state populations to assess disproportionate occurrences, providing a comprehensive overview of statistical analysis in the context of crime data. Desklib offers more solved assignments and resources for students.

Running Head: COUNTING TECHNIQUES AND INTRODUCTION TO PROBABILITY
Counting Techniques and Introduction to Probability
Name of the Student
Name of the University
Author Note
Counting Techniques and Introduction to Probability
Name of the Student
Name of the University
Author Note
Paraphrase This Document
Need a fresh take? Get an instant paraphrase of this document with our AI Paraphraser

1COUNTING TECHNIQUES AND INTRODUCTION TO PROBABILITY
Table of Contents
Answer 1..........................................................................................................................................2
Answer 2..........................................................................................................................................2
Answer 3..........................................................................................................................................3
Answer 4..........................................................................................................................................4
Answer 5..........................................................................................................................................4
Answer 6..........................................................................................................................................5
Answer 7..........................................................................................................................................5
Answer 8..........................................................................................................................................6

2COUNTING TECHNIQUES AND INTRODUCTION TO PROBABILITY
Answer 1
The number of ways in which six states can be selected from the top 11 states with the most
murders is given in the following table:
Answers
Oder is considered 332640
Order is not considered 462
The number of ways in which six states can be selected from 11 states when order is
considered can be given by the formula:
( 11 ) 6= 11!
( 11−6 ) ! =11 !
5 ! =6 × 7 ×8 × 9× 10× 11=332640
The number of ways in which six states can be selected from 11 states when order is not
considered can be given by the formula:
(11
6 )= 11 !
6 ! ( 11−6 ) ! = 11!
6 !5 ! = 6 ×7 × 8 ×9 ×10 × 11
6 ×5 × 4 ×3 × 2 =7 × 2× 3 ×11=462
Answer 2
The probability of randomly choosing four states from the top 7 murder states such that
the top for states in the United States for murders are in decreasing order is given in the
following table:
Answer
Probability 1/840
The probability of selecting the top four from the top 7 when order matters
⊘ This is a preview!⊘
Do you want full access?
Subscribe today to unlock all pages.

Trusted by 1+ million students worldwide

3COUNTING TECHNIQUES AND INTRODUCTION TO PROBABILITY
¿ 1
( 7 )4
= 1
840
Answer 3
Rank Top 20 States Total Murders
1 California 1,861
2 Texas 1,276
3 Pennsylvania 651
4 New York 611
5 Michigan 571
6 Georgia 565
7 North Carolina 506
8 Missouri 499
9 Illinois 497
10 Ohio 480
11 Louisiana 474
12 Tennessee 402
13 South Carolina 394
14 Virginia 383
15 Maryland 372
16 New Jersey 353
17 Arizona 278
18 Indiana 272
19 Wisconsin 238
20 Oklahoma 233
21 Kentucky 209
22 Washington 209
Answers
Mean 515
Median 438
Mode 209
Mean=1861+1276+ 651+ 611+ 571+565+ 506+499+ 497+ 480+474 +402+394+ 383+372+ 353+272+238+233
22
s
Paraphrase This Document
Need a fresh take? Get an instant paraphrase of this document with our AI Paraphraser

4COUNTING TECHNIQUES AND INTRODUCTION TO PROBABILITY
Median= ( 22
2 )
th
value+( 22
2 +1 )
th
value
2 = 11th value+12th value
2 = 474+ 402
2 =438
Mode = 209, as most number of cities have shown 209 murders from the top 22 cities on the
highest number of murders.
Answer 4
The variance and standard deviation of the top 22 states with the most number of murders are
given in the following table:
Answers
Variance 135365
Standard deviation 368
The variance is calculated by the formula:
Var= 1
N ∑ xi
2−x2 , where , x isthe mean
The standard deviation is given by the formula:
SD= √var
Answer 5
The required probability that a person murdered by a firearm was murdered by a rifle in
Texas is given by the following table:
Answer
Probability 0.021
In Texas,

5COUNTING TECHNIQUES AND INTRODUCTION TO PROBABILITY
Total number of persons murdered by firearms = 906
Total number of people murdered by rifles = 19
Therefore, the required probability = 19
208 =0.021
Answer 6
The required probability of a person being murdered by a rifle or a shotgun is given in the
following table:
Answer
Probability 0.061
In Texas,
Total number of persons murdered by firearms = 906
Total number of people murdered by rifles = 19
The total number of persons murdered by shotgun = 36
Therefore, the required probability = 19+36
208 =0.061
Answer 7
Comparison of the probability of the murder using a rifle in two selected states is given in the
following table:
Chosen States Probability
California 0.023
New York 0.003
Total number of persons murdered by firearms = 906
Total number of people murdered by rifles = 19
Therefore, the required probability = 19
208 =0.021
Answer 6
The required probability of a person being murdered by a rifle or a shotgun is given in the
following table:
Answer
Probability 0.061
In Texas,
Total number of persons murdered by firearms = 906
Total number of people murdered by rifles = 19
The total number of persons murdered by shotgun = 36
Therefore, the required probability = 19+36
208 =0.061
Answer 7
Comparison of the probability of the murder using a rifle in two selected states is given in the
following table:
Chosen States Probability
California 0.023
New York 0.003
⊘ This is a preview!⊘
Do you want full access?
Subscribe today to unlock all pages.

Trusted by 1+ million students worldwide

6COUNTING TECHNIQUES AND INTRODUCTION TO PROBABILITY
In California,
Total number of persons murdered by firearms = 1275
Total number of people murdered by rifles = 33
Therefore, the required probability = 33
1275 =0.023
In New York,
Total number of persons murdered by firearms = 611
Total number of people murdered by rifles = 1
Therefore, the required probability = 1
611 =0.003
The number of times more likely (rounded to the nearest thousandths) 10.21
Thus, the number of times California is more likely to murder people by murders or
weapons is:
¿ 0.0203
0.003 =10.21.
Answer 8
For California and Texas, there is no evidence for the claim that the numbers of murders in those
two cities are disproportionate though both California and Texas tops the chart for the most
number of murders.
The population of the four countries California, Texas, New York and Pennsylvania are given as
below:
Paraphrase This Document
Need a fresh take? Get an instant paraphrase of this document with our AI Paraphraser

7COUNTING TECHNIQUES AND INTRODUCTION TO PROBABILITY
California: 37,253,956
Texas: 25,145,561
New York: 19,378,102
Pennsylvania: 12,702,379
Therefore, the required murder rates of the residents of California = 1861
37,253,956 =0.05
Therefore, the required murder rates of the residents of Texas = 1276
25,145,561=0.000
Therefore, the required murder rates of the residents of New York = 611
19,378,102=0.000
Therefore, the required murder rates of the residents of Pennsylvania = 651
12,702,379=0.000
It can be seen from the analysis that there is similarity in the number of murder rates at
the four selected states. It can be seen clearly that the rate of the murders conducted in California
is the highest. California has the highest number of population among the four selected states.
1 out of 8

Your All-in-One AI-Powered Toolkit for Academic Success.
+13062052269
info@desklib.com
Available 24*7 on WhatsApp / Email
Unlock your academic potential
Copyright © 2020–2025 A2Z Services. All Rights Reserved. Developed and managed by ZUCOL.