Business Statistics Coursework: Comprehensive Statistical Analysis

Verified

Added on  2023/06/15

|11
|1402
|403
AI Summary
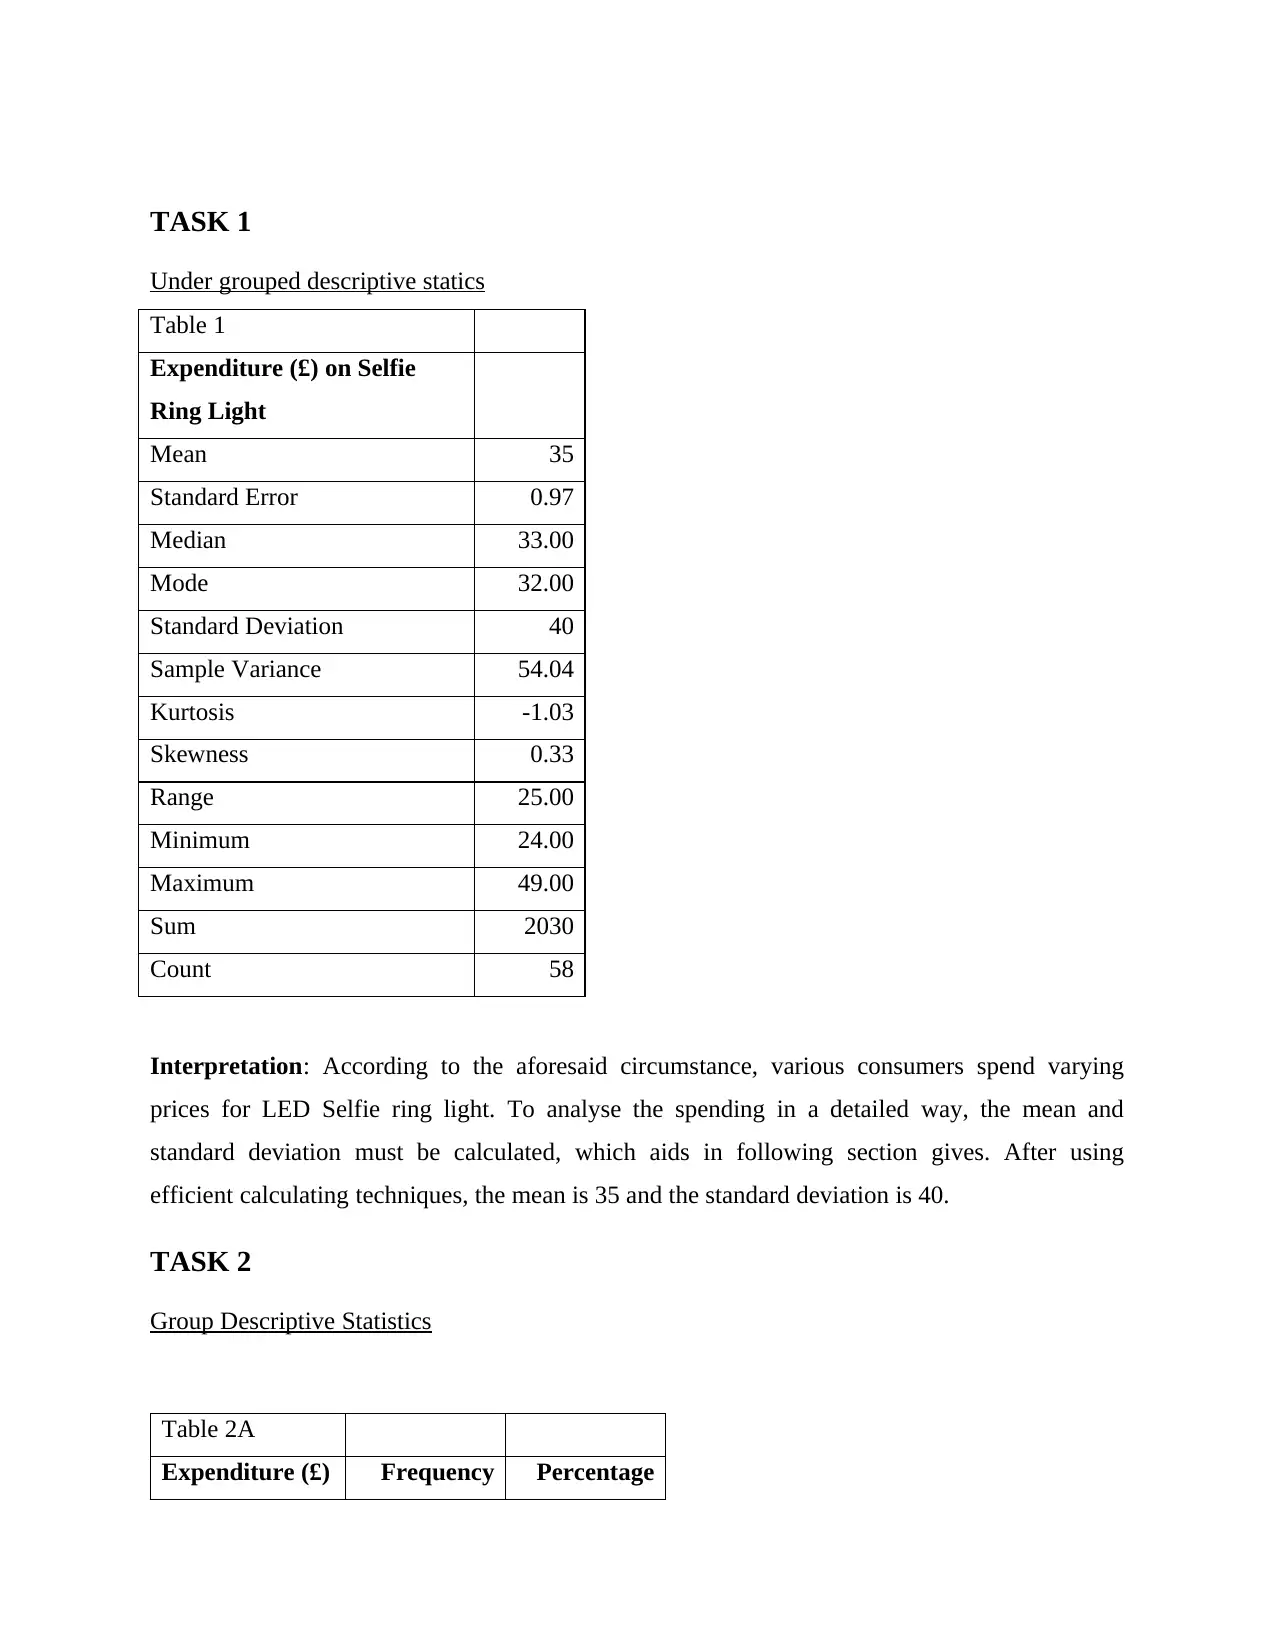
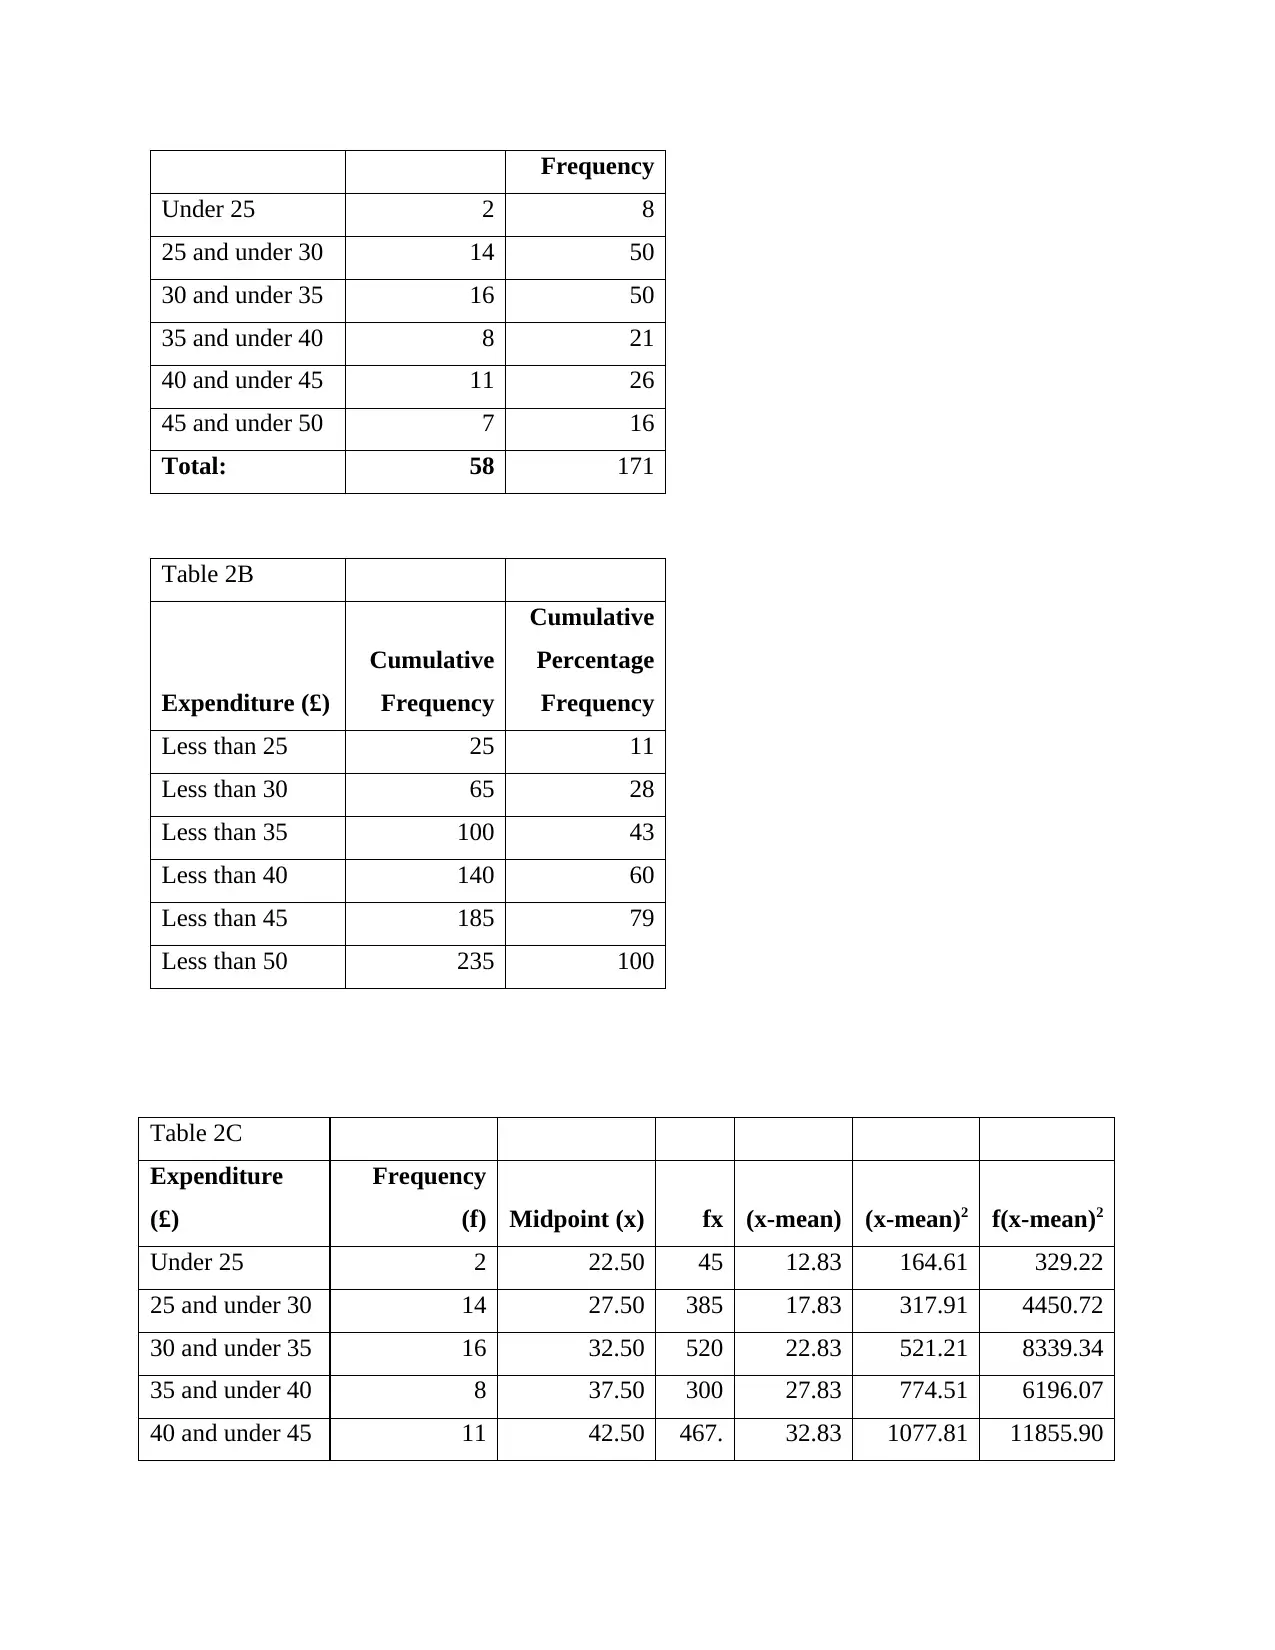
This coursework assignment is divided into two parts focusing on business statistics. The first part covers descriptive statistics, including mean, standard deviation, and frequency analysis of expenditure on selfie ring lights. It also delves into networking, probability calculations for employee types, and cost and break-even analysis. The second part explores relationships between variables, identifying the best predictor of quarterly sales revenue using correlation coefficients and regression analysis. The assignment includes scatter graphs to visualize relationships and concludes with an interpretation of the findings, emphasizing the connection between sales, costs, and profitability, and forecasting future sales revenue based on the regression model. Desklib provides access to similar assignments and study tools for students.
Document Page
Coursework 1 consists of
2 parts
tabler-icon-diamond-filled.svg

Paraphrase This Document

Need a fresh take? Get an instant paraphrase of this document with our AI Paraphraser
Document Page
Document Page
Contents
TASK 1..........................................................................................................................................................3
Under grouped descriptive statics...........................................................................................................3
TASK 2..........................................................................................................................................................3
Group Descriptive Statistics.....................................................................................................................3
TASK 3..........................................................................................................................................................5
Networking..............................................................................................................................................5
TASK 4..........................................................................................................................................................6
Probability...............................................................................................................................................6
TASK 5..........................................................................................................................................................6
Costs and Break even..............................................................................................................................6
PART 2.........................................................................................................................................................7
Relationship.............................................................................................................................................7
Identify the ‘best’ predictor of quarterly Sales Revenue.........................................................................7
Scatter graph...........................................................................................................................................8
Document Page
TASK 1
Under grouped descriptive statics
Table 1
Expenditure (£) on Selfie
Ring Light
Mean 35
Standard Error 0.97
Median 33.00
Mode 32.00
Standard Deviation 40
Sample Variance 54.04
Kurtosis -1.03
Skewness 0.33
Range 25.00
Minimum 24.00
Maximum 49.00
Sum 2030
Count 58
Interpretation: According to the aforesaid circumstance, various consumers spend varying
prices for LED Selfie ring light. To analyse the spending in a detailed way, the mean and
standard deviation must be calculated, which aids in following section gives. After using
efficient calculating techniques, the mean is 35 and the standard deviation is 40.
TASK 2
Group Descriptive Statistics
Table 2A
Expenditure (£) Frequency Percentage
tabler-icon-diamond-filled.svg

Paraphrase This Document

Need a fresh take? Get an instant paraphrase of this document with our AI Paraphraser
Document Page
Frequency
Under 25 2 8
25 and under 30 14 50
30 and under 35 16 50
35 and under 40 8 21
40 and under 45 11 26
45 and under 50 7 16
Total: 58 171
Table 2B
Expenditure (£)
Cumulative
Frequency
Cumulative
Percentage
Frequency
Less than 25 25 11
Less than 30 65 28
Less than 35 100 43
Less than 40 140 60
Less than 45 185 79
Less than 50 235 100
Table 2C
Expenditure
(£)
Frequency
(f) Midpoint (x) fx (x-mean) (x-mean)2 f(x-mean)2
Under 25 2 22.50 45 12.83 164.61 329.22
25 and under 30 14 27.50 385 17.83 317.91 4450.72
30 and under 35 16 32.50 520 22.83 521.21 8339.34
35 and under 40 8 37.50 300 27.83 774.51 6196.07
40 and under 45 11 42.50 467. 32.83 1077.81 11855.90
Document Page
5
45 and under 50 7 47.50
332.
5 37.83 1431.11 10017.76
Total: 58
Report 1: The benefit of preparing table 2A is that it allows you to reveal the actual proportion of
expenditures paid by the client in relation to the brand. It aids in the examination of efficiency by
comparing expenditures.
Report 2: The main advantage of using cumulative % over probability as a measure of numbers
and percentages is that it allows you to assess groups of data. The vertical axis scale is the sole
variation between the likelihood and cumulative charts.
Report 3: The mean value and standard deviation change between tasks 1 and 2, with task 1
being more precise since it is calculated using specific values.
TASK 3
Networking
Document Page
(2) Figure 1 shows how the above network design was created using orange and blue arrows.
According to Figure 2, the critical route to accomplish the work in the least amount of time is
124590102122. The shortest time to finish all events for the event is 16 weeks and 4 days.
(3) Particular work starting and finishing timeframes must be ensure adherence to. They are
critical in the sense that their absence leads the entire operation to be postponed. To a certain
extent, the start of non-critical tasks can be deliberately decided. In many undertakings, the issue
of establishing the start of a non-critical activity develops. Most of the time, the "as soon as
possible" or "as late as practical" recommendations may be followed. However, in other
situations, the decision of this choice is impacted by external variables like the exchange rate.
TASK 4
Probability
1.
Male Female
Part time employee 6 12
Full time employee 34 48
40 60
tabler-icon-diamond-filled.svg

Paraphrase This Document

Need a fresh take? Get an instant paraphrase of this document with our AI Paraphraser
Document Page
2.
The probability of choosing male and working full time is as follows-
40/ 100 * 34/ 40
= 34/100
= 0.34
This implies that there are 0.34 chances that on selecting randomly the male who is working full
time will be selected.
TASK 5
Costs and Break even
Variable cost
High low method
Highest activity cost – lowest activity cost / Highest activity unit -Lowest
activity units
7
Highest activity
cost 360000
Highest activity
unit 42000
Lowest activity
cost 150000
Lowest activity
unit 12000
Fixed cost
Fixed cost
Highest activity cost - (variable cost per unit* Highest activity
units)
66000
Variable cost per unit 7
Highest activity cost 360000
Highest activity unit 42000
Lowest activity cost 150000
Document Page
Lowest activity unit 12000
BEP
Particulars Formula Amount
selling price per unit 10
less: VC per unit 7
Contribution Selling price- VC 3
FC 66000
BEP (units) Fixed cost/ contribution 22000
BEP (rupees) 220000
With the analysis of the calculation it is clear that the BEP production units for company
is 22000. This implies that in case the production is 22000 units then the company will be in no
profit no loss situation. Once the company will start producing beyond this level then the
company will start earning profits.
PART 2
Relationship
Coefficient matrix
Column
1
Column
2
Column
3
Column
4
Column
1 1
Column
2
0.87150
4 1
Column
3
0.99761
8
0.87379
8 1
Column
4
0.49984
2
0.01088
2
0.4909
3 1
Identify the ‘best’ predictor of quarterly Sales Revenue
An excellent prediction is a factor with the highest correlation. They may also evaluate
coefficients to determine which prediction is the best (Assure they have normalised the data
Document Page
before they present regression and take absolute value of coefficients) they may also examine the
increase in R-squared number.
They need to standardise the covariance so that they can help understand and apply it in
predicting, which leads to the correlation computation. The correlation computation essentially
multiplies the correlation by the sum of two values' standard deviations. This will link the
association between -1 and +1 values.
Scatter graph
0 2 4 6 8 10 12
0
2
4
6
8
10
12
f(x) = NaN x + NaN
R² = 0 Sales Revenue (£'000)
4.
The correlation of coefficient states that the relation between the variables is very low that is
6.41 and this implies that the working of the sales revenue is not at all dependent over the
working of average order value.
5.
The regression equation is y= 6.4292x + 498.92
From this equation the gradient is 6.492 and the intercept is 498.92.
6.
tabler-icon-diamond-filled.svg

Paraphrase This Document

Need a fresh take? Get an instant paraphrase of this document with our AI Paraphraser
Document Page
When x = 100
Y= 6.4292 (100) + 498.92
Y= 642.92 + 498.92
Y= 1141.84
7.
Introduction
The detection of the relationship between two or more independent variables is known to as
correlation. It is critical for the individual to be able to quickly determine the relationship
between the two factors.
The comparative analysis shows that there is a significant connection between sales and total
cost and average order value, but a poor correlation between sales and net profit. Furthermore,
the overall cost is quite minimal when compared to the net income.
Furthermore, the scatter graph diagram aided in analysing the fact that the operating cash flow is
shifting. The reason for this is because if sales revenue does not increase, it will have an adverse
effect on the profits of the business.
Furthermore, the correlation matrix provided the evidence that the correlation coefficient is low,
implying that adjustments in the independent components will result in little changes in the
dependant variable.
Furthermore, the regression may be used to determine whether there is a significant relationship
between two or more variables. As a result, the regression model developed was y= 6.4292x +
498.92.
With the use of the regression equation, it was determined that the next quarter's sales revenue
will be 1141.84. This forecast is reliable since the current profit is 691, and if the product given
by the firm is good, sales may be increased to 1141.84.
chevron_up_icon
1 out of 11
circle_padding
hide_on_mobile
zoom_out_icon
[object Object]