Statistics and Probability Homework - Covariance and Hypothesis
VerifiedAdded on 2023/04/26
|9
|1713
|255
Homework Assignment
AI Summary
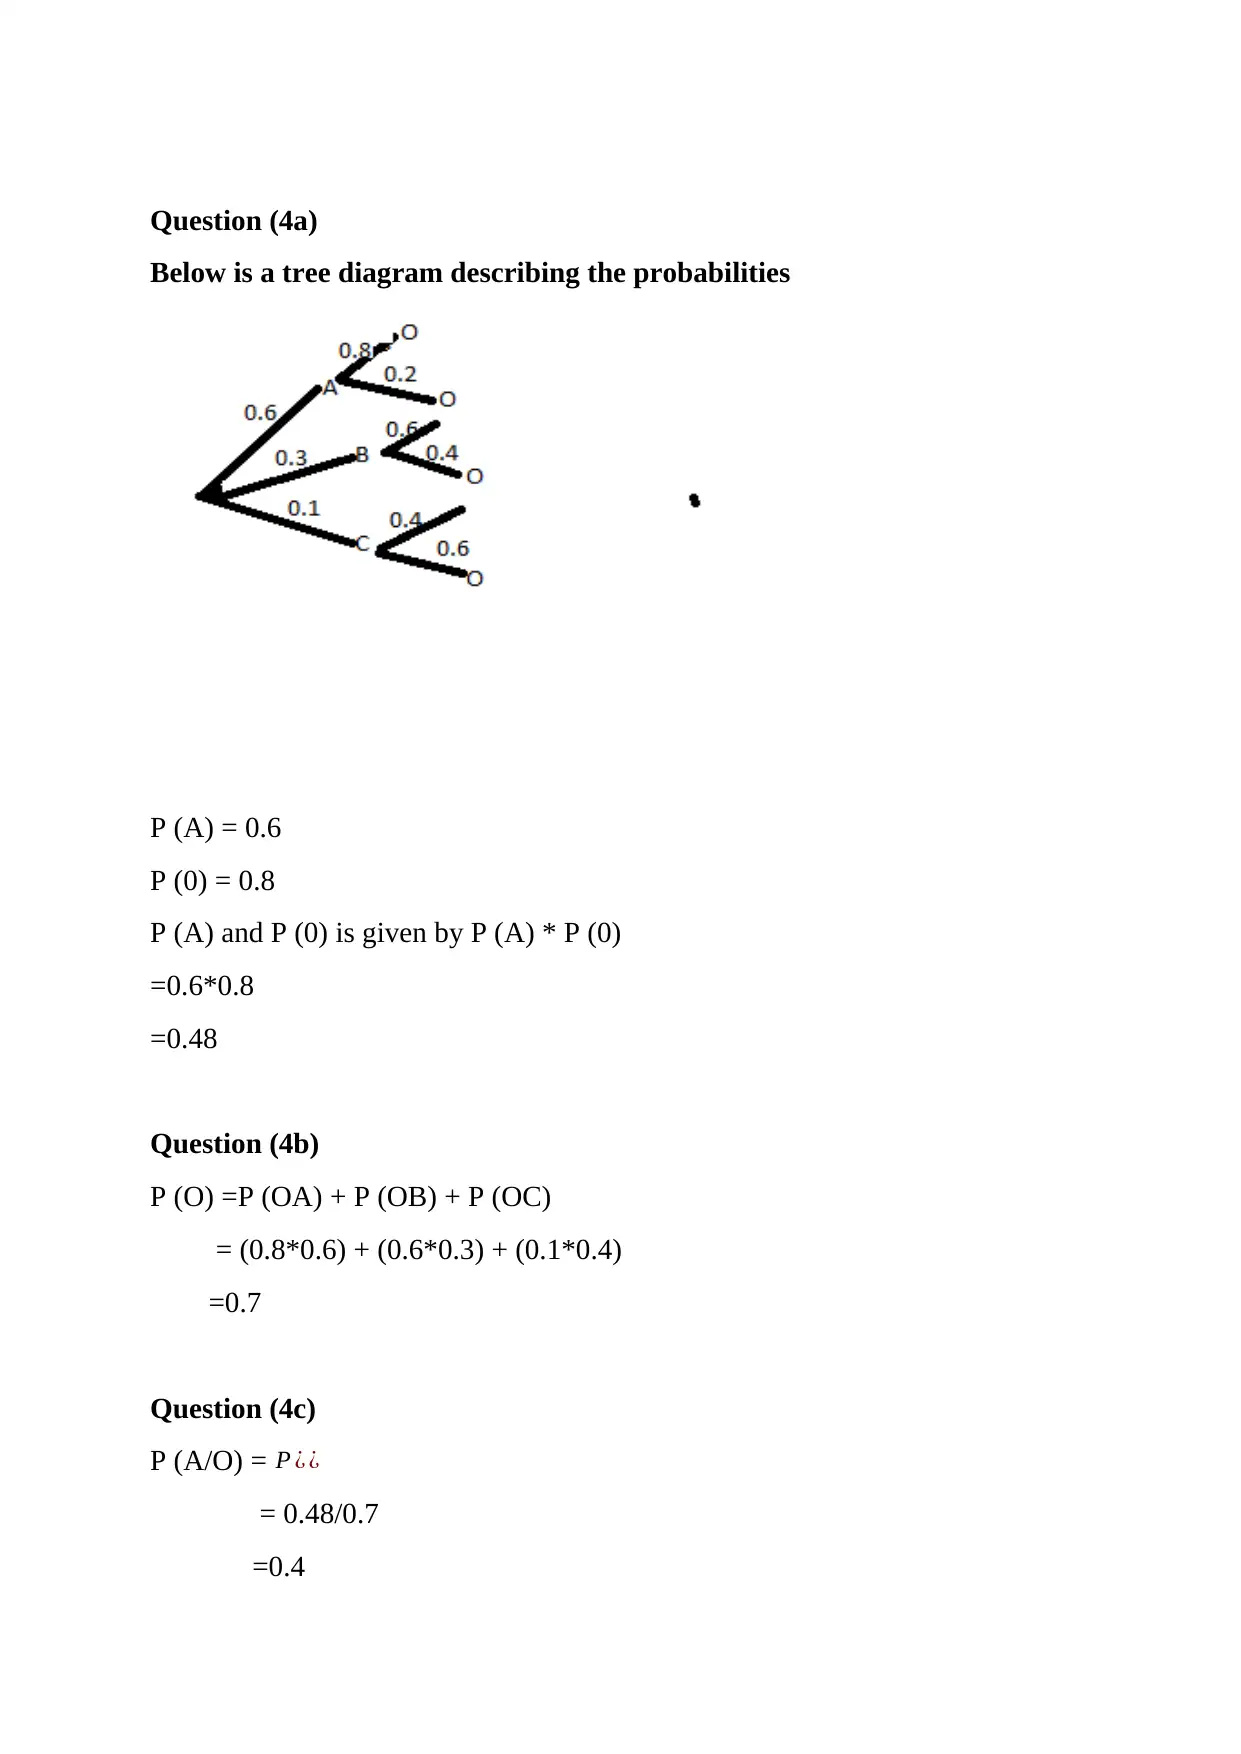
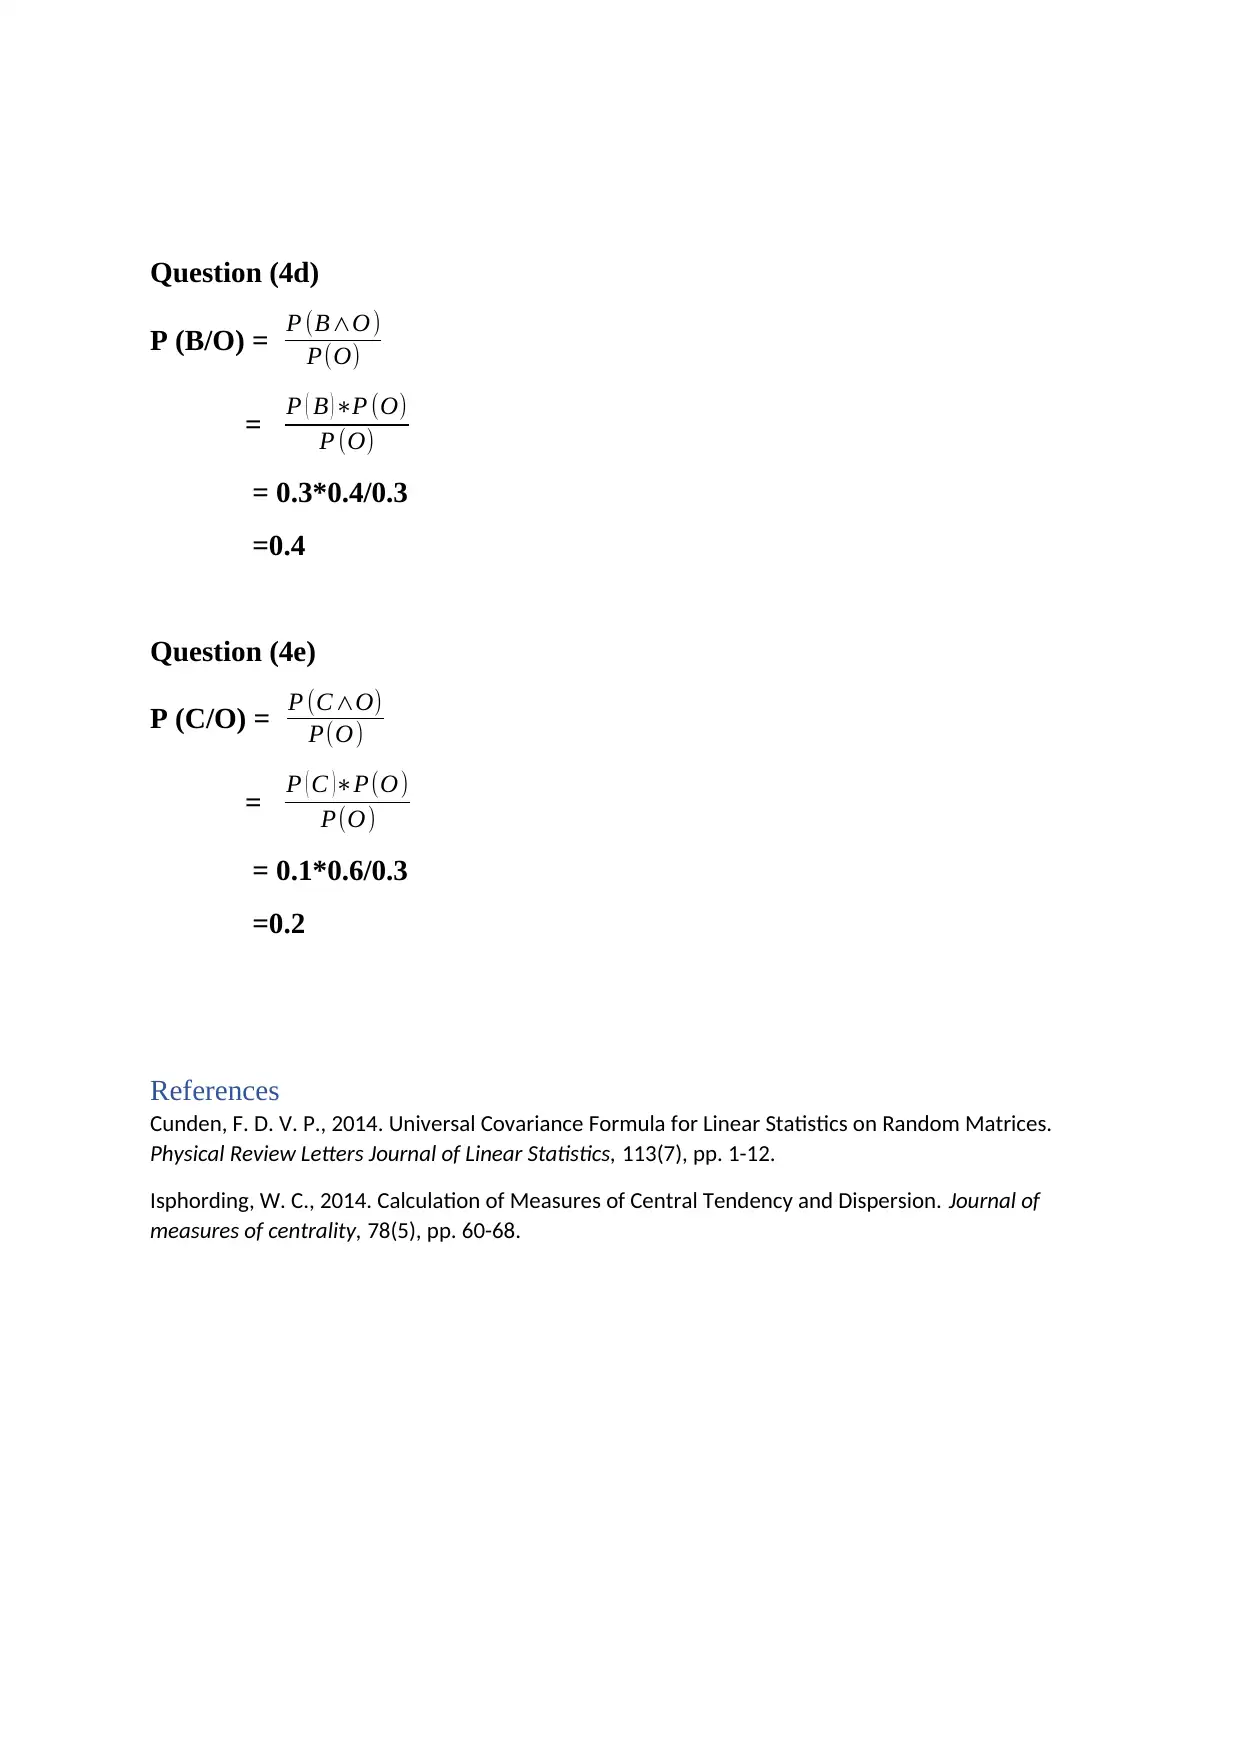
This homework assignment presents a comprehensive analysis of statistical concepts. It begins with calculating covariance and correlation coefficients between two variables, interpreting their relationship, and discussing the implications of negative correlation. The assignment then delves into hypothesis testing, formulating null and alternative hypotheses, calculating test statistics, and constructing confidence intervals to assess the validity of a claim. Further, the solution explores measures of central tendency (mean, median, and mode), their agreement, and the impact of outliers. Finally, it concludes with probability calculations using a tree diagram to determine conditional probabilities. The assignment uses real-world data and provides detailed calculations and interpretations, referencing relevant statistical concepts and formulas.
1 out of 9
Related Documents


Your All-in-One AI-Powered Toolkit for Academic Success.
+13062052269
info@desklib.com
Available 24*7 on WhatsApp / Email
![[object Object]](/_next/static/media/star-bottom.7253800d.svg)
Copyright © 2020–2026 A2Z Services. All Rights Reserved. Developed and managed by ZUCOL.