Impact of COVID-19 on Mental Health of UK Students: A Quantitative Research Study
VerifiedAdded on 2023/06/10
|46
|6264
|465
AI Summary
This study evaluates the impact of COVID-19 on the mental health of UK students. The study uses quantitative research methods to analyze the data collected through a questionnaire. The findings suggest that COVID-19 has negatively affected the mental health of students, and the government needs to take steps to reduce the mental burden on students.
Contribute Materials
Your contribution can guide someone’s learning journey. Share your
documents today.
LC572 Quantitative Research
Methods for Social Scientists
Methods for Social Scientists
Secure Best Marks with AI Grader
Need help grading? Try our AI Grader for instant feedback on your assignments.
ABSTRACT
With the present study it is clear that the business and other institute has been affected
with the pandemic a great extent. this is pertaining to the fact that when the pandemic occurred
then at that time there was economic shutdown and people were not allowed to travel. Also the
students were not allowed to go to school but then also the online classes were going on which
was not liked by the students. Hence, as a result of this the students were in much pain ad this
affected the mental status of the child to an extent. the finding evaluated that the major people
belonging to the age group of 16- 20 were present and both were equally divided that is 10 males
and 10 females.
TABLE OF CONTENTS
INTRODUCTION...........................................................................................................................4
Background.................................................................................................................................4
Aim and objectives......................................................................................................................4
Rationale.....................................................................................................................................4
Literature review.........................................................................................................................4
RESEARCH METHODS................................................................................................................5
Methods.......................................................................................................................................5
Sampling.....................................................................................................................................5
Research process.........................................................................................................................5
Ethical consideration...................................................................................................................6
Reflexivity...................................................................................................................................6
FINDINGS.......................................................................................................................................6
DISCUSSION..................................................................................................................................7
CONCLUSION................................................................................................................................7
REFERENCES................................................................................................................................9
APPENDIX 1.................................................................................................................................10
APPENDIX 2.................................................................................................................................22
APPENDIX 3.................................................................................................................................44
INTRODUCTION
Background
The current pandemic situation has affected the mental status and health of the person to
a great extent. This pandemic has affected to the life of students for the effective learning. this is
particularly because of the reason that because of pandemic the schools were shut down and
student were not allowed to go. Hence, this resulted in the student not going to school and
attending the online classes.
Aim and objectives
Aim
“To assess the impact of pandemic over the mental health of people. A study on UK student.”
Objectives
To develop understanding relating to COVID and its impact.
To evaluate the impact which pandemic has created on the efficiency and learning of
student.
To examine the different challenges being faced by the student due to online teaching.
To recommend some of the ways in which these challenges can be overcame.
Rationale
The pandemic is the most recent change which has been implemented within the external
environment. This is because of the reason that pandemic has affected to each and every person
whether they are young, old, teenage or any other age group. Hence, this COVID has affected the
student life to a great extent and there was increase in the mental issue relating to students. Thus,
this is the reason for the selection of pandemic and its impact over the mental condition of the
students.
Literature review
In the views of Copeland and et.al., (2021) the current pandemic has affected the business
and academic working environment to a great extent. This is pertaining to the fact that when the
working of the business and academic world is being done in external environment. When the
external environment is not cordial then it implies that it will be affected to a great extent.
On the other side, Grubic, Badovinac and Johri (2020) states that the working efficiency
of the student and the mental well- being is also affected to a great extent because of the
Secure Best Marks with AI Grader
Need help grading? Try our AI Grader for instant feedback on your assignments.
pandemic. The reason underlying this fact is that the pandemic resulted in economic shut down
and no one was allowed to travel to other places. Hence, this is because of the reason that when
the students were not allowed to go and online teaching was provided to them. This demotivated
the students and were not liking to stay home and study.
In against of this Liu and et.al., (2020) while studying at home the students were not
feeling good and happy. This locked up in home resulted in development of irritation and
clinginess among them. By staying at home they became very irritated and also were not feeling
happy while studying online.
Along with this in support of this Shepherd and et.al., (2021) stated that isolation was the
major reason for which students were not liking to live at home and attend online classes. The
reason underlying this fact was that for attending the class online the people were blocked at
home and were isolated. Hence, with this it is clear that the working of the student and being
isolated has affected the mental status of the student to a great extent.
RESEARCH METHODS
Methods
The methods refer to as the ways through which the whole research can be completed in
proper and effective manner. This is very necessary for the reason that when the method selected
for the study will not be appropriate then proper analysis will not be done. Hence, for this the use
of quantitative research is being implemented in order to evaluate that how COVID has affected
students mentally.
Sampling
The sample selected for the present case is 20 which involves 10 males and 10 female
student. This sample is being selected on the basis of the random sampling method.
Research process
The process of research is being defined as the way through which the research is
completed and the objectives of study are attained. In the present case of impact of pandemic
over mental health of student the data is being gathered with help of the questionnaire and then
the statistical tools and techniques are being used in order to analyse the data (Zhu, Sari and Lee,
2018). These tools are being applied with help of the use of SPSS and this will be assisting the
researcher in attaining aim and objectives of business.
Ethical consideration
For the study to be completed in successful manner the ethical aspect need to be managed
in proper and effective manner. For this present study all the data gathered is latest and from the
reliable sources only (Liamputtong, 2020). Also no personal information is being used within the
study or any other information which can harm the working of the study.
Reflexivity
In the present study I have undertaken the step of data analysis with help of SPSS. This is
being selected for the reason that I am good in using SPSS software and this was helpful in
completing the study in better and effective manner.
FINDINGS
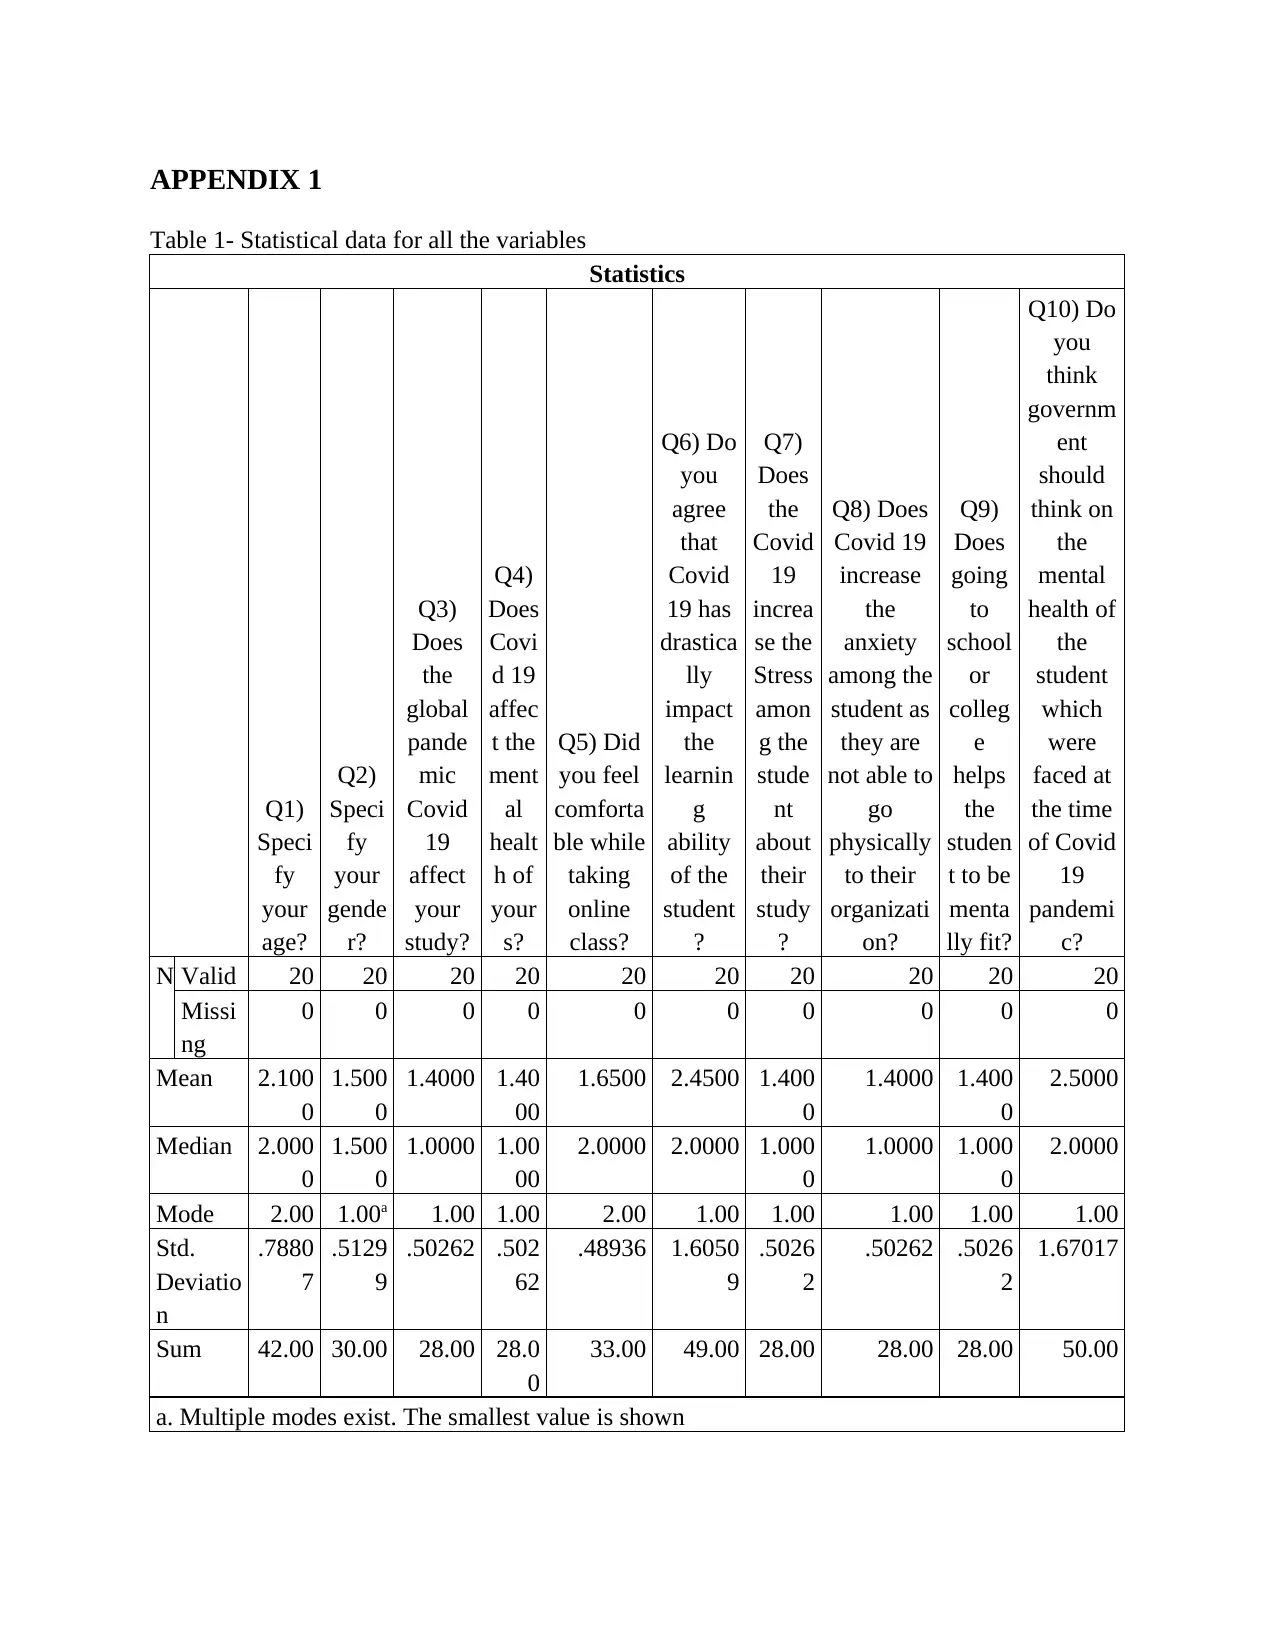
Descriptive statistics
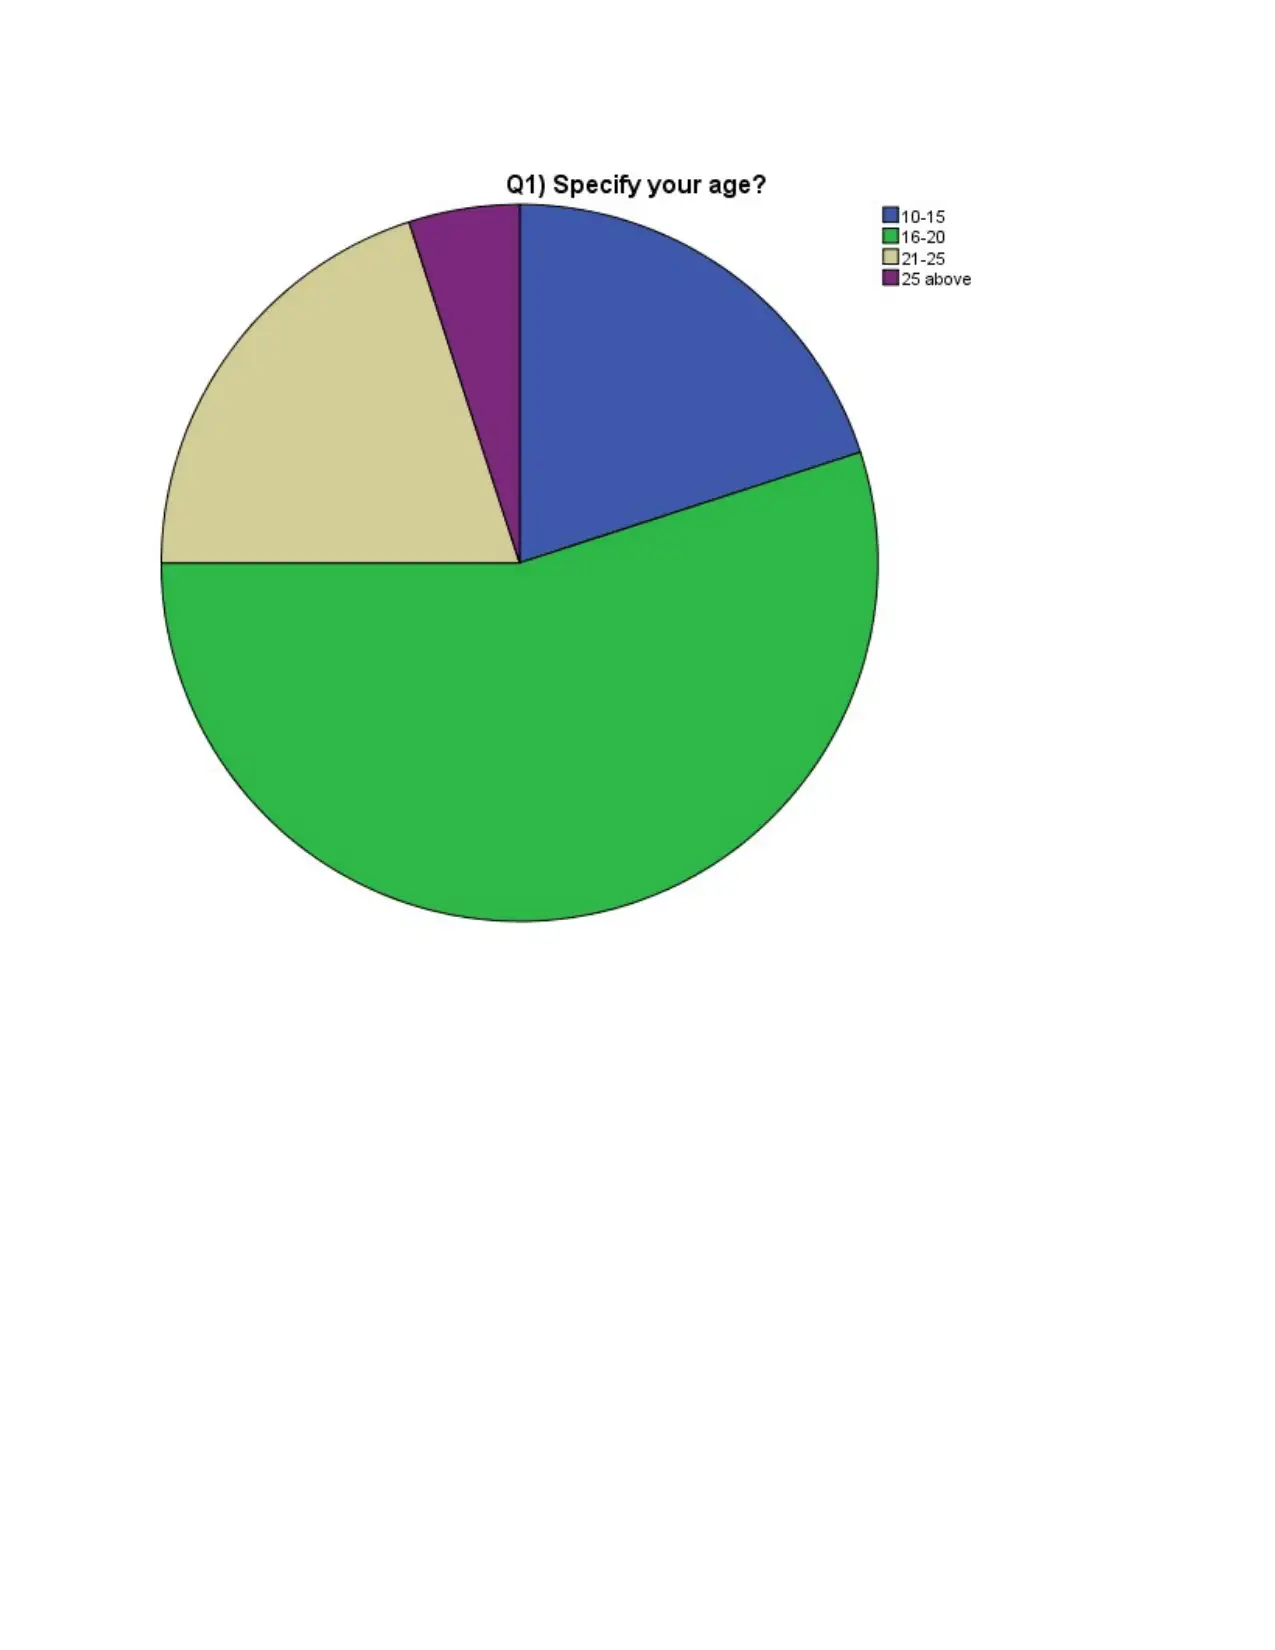
With the help of the finding from table 1 it is clear that on an average the majority of the
participant belongs to the age category of 16- 20. This simply implies that the majority of the
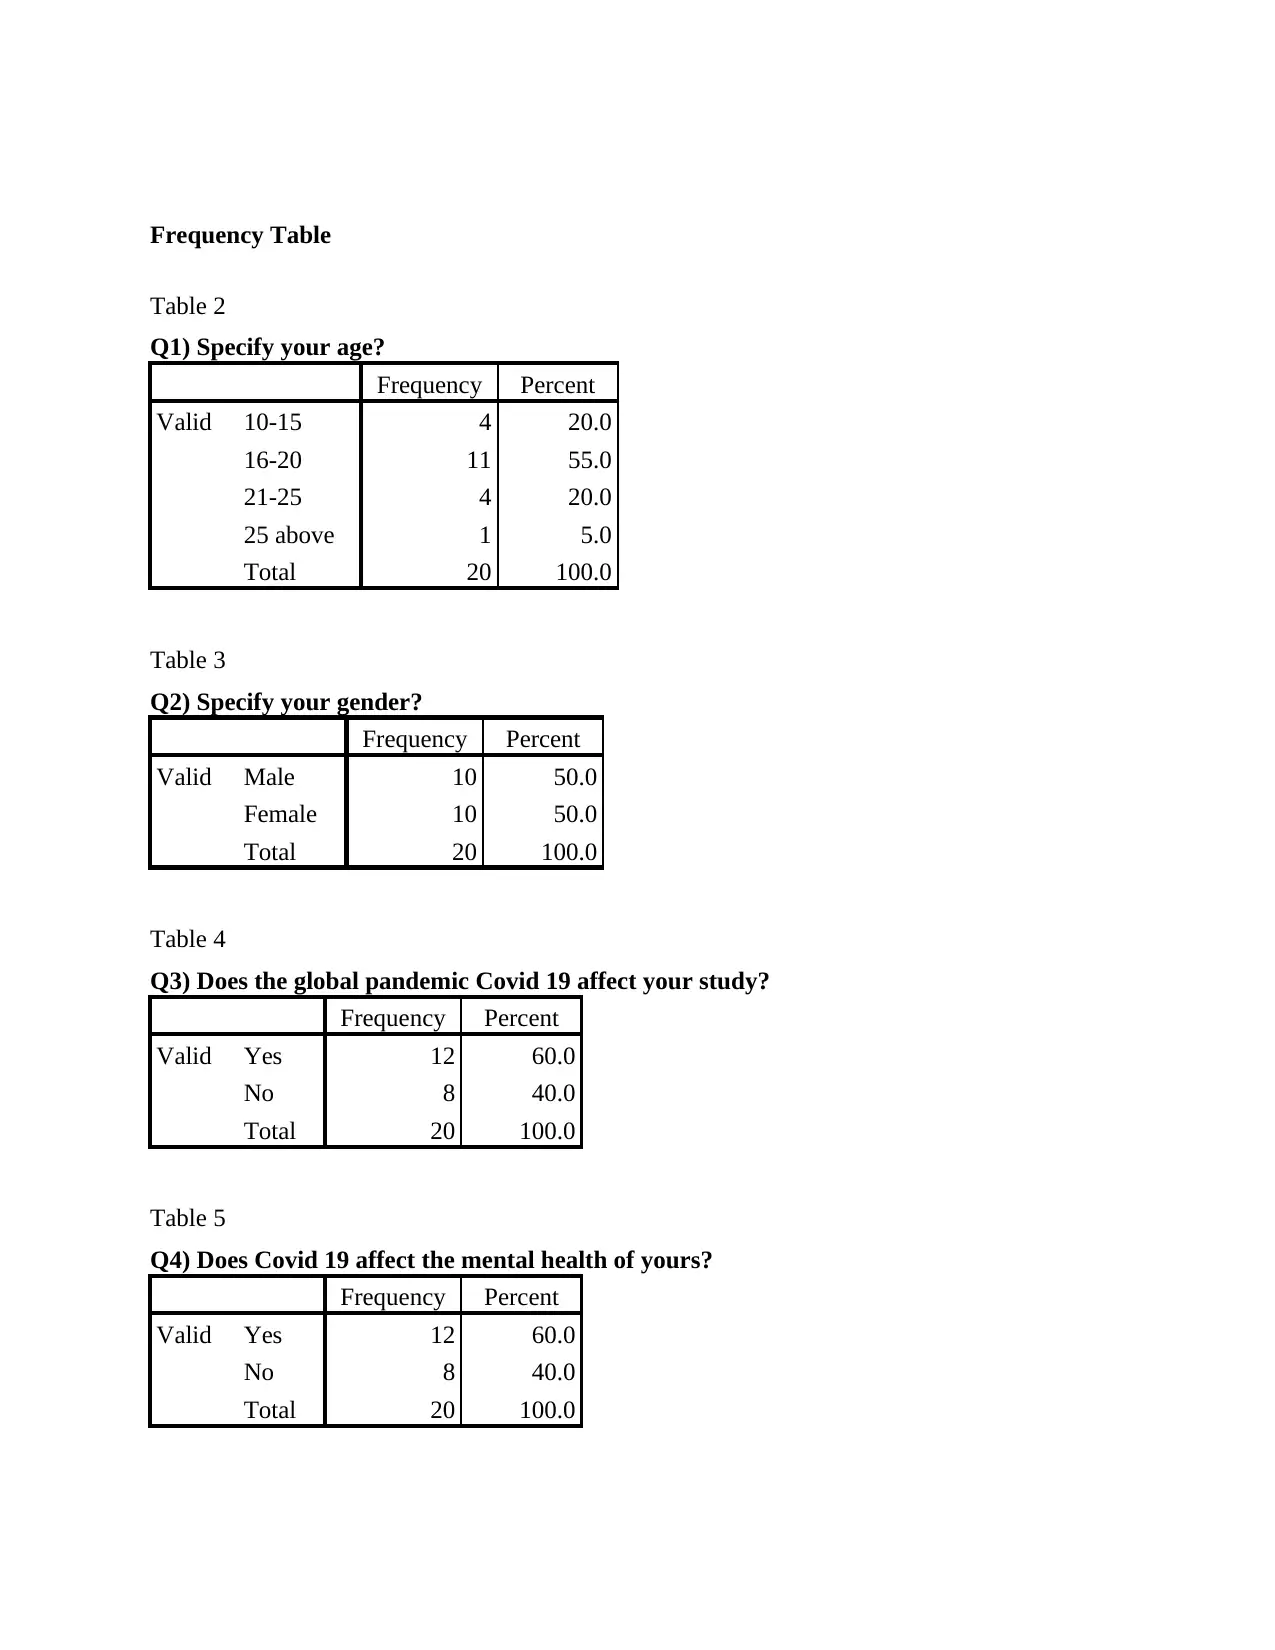
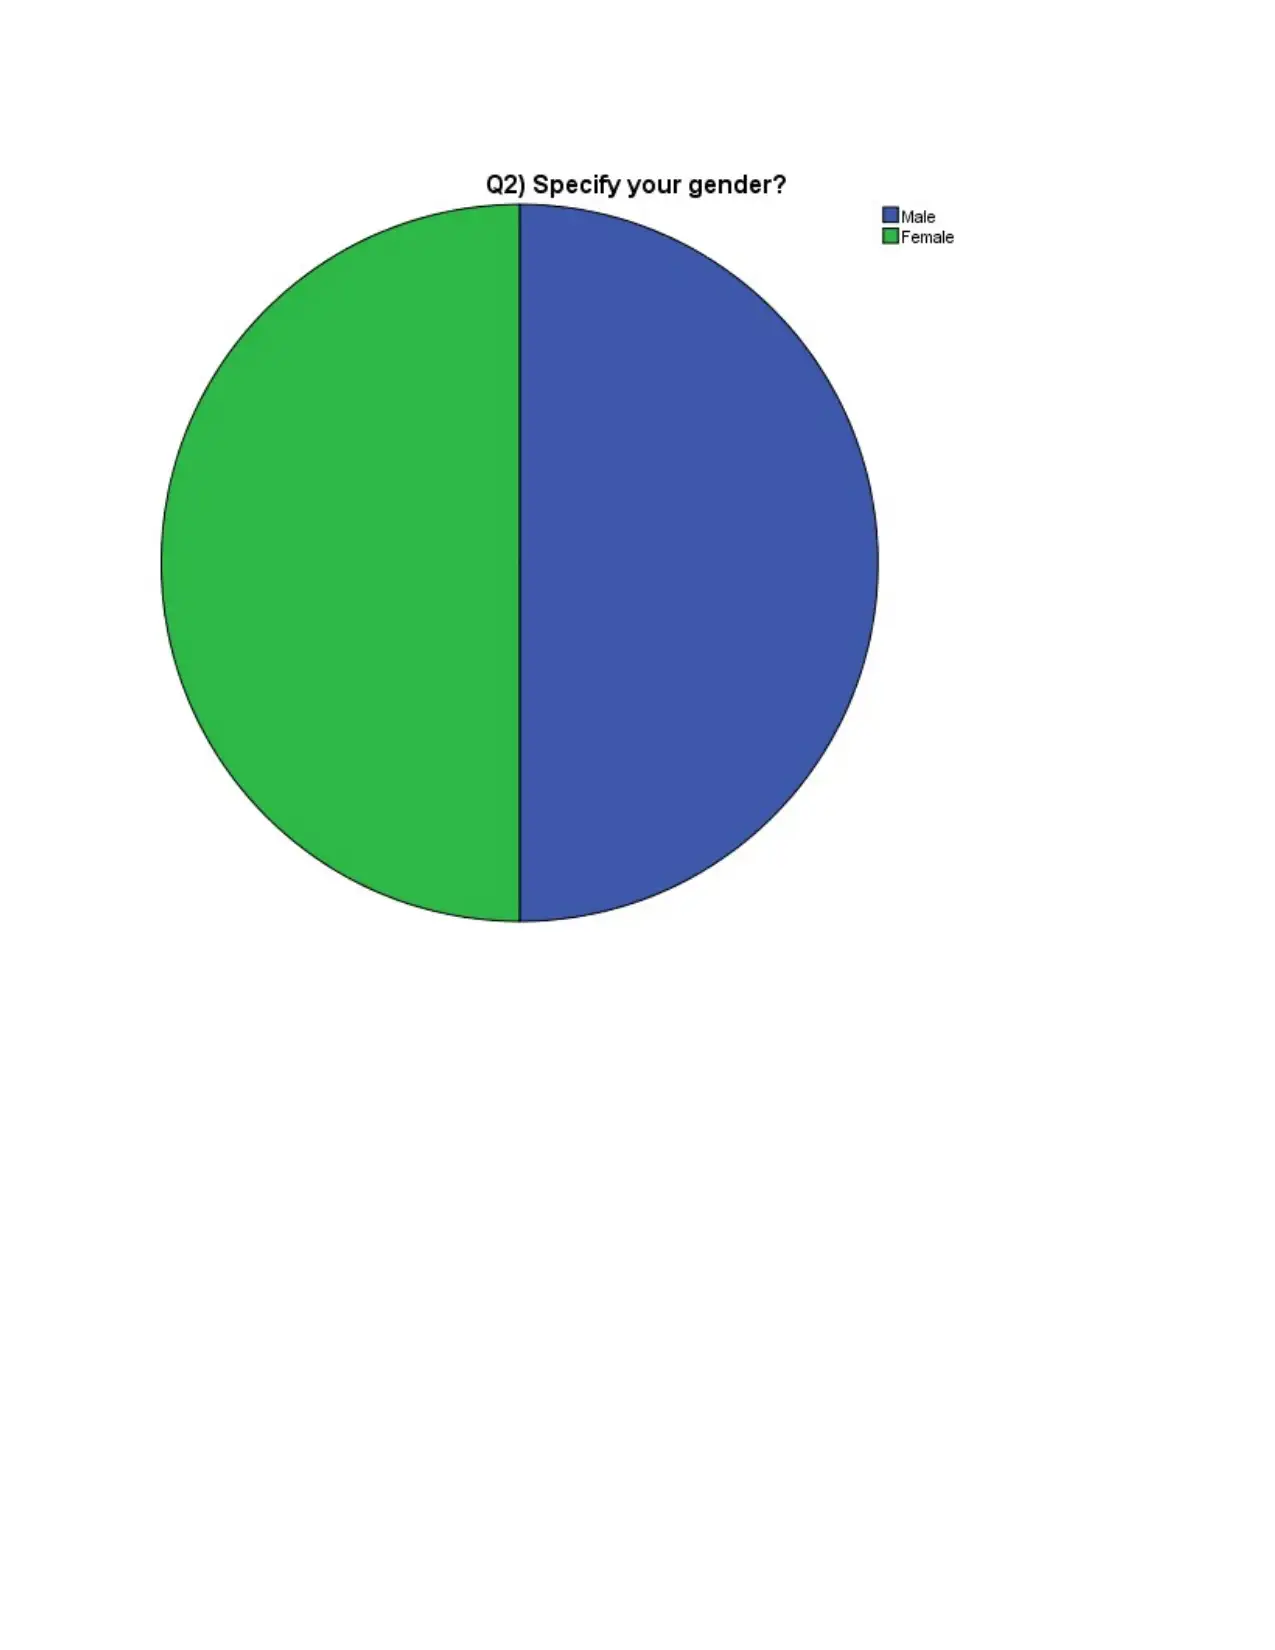
people belong to this age category. Along with this table 3 outlined that from all the participants
the gender distribution is equal that is 10 are male and 10 females. Thus, this provides the clear
representation of the population as it is equally divided within the working of the total sample.
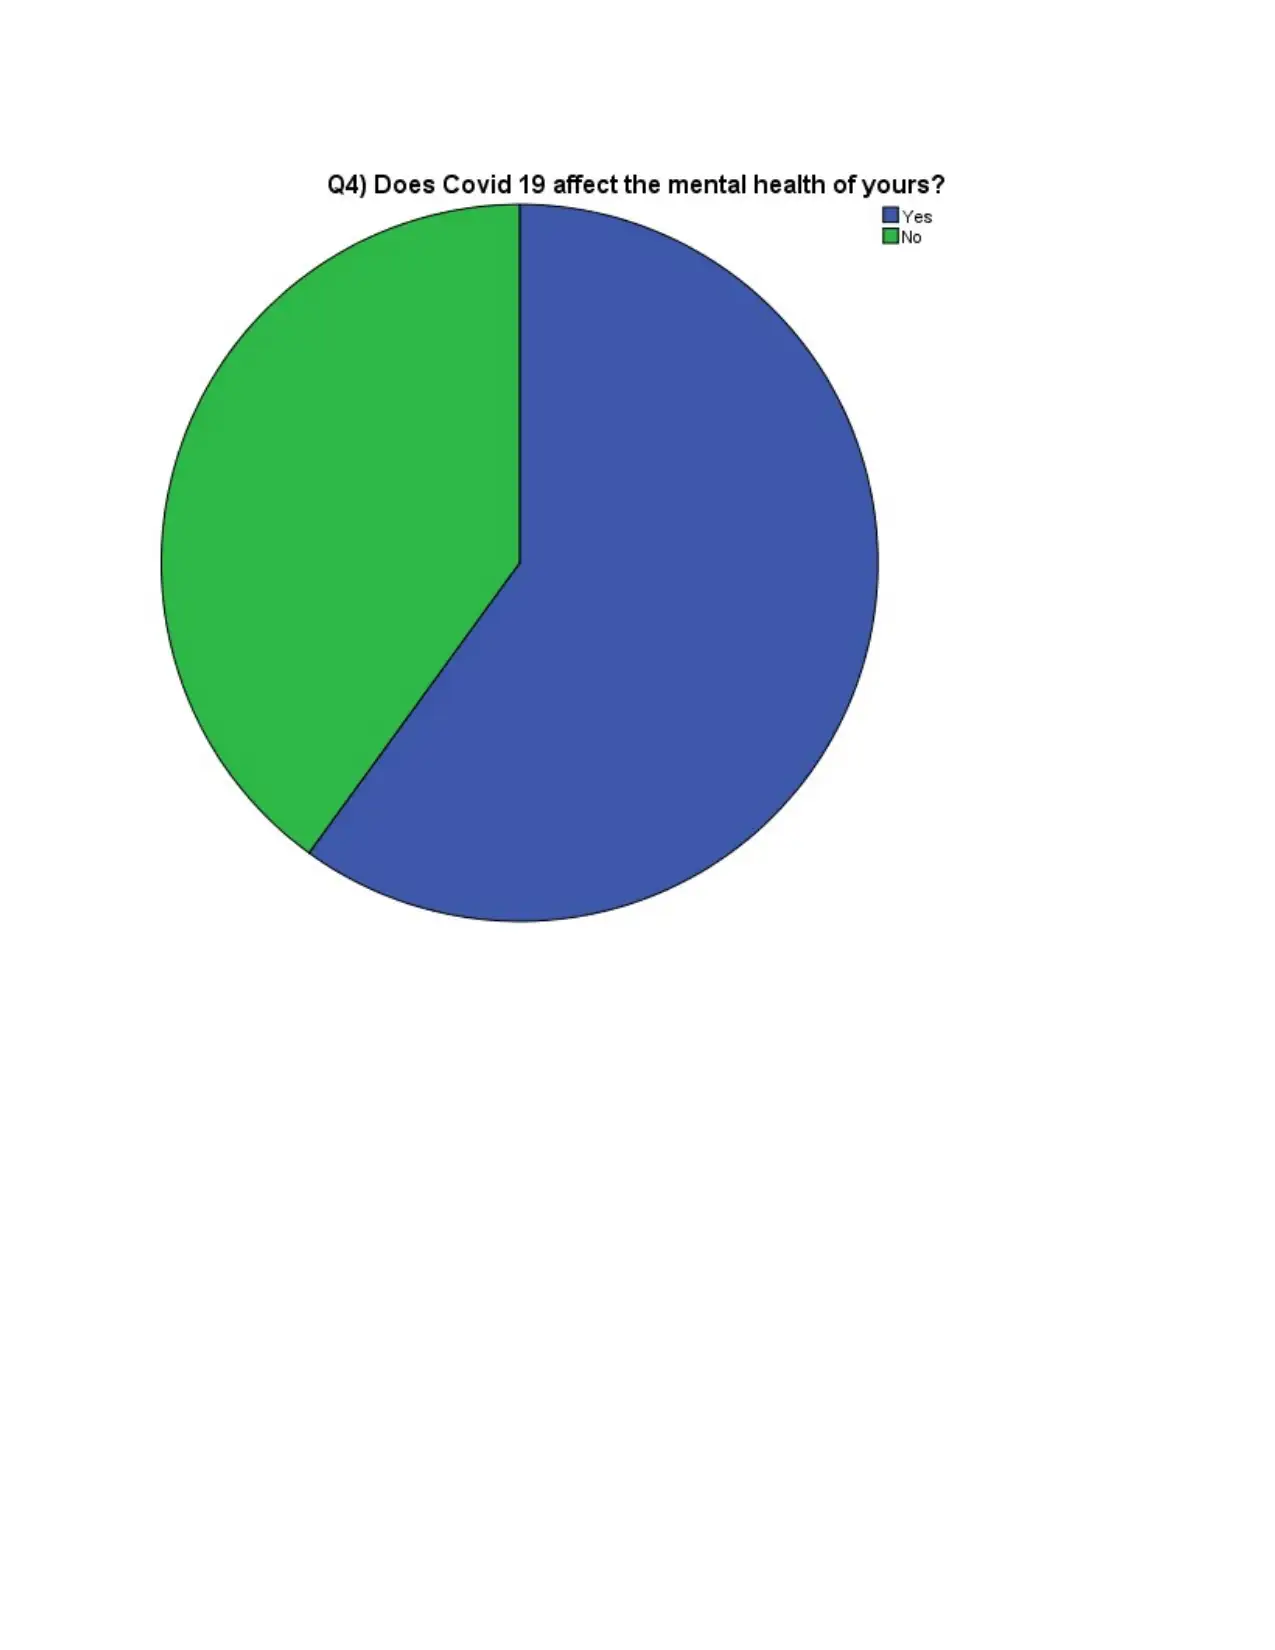
Moreover, with help of table 5 it is also evident that COVID 19 has affected the mental health of
the students. This is pertaining to the fact that when the students were having online classes then
at that time they were isolated within home and this affected the mental health of the person to a
great extent.
Cross tabulation
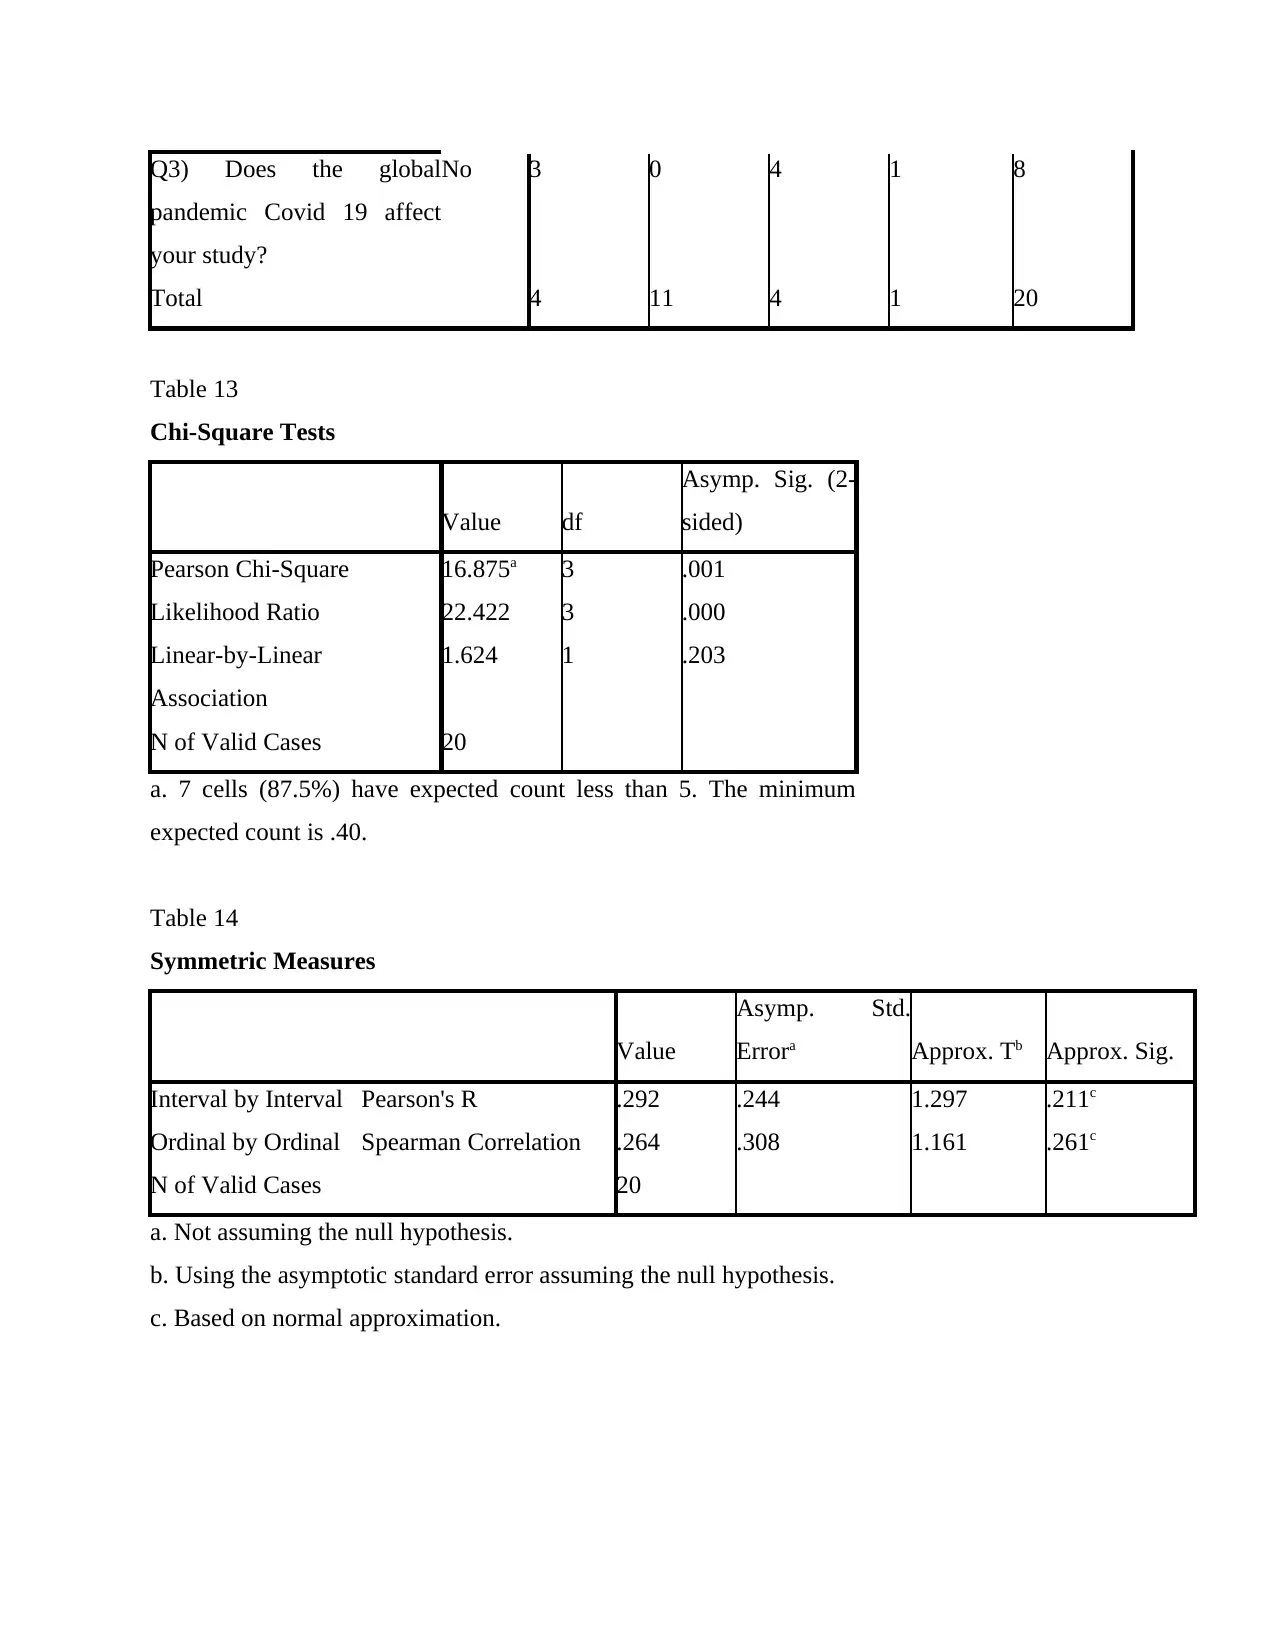
With respect to cross tabulation, the table 13 highlights that the significance value is
0.001 which is less than the standard that is 0.05. this simply means that on the basis of age,
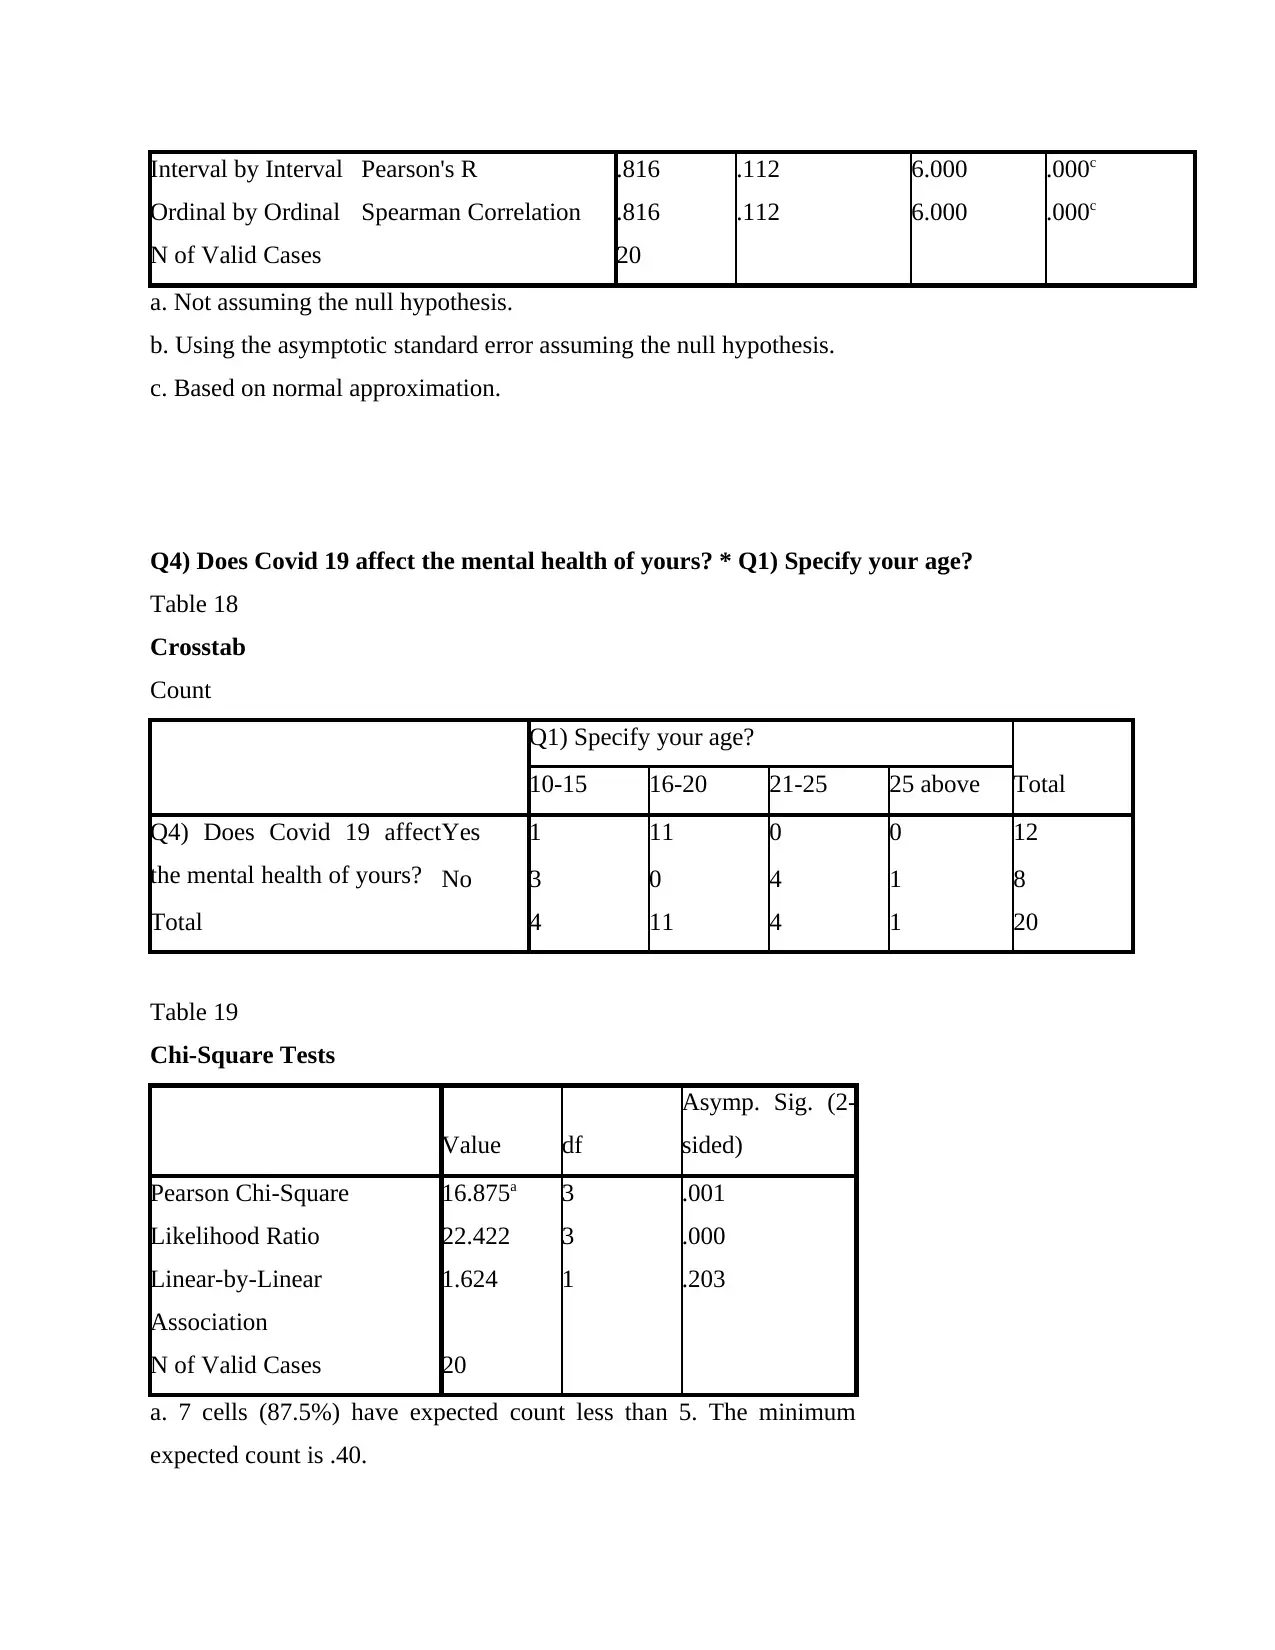
COVID 19 has affected the study of the students to a great extent. Along with this table 19 states
that the significance value is 0.001 which is less than the standard and it outlines that alternate
hypothesis is being accepted. Also this implies that COVID 19 has affected the mental health of
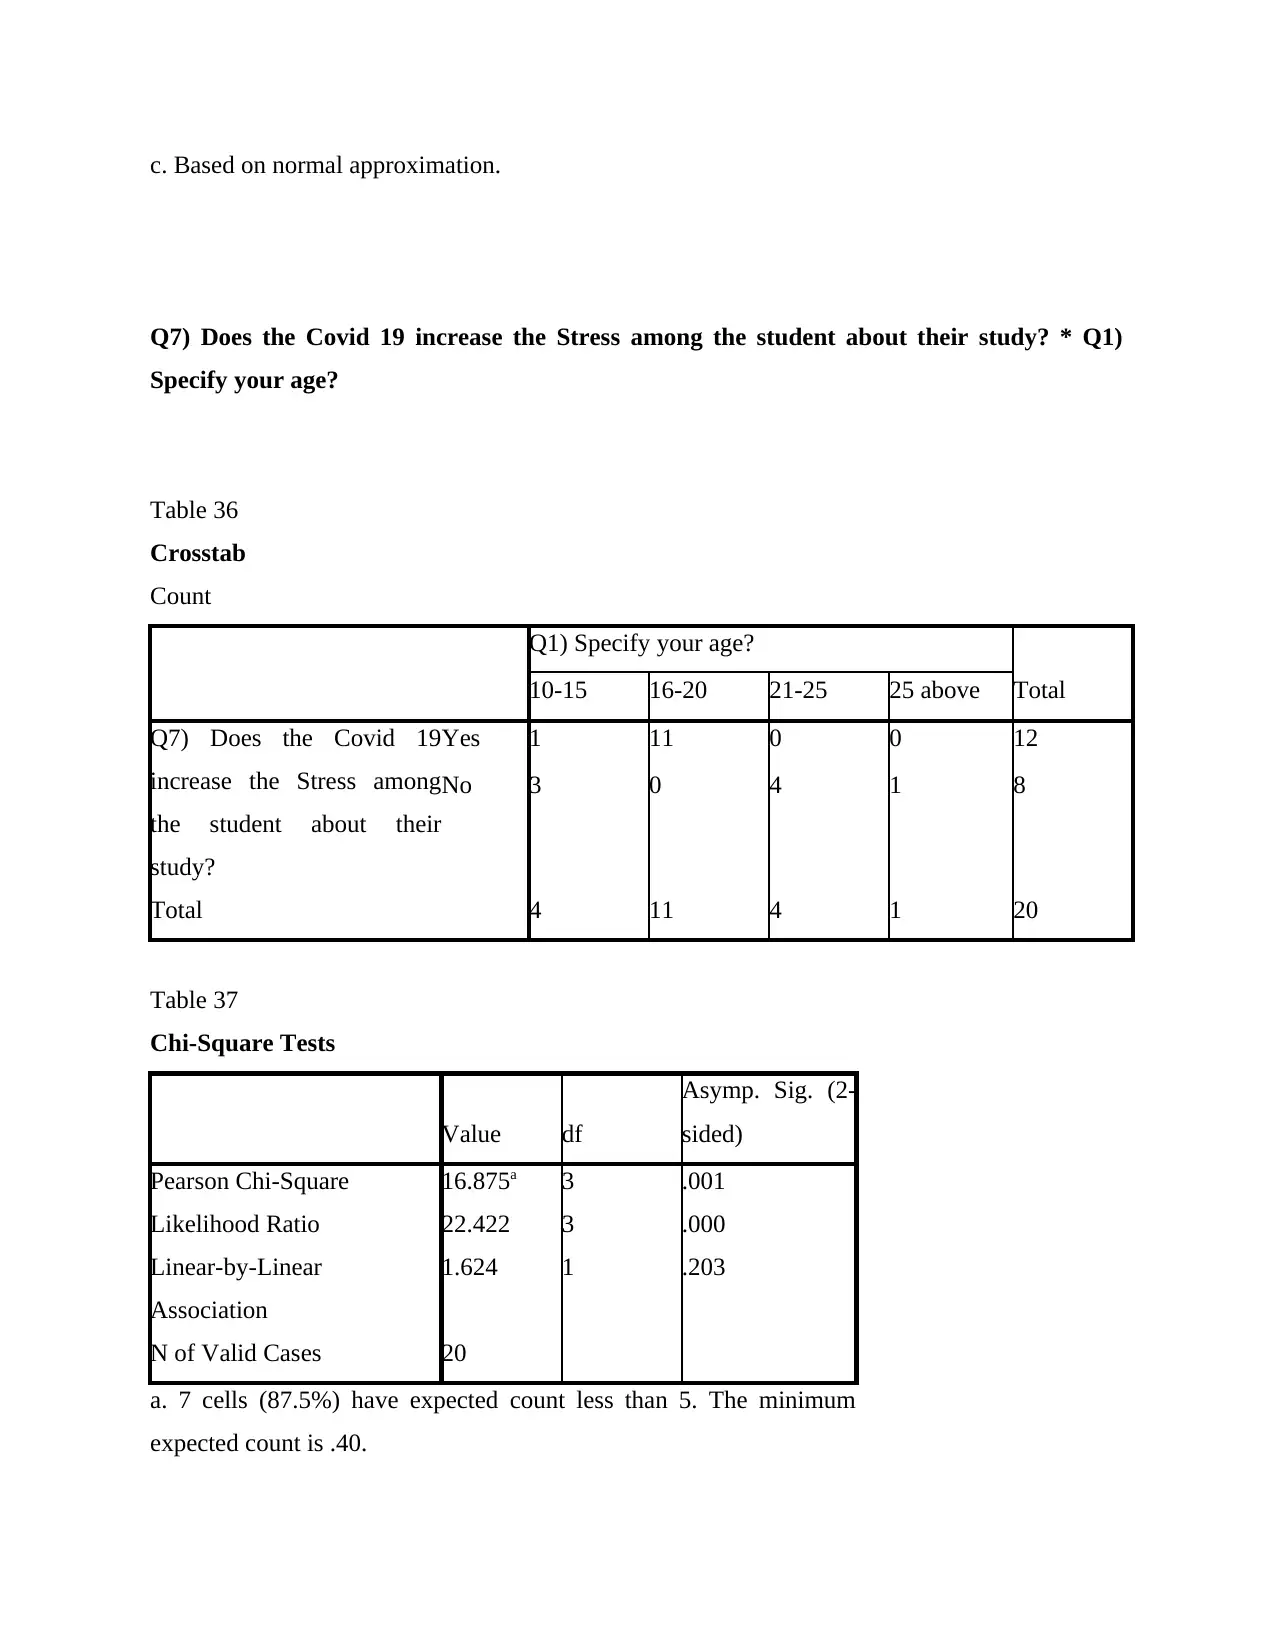
the student as well. further the table 37 states that significance value is 0.001 which is less than
0.05 and this states that COVID has increased the stress among the student relating to their study.
This is pertaining to the fact that when the COVID was at its peak then schools and colleges
were shut and this affected the mental state of the children to a great extent.
For the study to be completed in successful manner the ethical aspect need to be managed
in proper and effective manner. For this present study all the data gathered is latest and from the
reliable sources only (Liamputtong, 2020). Also no personal information is being used within the
study or any other information which can harm the working of the study.
Reflexivity
In the present study I have undertaken the step of data analysis with help of SPSS. This is
being selected for the reason that I am good in using SPSS software and this was helpful in
completing the study in better and effective manner.
FINDINGS
Descriptive statistics
With the help of the finding from table 1 it is clear that on an average the majority of the
participant belongs to the age category of 16- 20. This simply implies that the majority of the
people belong to this age category. Along with this table 3 outlined that from all the participants
the gender distribution is equal that is 10 are male and 10 females. Thus, this provides the clear
representation of the population as it is equally divided within the working of the total sample.
Moreover, with help of table 5 it is also evident that COVID 19 has affected the mental health of
the students. This is pertaining to the fact that when the students were having online classes then
at that time they were isolated within home and this affected the mental health of the person to a
great extent.
Cross tabulation
With respect to cross tabulation, the table 13 highlights that the significance value is
0.001 which is less than the standard that is 0.05. this simply means that on the basis of age,
COVID 19 has affected the study of the students to a great extent. Along with this table 19 states
that the significance value is 0.001 which is less than the standard and it outlines that alternate
hypothesis is being accepted. Also this implies that COVID 19 has affected the mental health of
the student as well. further the table 37 states that significance value is 0.001 which is less than
0.05 and this states that COVID has increased the stress among the student relating to their study.
This is pertaining to the fact that when the COVID was at its peak then schools and colleges
were shut and this affected the mental state of the children to a great extent.
DISCUSSION
With the above finding it is clear that the COVID 19 has created a lot of negative impact
over the mental status of the person. This is pertaining to the fact that when pandemic was at its
peak then at that time business, schools, colleges and other institute were shut down and were not
allowed to go anywhere. Hence, this affected the mental status of the children to a great extent.
The reason underlying this fact was that children had to attend the classes online and they cannot
go out and meet others. Hence, this affected the working and learning capability of the person to
a great extent.
In support of this Reznik and et.al., (2021) stated that effect on mental health can cause
different impact over the working capability of the student to a great extent. the reason
underlying this fact is that when the student will not be able to work with mental peace then this
will be affecting the efficiency of meeting the work related objectives. When student in not in
proper condition of working and thinking then this will be affecting the efficiency and learning
capability. Hence, this will be affecting the thinking capability of the student.
Further with the finding it was clear that government must take some steps on reducing
the mental burden of the student. For this government must try to make policy and procedure
which will assist them in managing the working pattern and learning objectives. Hence, this will
be resulting in better outcome for the student and also the mental issue will be reduced. Along
with this government must also think of organizing some of the event or competition which will
help student to interact with others as well.
CONCLUSION
In the end it is concluded that pandemic has created many negative impact over the
working of whole world to a great extent. with these negative impact the most common is
affecting the mental status and health of the student to a great extent. the above methodology
outlined that use of quantitative methods is helpful in managing the data and bringing the
accurate output in precise and accurate manner. Also, with the finding it was clear that the
sample was equally divided on the basis of gender that is 10 males and 10 females. Further it was
also found that majority of the people were agreeing to the fact that COVID 19 has affected the
mental health of the students to a great extent.
Paraphrase This Document
Need a fresh take? Get an instant paraphrase of this document with our AI Paraphraser

REFERENCES
Books and Journals
Copeland, W.E., and et.al., 2021. Impact of COVID-19 pandemic on college student mental
health and wellness. Journal of the American Academy of Child & Adolescent
Psychiatry. 60(1). pp.134-141.
Grubic, N., Badovinac, S. and Johri, A.M., 2020. Student mental health in the midst of the
COVID-19 pandemic: A call for further research and immediate solutions. International
Journal of Social Psychiatry. 66(5). pp.517-518.
Liamputtong, P., 2020. Qualitative research methods.
Liu, C.H., and et.al., 2020. Priorities for addressing the impact of the COVID-19 pandemic on
college student mental health. Journal of American College Health, pp.1-3.
Reznik, A., and et.al., 2021. First and second wave COVID-19 fear impact: Israeli and Russian
social work student fear, mental health and substance use. International journal of mental
health and addiction, pp.1-8.
Shepherd, H.A., and et.al., 2021. The impact of COVID-19 on high school student-athlete
experiences with physical activity, mental health, and social connection. International
journal of environmental research and public health. 18(7). p.3515.
Zhu, M., Sari, A. and Lee, M.M., 2018. A systematic review of research methods and topics of
the empirical MOOC literature (2014–2016). The Internet and Higher Education. 37.
pp.31-39.
APPENDIX 1
Table 1- Statistical data for all the variables
Statistics
Q1)
Speci
fy
your
age?
Q2)
Speci
fy
your
gende
r?
Q3)
Does
the
global
pande
mic
Covid
19
affect
your
study?
Q4)
Does
Covi
d 19
affec
t the
ment
al
healt
h of
your
s?
Q5) Did
you feel
comforta
ble while
taking
online
class?
Q6) Do
you
agree
that
Covid
19 has
drastica
lly
impact
the
learnin
g
ability
of the
student
?
Q7)
Does
the
Covid
19
increa
se the
Stress
amon
g the
stude
nt
about
their
study
?
Q8) Does
Covid 19
increase
the
anxiety
among the
student as
they are
not able to
go
physically
to their
organizati
on?
Q9)
Does
going
to
school
or
colleg
e
helps
the
studen
t to be
menta
lly fit?
Q10) Do
you
think
governm
ent
should
think on
the
mental
health of
the
student
which
were
faced at
the time
of Covid
19
pandemi
c?
N Valid 20 20 20 20 20 20 20 20 20 20
Missi
ng
0 0 0 0 0 0 0 0 0 0
Mean 2.100
0
1.500
0
1.4000 1.40
00
1.6500 2.4500 1.400
0
1.4000 1.400
0
2.5000
Median 2.000
0
1.500
0
1.0000 1.00
00
2.0000 2.0000 1.000
0
1.0000 1.000
0
2.0000
Mode 2.00 1.00a 1.00 1.00 2.00 1.00 1.00 1.00 1.00 1.00
Std.
Deviatio
n
.7880
7
.5129
9
.50262 .502
62
.48936 1.6050
9
.5026
2
.50262 .5026
2
1.67017
Sum 42.00 30.00 28.00 28.0
0
33.00 49.00 28.00 28.00 28.00 50.00
a. Multiple modes exist. The smallest value is shown
Secure Best Marks with AI Grader
Need help grading? Try our AI Grader for instant feedback on your assignments.
Frequency Table
Table 2
Q1) Specify your age?
Frequency Percent
Valid 10-15 4 20.0
16-20 11 55.0
21-25 4 20.0
25 above 1 5.0
Total 20 100.0
Table 3
Q2) Specify your gender?
Frequency Percent
Valid Male 10 50.0
Female 10 50.0
Total 20 100.0
Table 4
Q3) Does the global pandemic Covid 19 affect your study?
Frequency Percent
Valid Yes 12 60.0
No 8 40.0
Total 20 100.0
Table 5
Q4) Does Covid 19 affect the mental health of yours?
Frequency Percent
Valid Yes 12 60.0
No 8 40.0
Total 20 100.0
Table 6
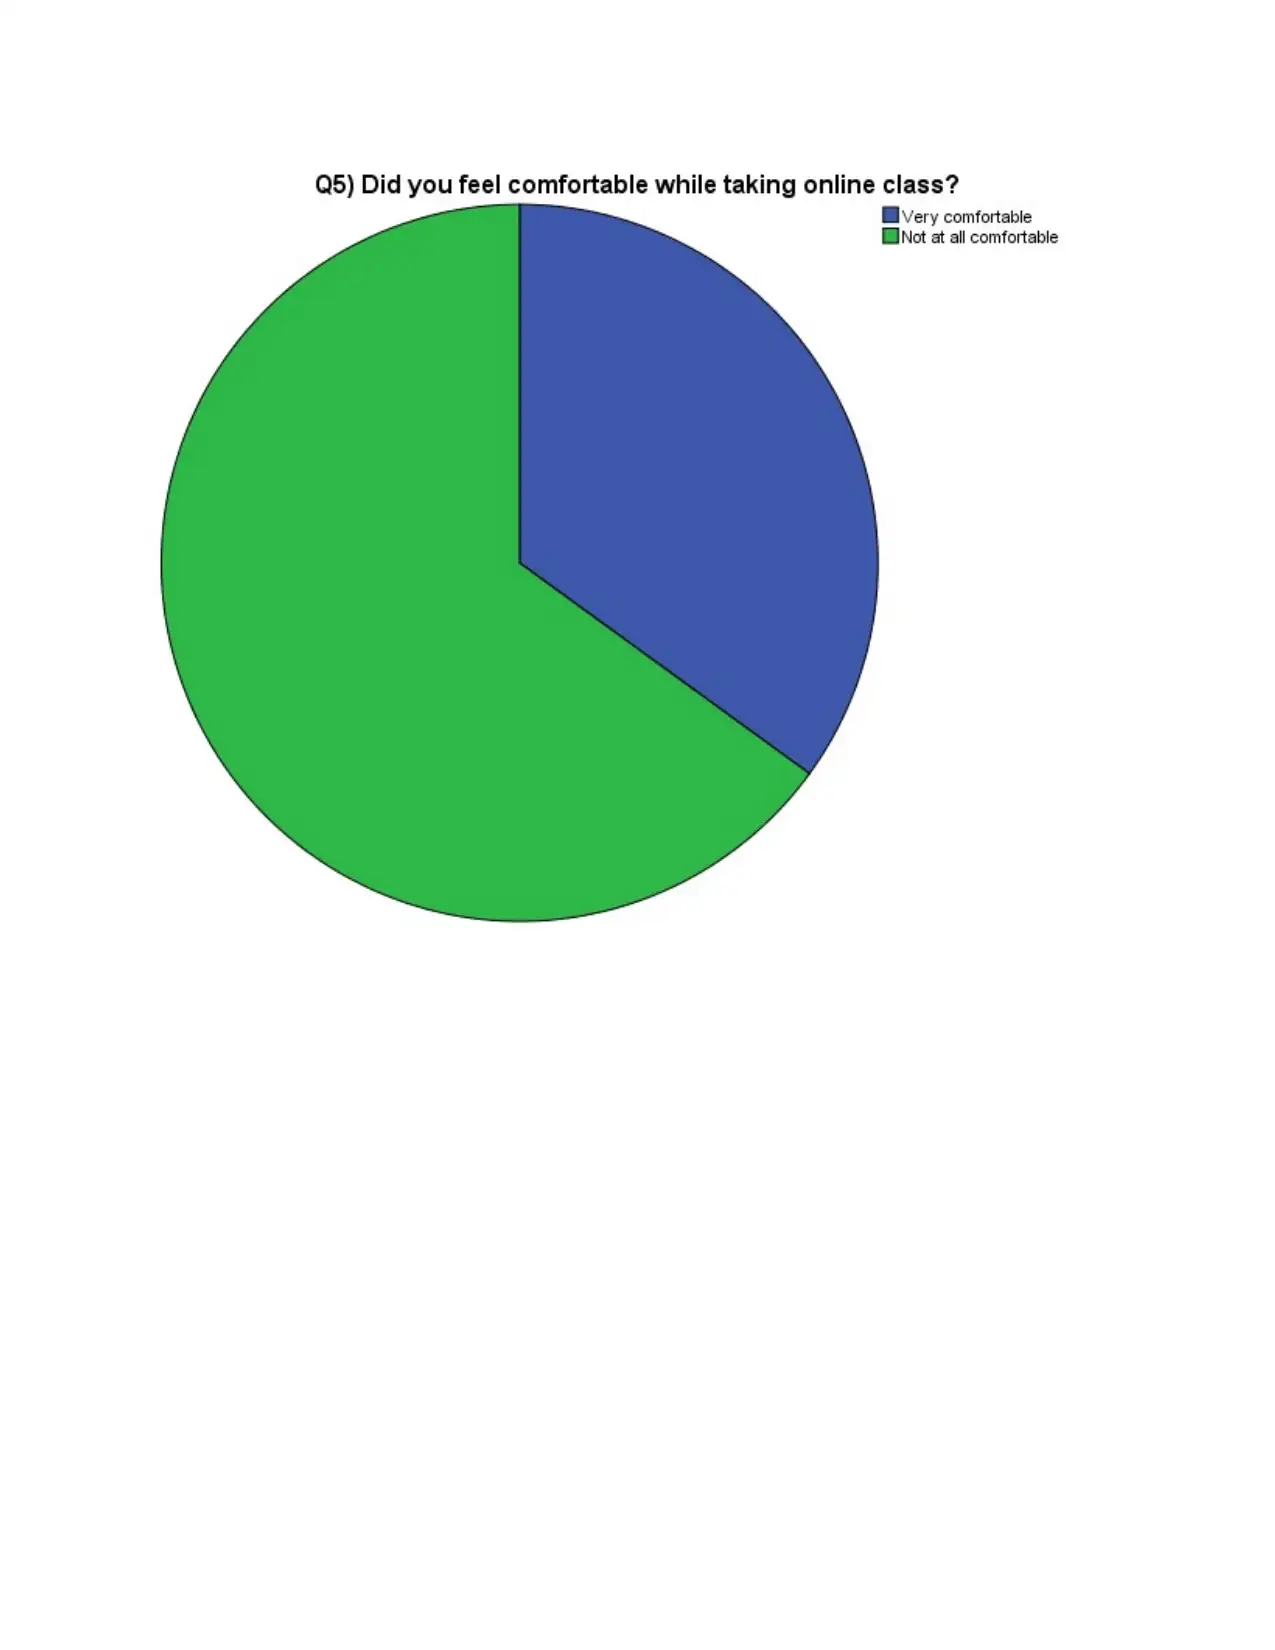
Q5) Did you feel comfortable while taking online class?
Frequency Percent
Valid Very comfortable 7 35.0
Not at all comfortable 13 65.0
Total 20 100.0
Table 7
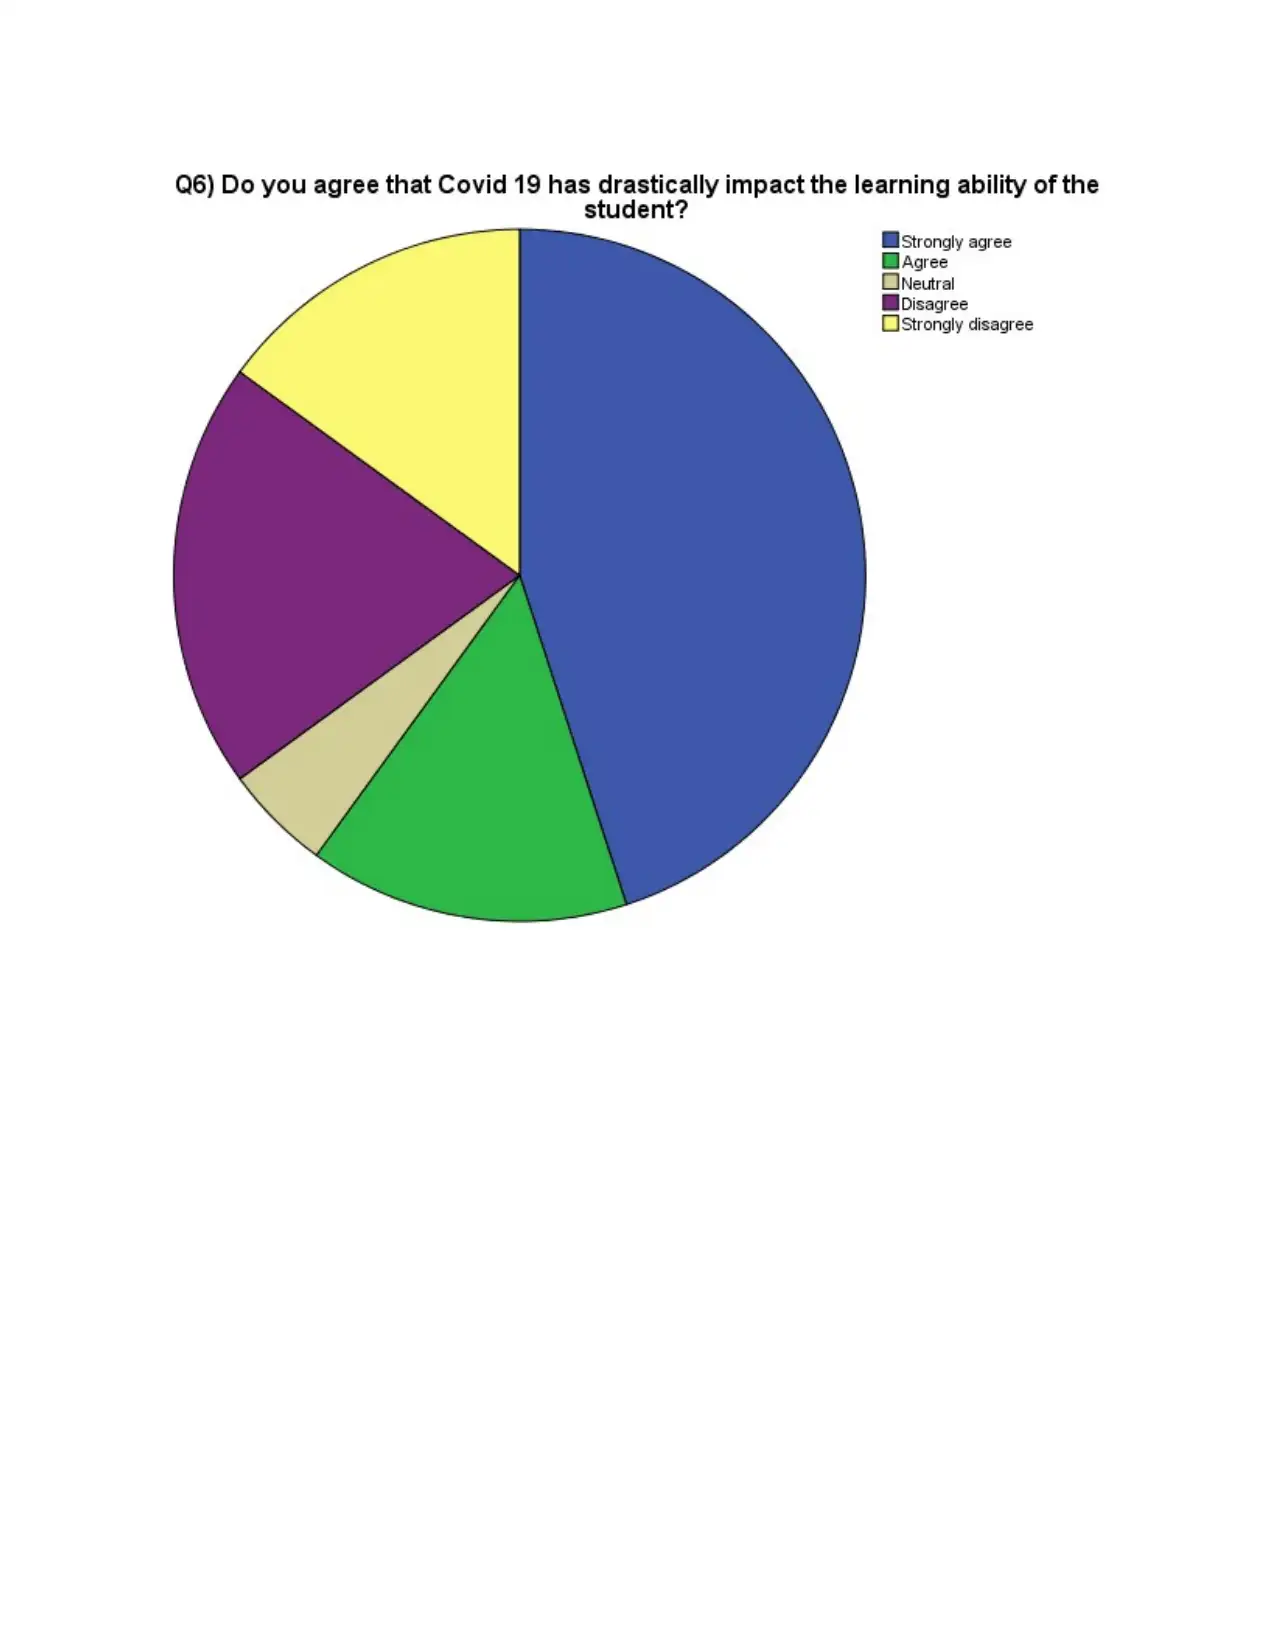
Q6) Do you agree that Covid 19 has drastically impact the learning ability of the student?
Frequency Percent
Valid Strongly agree 9 45.0
Agree 3 15.0
Neutral 1 5.0
Disagree 4 20.0
Strongly disagree 3 15.0
Total 20 100.0
Table 8
Q7) Does the Covid 19 increase the Stress among the student about their study?
Frequency Percent
Valid Yes 12 60.0
No 8 40.0
Total 20 100.0
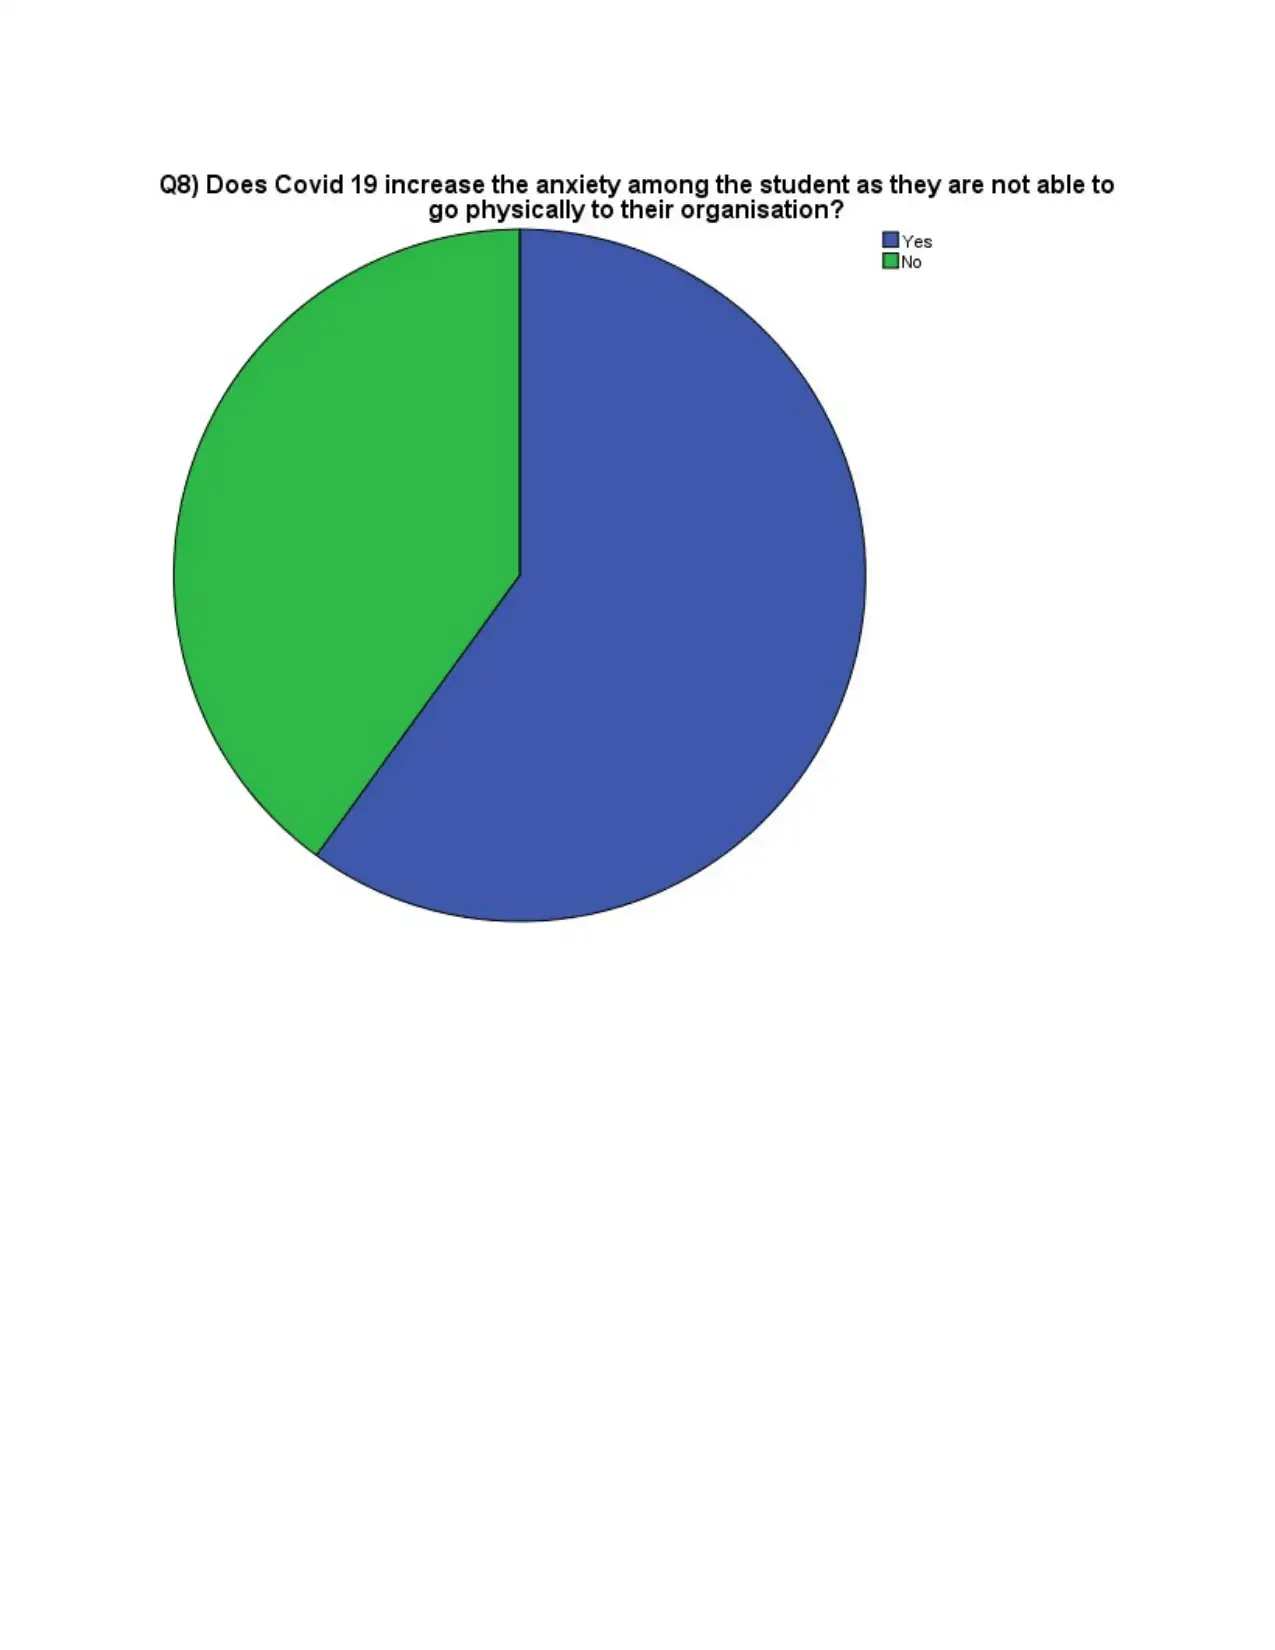
Table 9
Q8) Does Covid 19 increase the anxiety among the student as they are not able to go
physically to their organization?
Frequency Percent
Valid Yes 12 60.0
No 8 40.0
Total 20 100.0
Table 10
Q5) Did you feel comfortable while taking online class?
Frequency Percent
Valid Very comfortable 7 35.0
Not at all comfortable 13 65.0
Total 20 100.0
Table 7
Q6) Do you agree that Covid 19 has drastically impact the learning ability of the student?
Frequency Percent
Valid Strongly agree 9 45.0
Agree 3 15.0
Neutral 1 5.0
Disagree 4 20.0
Strongly disagree 3 15.0
Total 20 100.0
Table 8
Q7) Does the Covid 19 increase the Stress among the student about their study?
Frequency Percent
Valid Yes 12 60.0
No 8 40.0
Total 20 100.0
Table 9
Q8) Does Covid 19 increase the anxiety among the student as they are not able to go
physically to their organization?
Frequency Percent
Valid Yes 12 60.0
No 8 40.0
Total 20 100.0
Table 10
Q9) Does going to school or college helps the student to be mentally fit?
Frequency Percent
Valid Yes 12 60.0
No 8 40.0
Total 20 100.0
Table 11
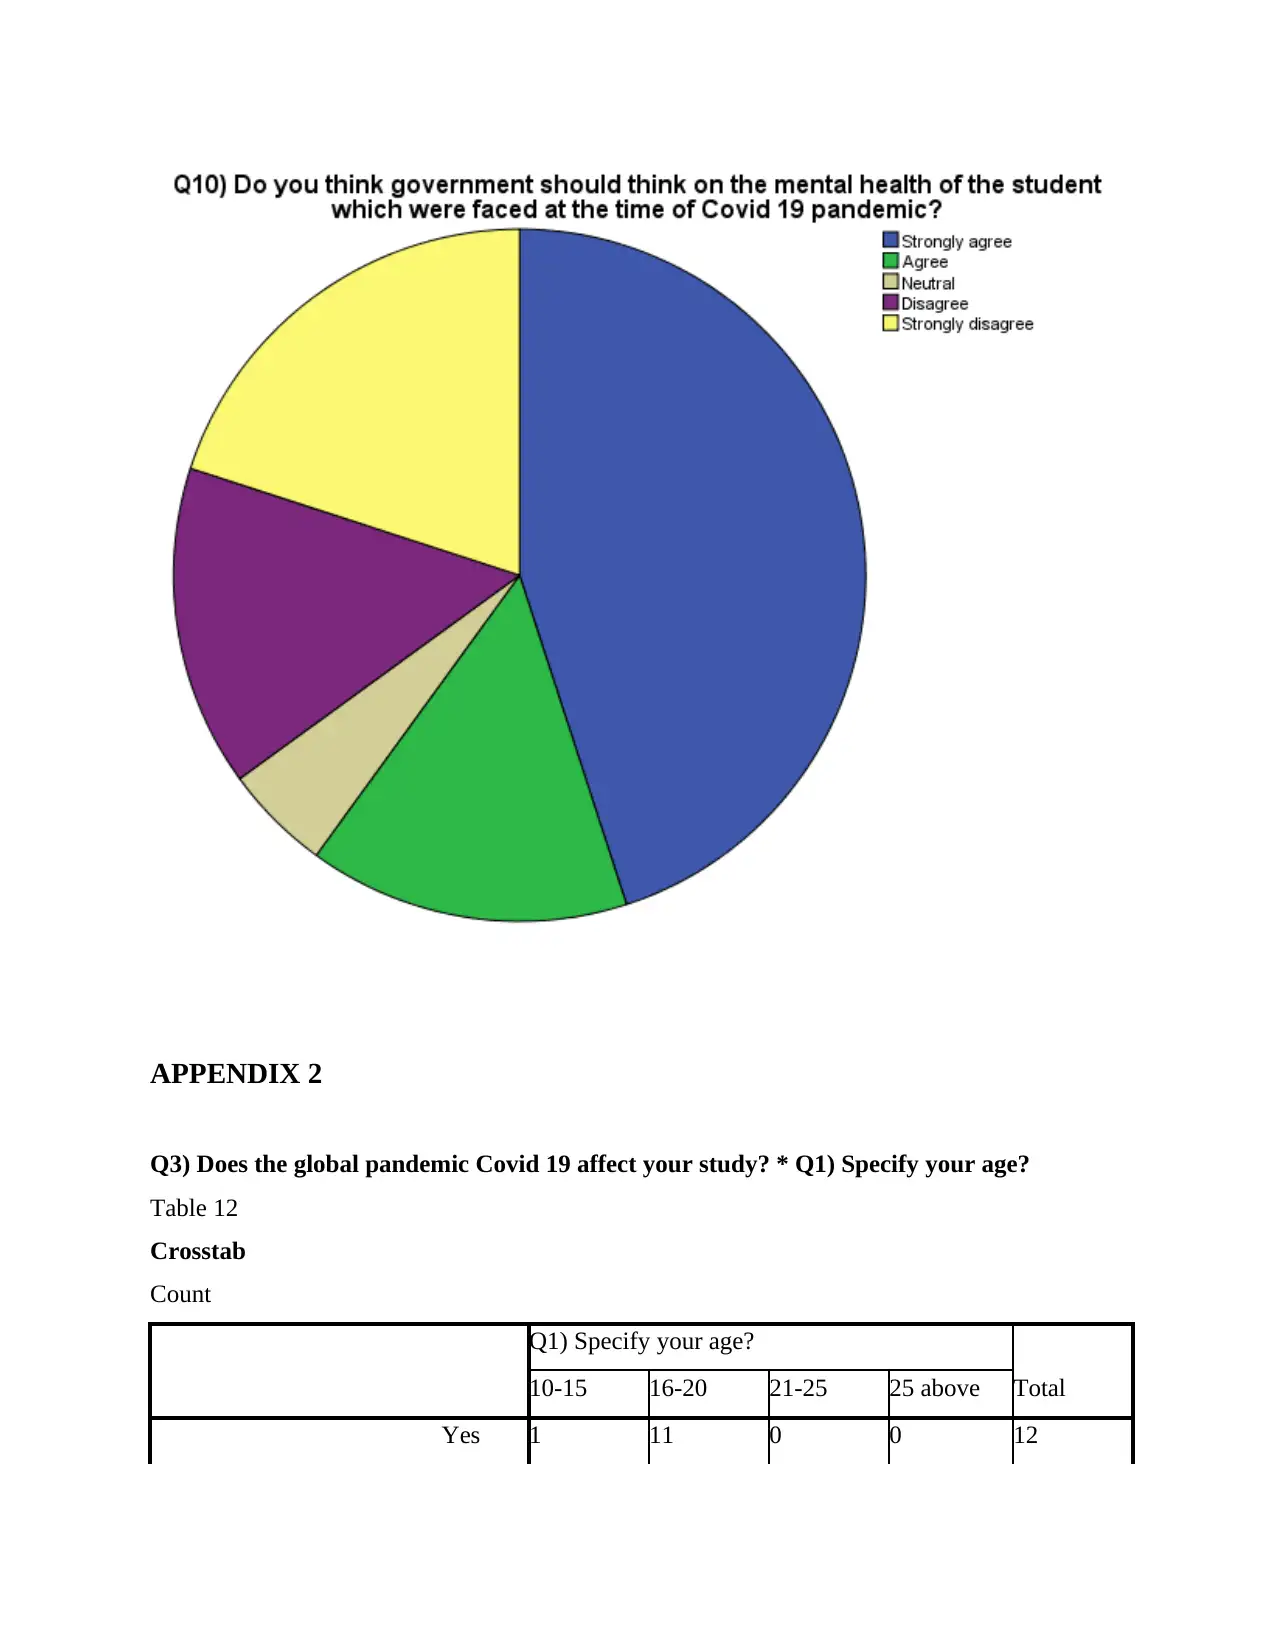
Q10) Do you think government should think on the mental health of the student which
were faced at the time of Covid 19 pandemic?
Frequency Percent
Valid Strongly agree 9 45.0
Agree 3 15.0
Neutral 1 5.0
Disagree 3 15.0
Strongly disagree 4 20.0
Total 20 100.0
Pie Chart
Frequency Percent
Valid Yes 12 60.0
No 8 40.0
Total 20 100.0
Table 11
Q10) Do you think government should think on the mental health of the student which
were faced at the time of Covid 19 pandemic?
Frequency Percent
Valid Strongly agree 9 45.0
Agree 3 15.0
Neutral 1 5.0
Disagree 3 15.0
Strongly disagree 4 20.0
Total 20 100.0
Pie Chart
Paraphrase This Document
Need a fresh take? Get an instant paraphrase of this document with our AI Paraphraser

Secure Best Marks with AI Grader
Need help grading? Try our AI Grader for instant feedback on your assignments.
Paraphrase This Document
Need a fresh take? Get an instant paraphrase of this document with our AI Paraphraser


Secure Best Marks with AI Grader
Need help grading? Try our AI Grader for instant feedback on your assignments.
APPENDIX 2
Q3) Does the global pandemic Covid 19 affect your study? * Q1) Specify your age?
Table 12
Crosstab
Count
Q1) Specify your age?
Total10-15 16-20 21-25 25 above
Yes 1 11 0 0 12
Q3) Does the global pandemic Covid 19 affect your study? * Q1) Specify your age?
Table 12
Crosstab
Count
Q1) Specify your age?
Total10-15 16-20 21-25 25 above
Yes 1 11 0 0 12
Q3) Does the global
pandemic Covid 19 affect
your study?
No 3 0 4 1 8
Total 4 11 4 1 20
Table 13
Chi-Square Tests
Value df
Asymp. Sig. (2-
sided)
Pearson Chi-Square 16.875a 3 .001
Likelihood Ratio 22.422 3 .000
Linear-by-Linear
Association
1.624 1 .203
N of Valid Cases 20
a. 7 cells (87.5%) have expected count less than 5. The minimum
expected count is .40.
Table 14
Symmetric Measures
Value
Asymp. Std.
Errora Approx. Tb Approx. Sig.
Interval by Interval Pearson's R .292 .244 1.297 .211c
Ordinal by Ordinal Spearman Correlation .264 .308 1.161 .261c
N of Valid Cases 20
a. Not assuming the null hypothesis.
b. Using the asymptotic standard error assuming the null hypothesis.
c. Based on normal approximation.
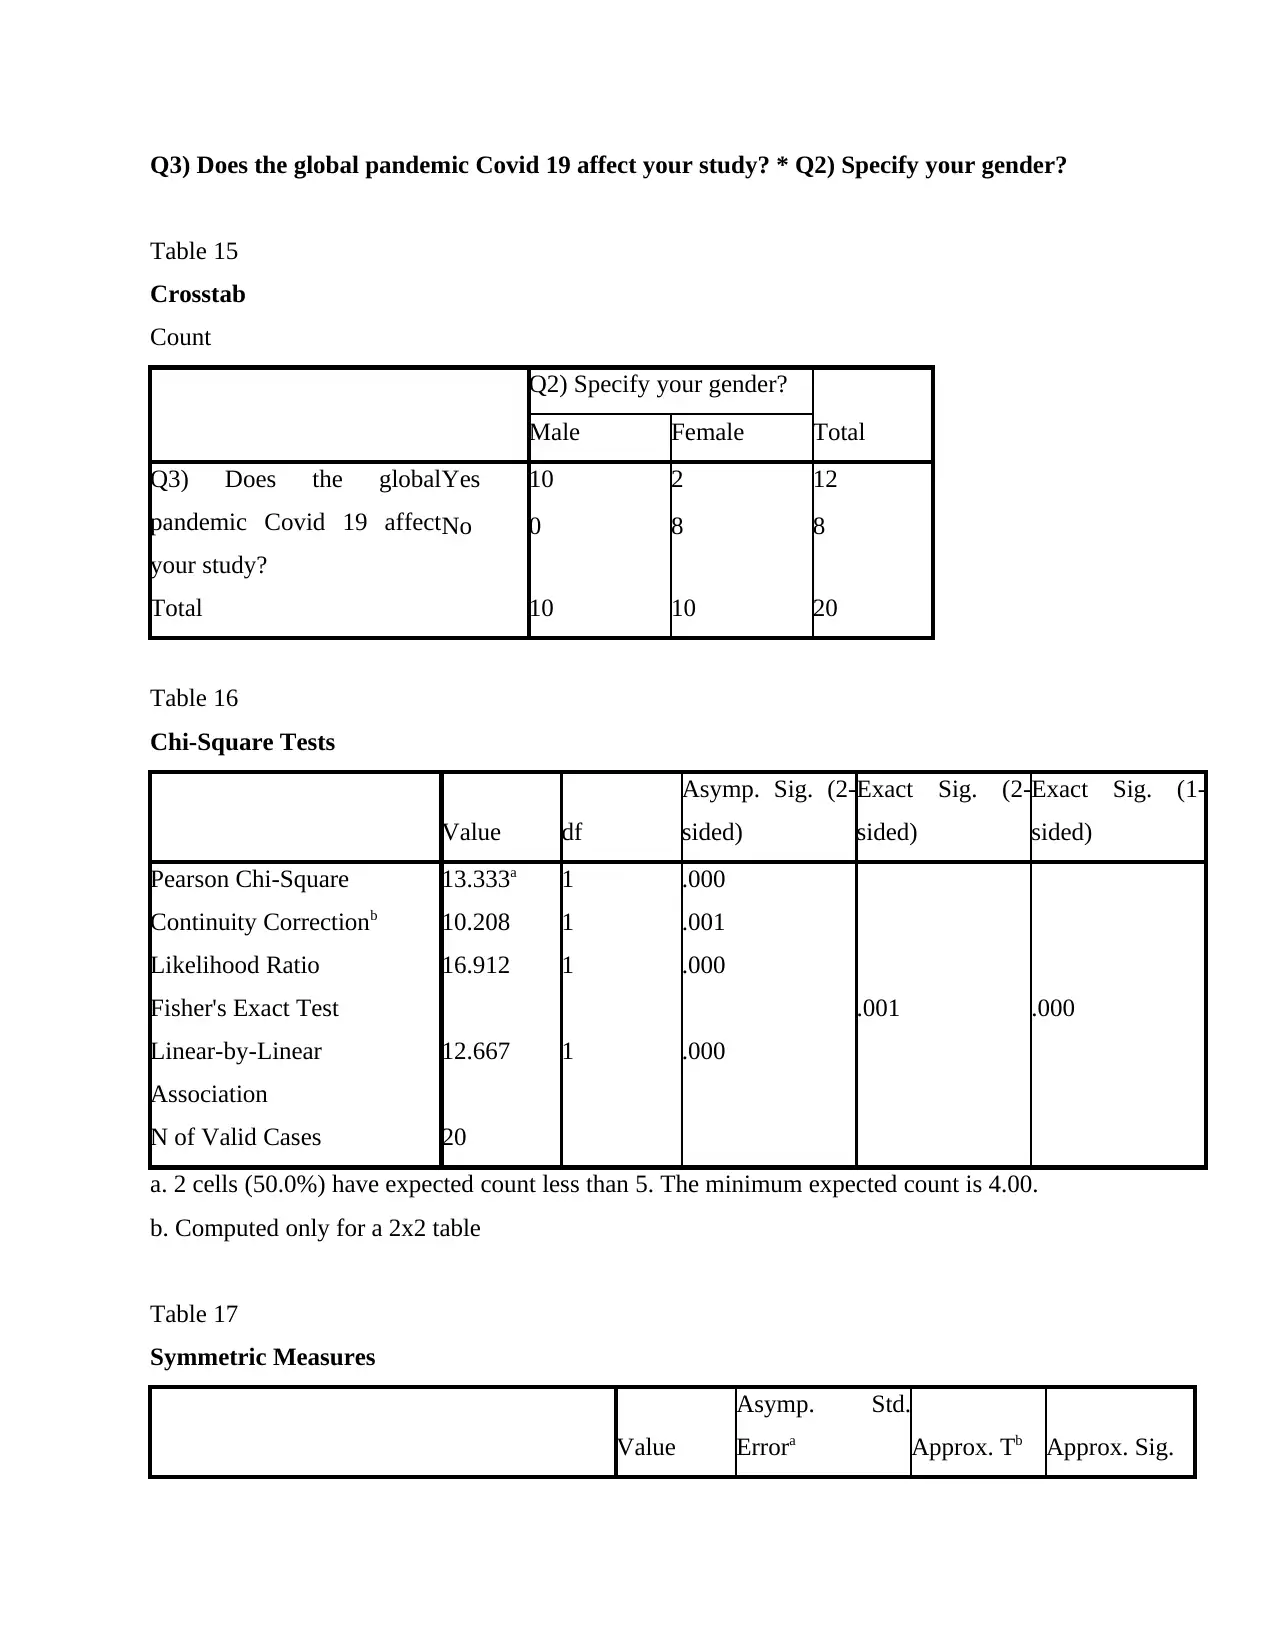
Q3) Does the global pandemic Covid 19 affect your study? * Q2) Specify your gender?
Table 15
Crosstab
Count
Q2) Specify your gender?
TotalMale Female
Q3) Does the global
pandemic Covid 19 affect
your study?
Yes 10 2 12
No 0 8 8
Total 10 10 20
Table 16
Chi-Square Tests
Value df
Asymp. Sig. (2-
sided)
Exact Sig. (2-
sided)
Exact Sig. (1-
sided)
Pearson Chi-Square 13.333a 1 .000
Continuity Correctionb 10.208 1 .001
Likelihood Ratio 16.912 1 .000
Fisher's Exact Test .001 .000
Linear-by-Linear
Association
12.667 1 .000
N of Valid Cases 20
a. 2 cells (50.0%) have expected count less than 5. The minimum expected count is 4.00.
b. Computed only for a 2x2 table
Table 17
Symmetric Measures
Value
Asymp. Std.
Errora Approx. Tb Approx. Sig.
Paraphrase This Document
Need a fresh take? Get an instant paraphrase of this document with our AI Paraphraser
Interval by Interval Pearson's R .816 .112 6.000 .000c
Ordinal by Ordinal Spearman Correlation .816 .112 6.000 .000c
N of Valid Cases 20
a. Not assuming the null hypothesis.
b. Using the asymptotic standard error assuming the null hypothesis.
c. Based on normal approximation.
Q4) Does Covid 19 affect the mental health of yours? * Q1) Specify your age?
Table 18
Crosstab
Count
Q1) Specify your age?
Total10-15 16-20 21-25 25 above
Q4) Does Covid 19 affect
the mental health of yours?
Yes 1 11 0 0 12
No 3 0 4 1 8
Total 4 11 4 1 20
Table 19
Chi-Square Tests
Value df
Asymp. Sig. (2-
sided)
Pearson Chi-Square 16.875a 3 .001
Likelihood Ratio 22.422 3 .000
Linear-by-Linear
Association
1.624 1 .203
N of Valid Cases 20
a. 7 cells (87.5%) have expected count less than 5. The minimum
expected count is .40.
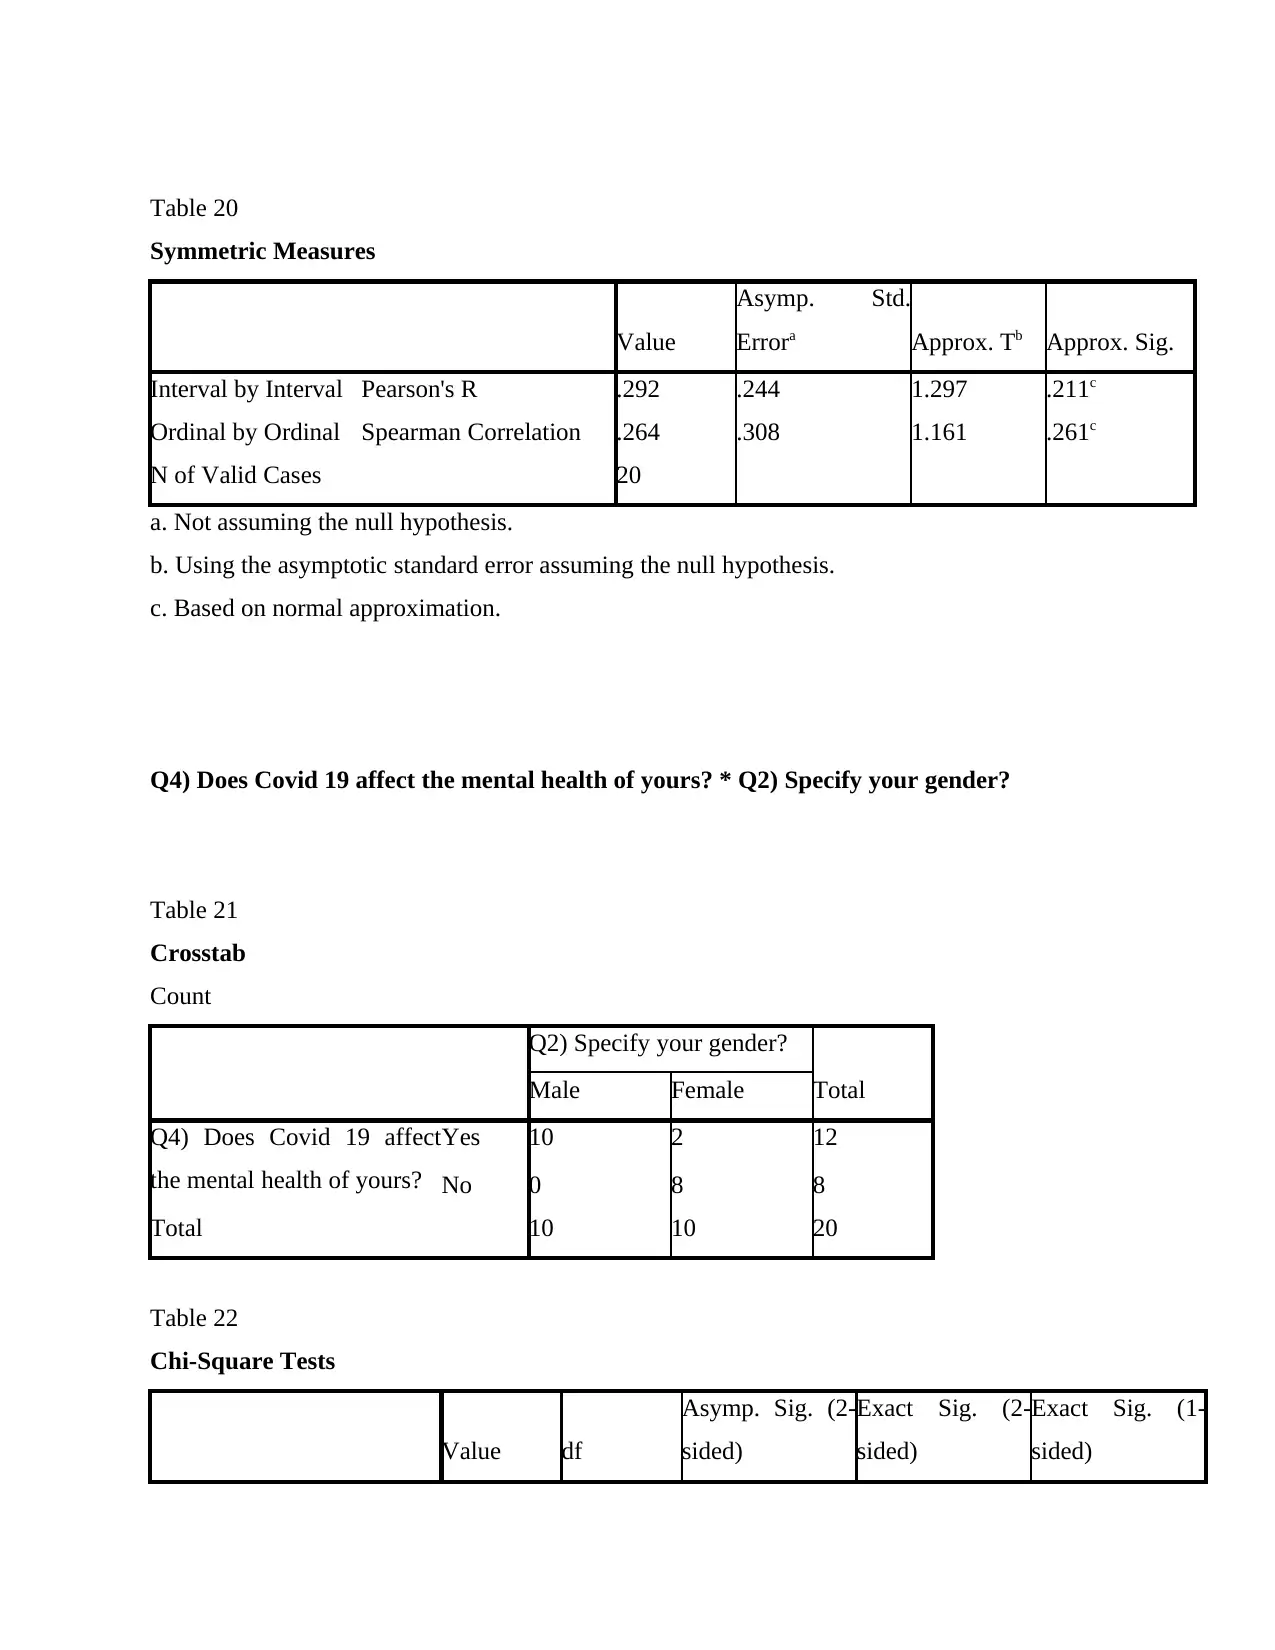
Table 20
Symmetric Measures
Value
Asymp. Std.
Errora Approx. Tb Approx. Sig.
Interval by Interval Pearson's R .292 .244 1.297 .211c
Ordinal by Ordinal Spearman Correlation .264 .308 1.161 .261c
N of Valid Cases 20
a. Not assuming the null hypothesis.
b. Using the asymptotic standard error assuming the null hypothesis.
c. Based on normal approximation.
Q4) Does Covid 19 affect the mental health of yours? * Q2) Specify your gender?
Table 21
Crosstab
Count
Q2) Specify your gender?
TotalMale Female
Q4) Does Covid 19 affect
the mental health of yours?
Yes 10 2 12
No 0 8 8
Total 10 10 20
Table 22
Chi-Square Tests
Value df
Asymp. Sig. (2-
sided)
Exact Sig. (2-
sided)
Exact Sig. (1-
sided)
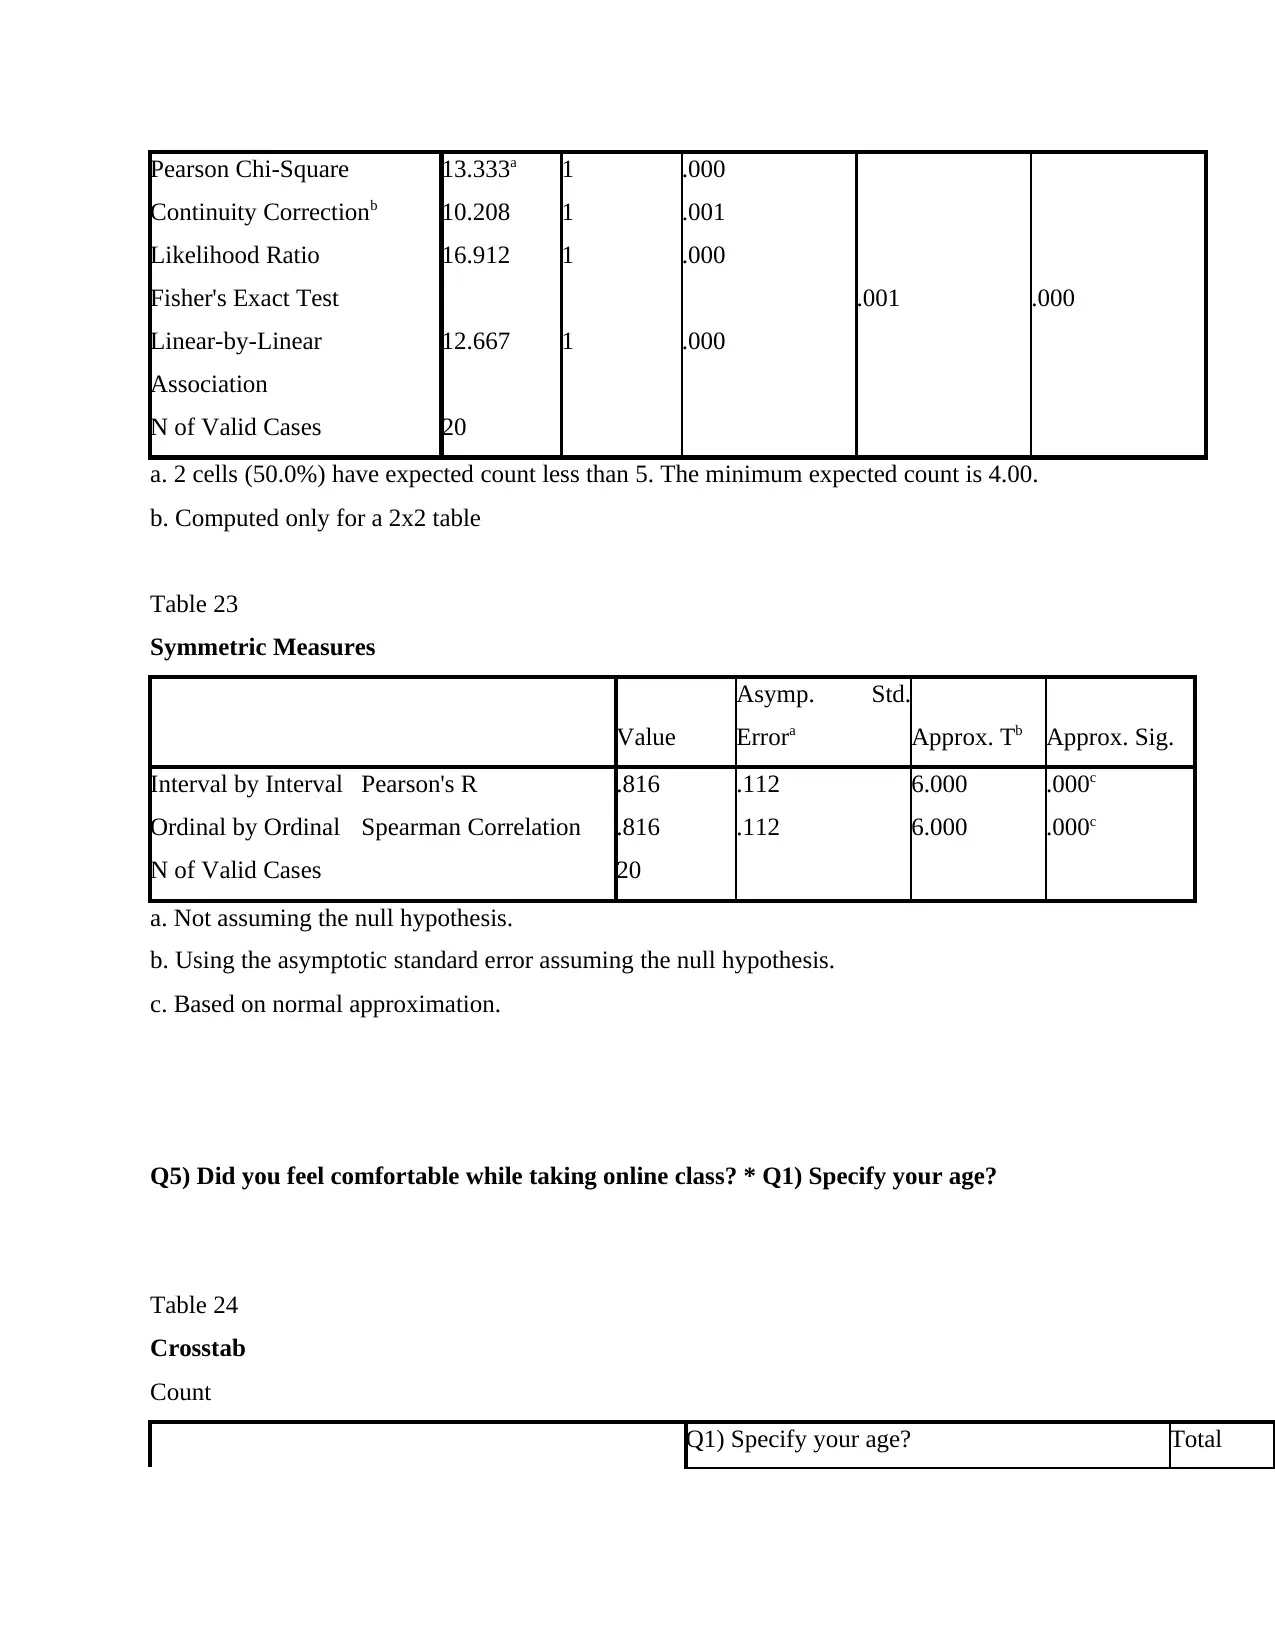
Pearson Chi-Square 13.333a 1 .000
Continuity Correctionb 10.208 1 .001
Likelihood Ratio 16.912 1 .000
Fisher's Exact Test .001 .000
Linear-by-Linear
Association
12.667 1 .000
N of Valid Cases 20
a. 2 cells (50.0%) have expected count less than 5. The minimum expected count is 4.00.
b. Computed only for a 2x2 table
Table 23
Symmetric Measures
Value
Asymp. Std.
Errora Approx. Tb Approx. Sig.
Interval by Interval Pearson's R .816 .112 6.000 .000c
Ordinal by Ordinal Spearman Correlation .816 .112 6.000 .000c
N of Valid Cases 20
a. Not assuming the null hypothesis.
b. Using the asymptotic standard error assuming the null hypothesis.
c. Based on normal approximation.
Q5) Did you feel comfortable while taking online class? * Q1) Specify your age?
Table 24
Crosstab
Count
Q1) Specify your age? Total
Secure Best Marks with AI Grader
Need help grading? Try our AI Grader for instant feedback on your assignments.
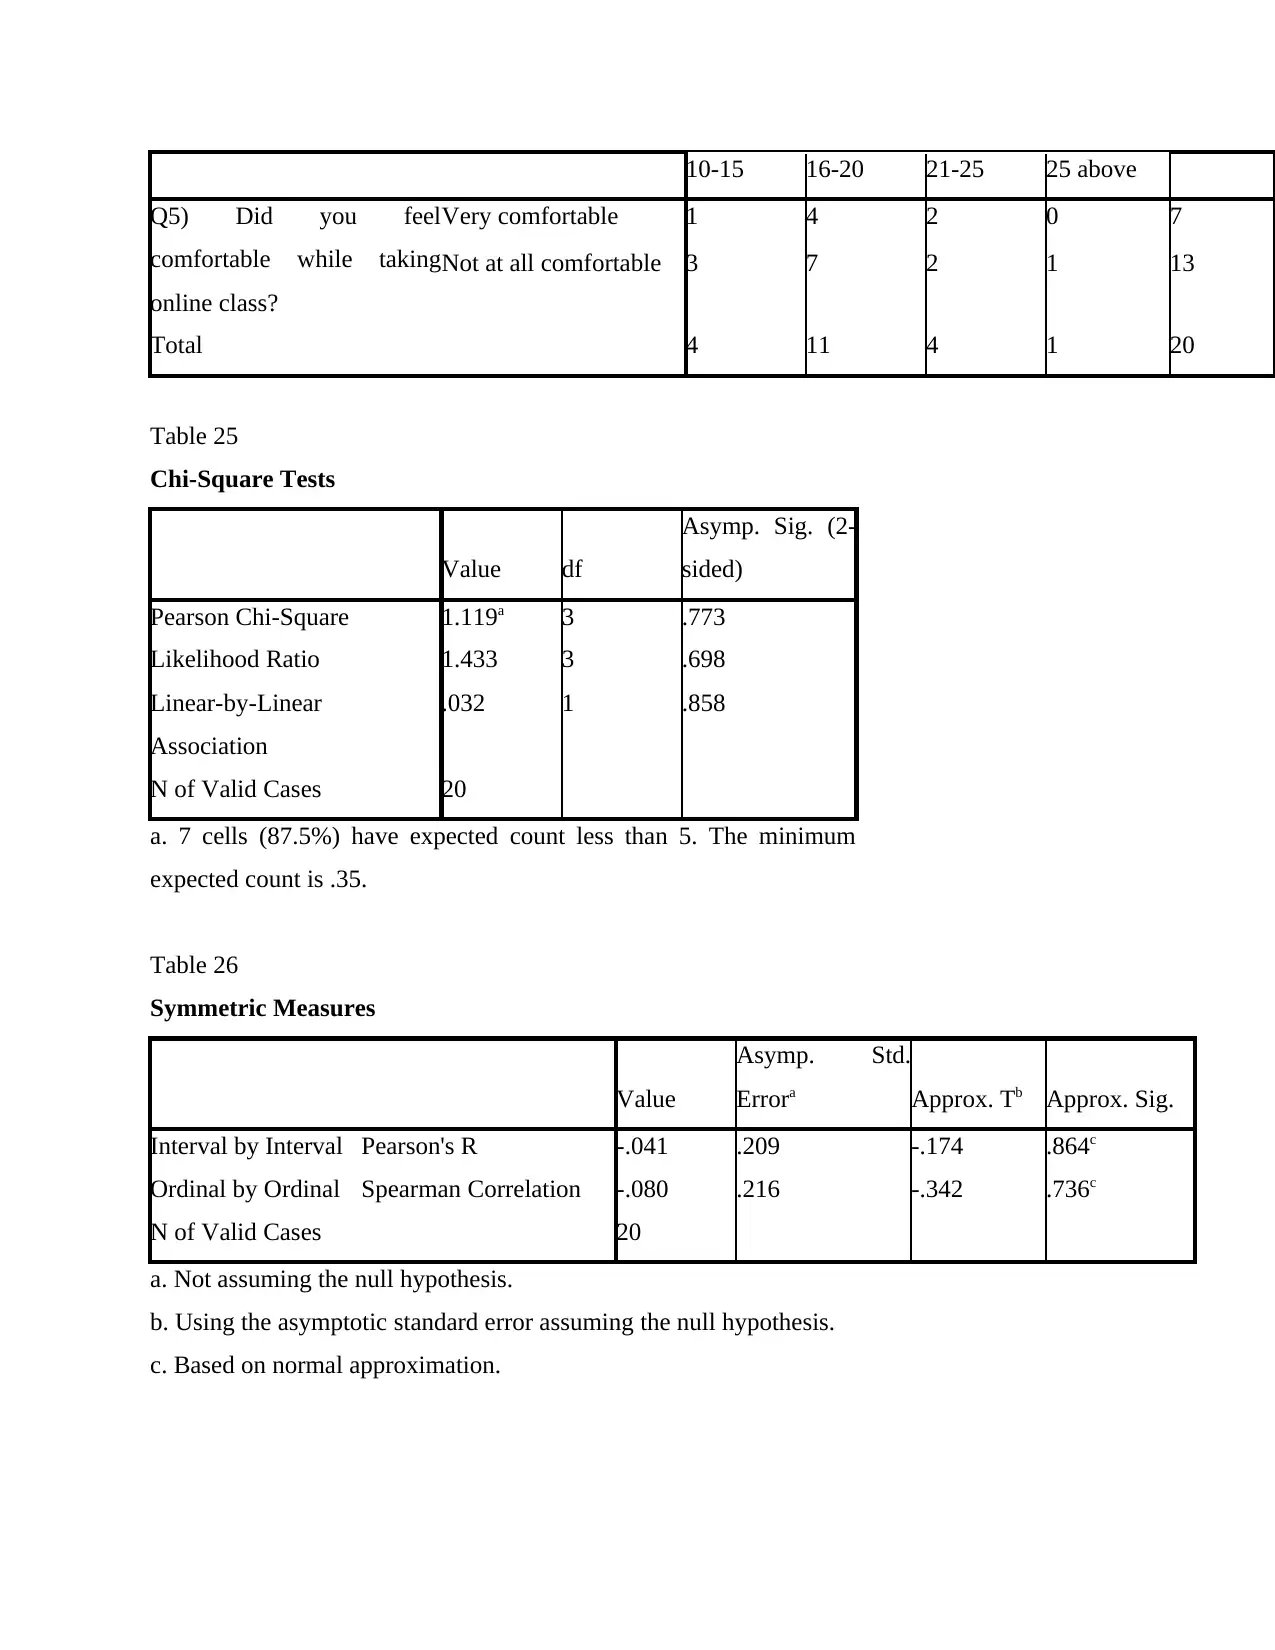
10-15 16-20 21-25 25 above
Q5) Did you feel
comfortable while taking
online class?
Very comfortable 1 4 2 0 7
Not at all comfortable 3 7 2 1 13
Total 4 11 4 1 20
Table 25
Chi-Square Tests
Value df
Asymp. Sig. (2-
sided)
Pearson Chi-Square 1.119a 3 .773
Likelihood Ratio 1.433 3 .698
Linear-by-Linear
Association
.032 1 .858
N of Valid Cases 20
a. 7 cells (87.5%) have expected count less than 5. The minimum
expected count is .35.
Table 26
Symmetric Measures
Value
Asymp. Std.
Errora Approx. Tb Approx. Sig.
Interval by Interval Pearson's R -.041 .209 -.174 .864c
Ordinal by Ordinal Spearman Correlation -.080 .216 -.342 .736c
N of Valid Cases 20
a. Not assuming the null hypothesis.
b. Using the asymptotic standard error assuming the null hypothesis.
c. Based on normal approximation.
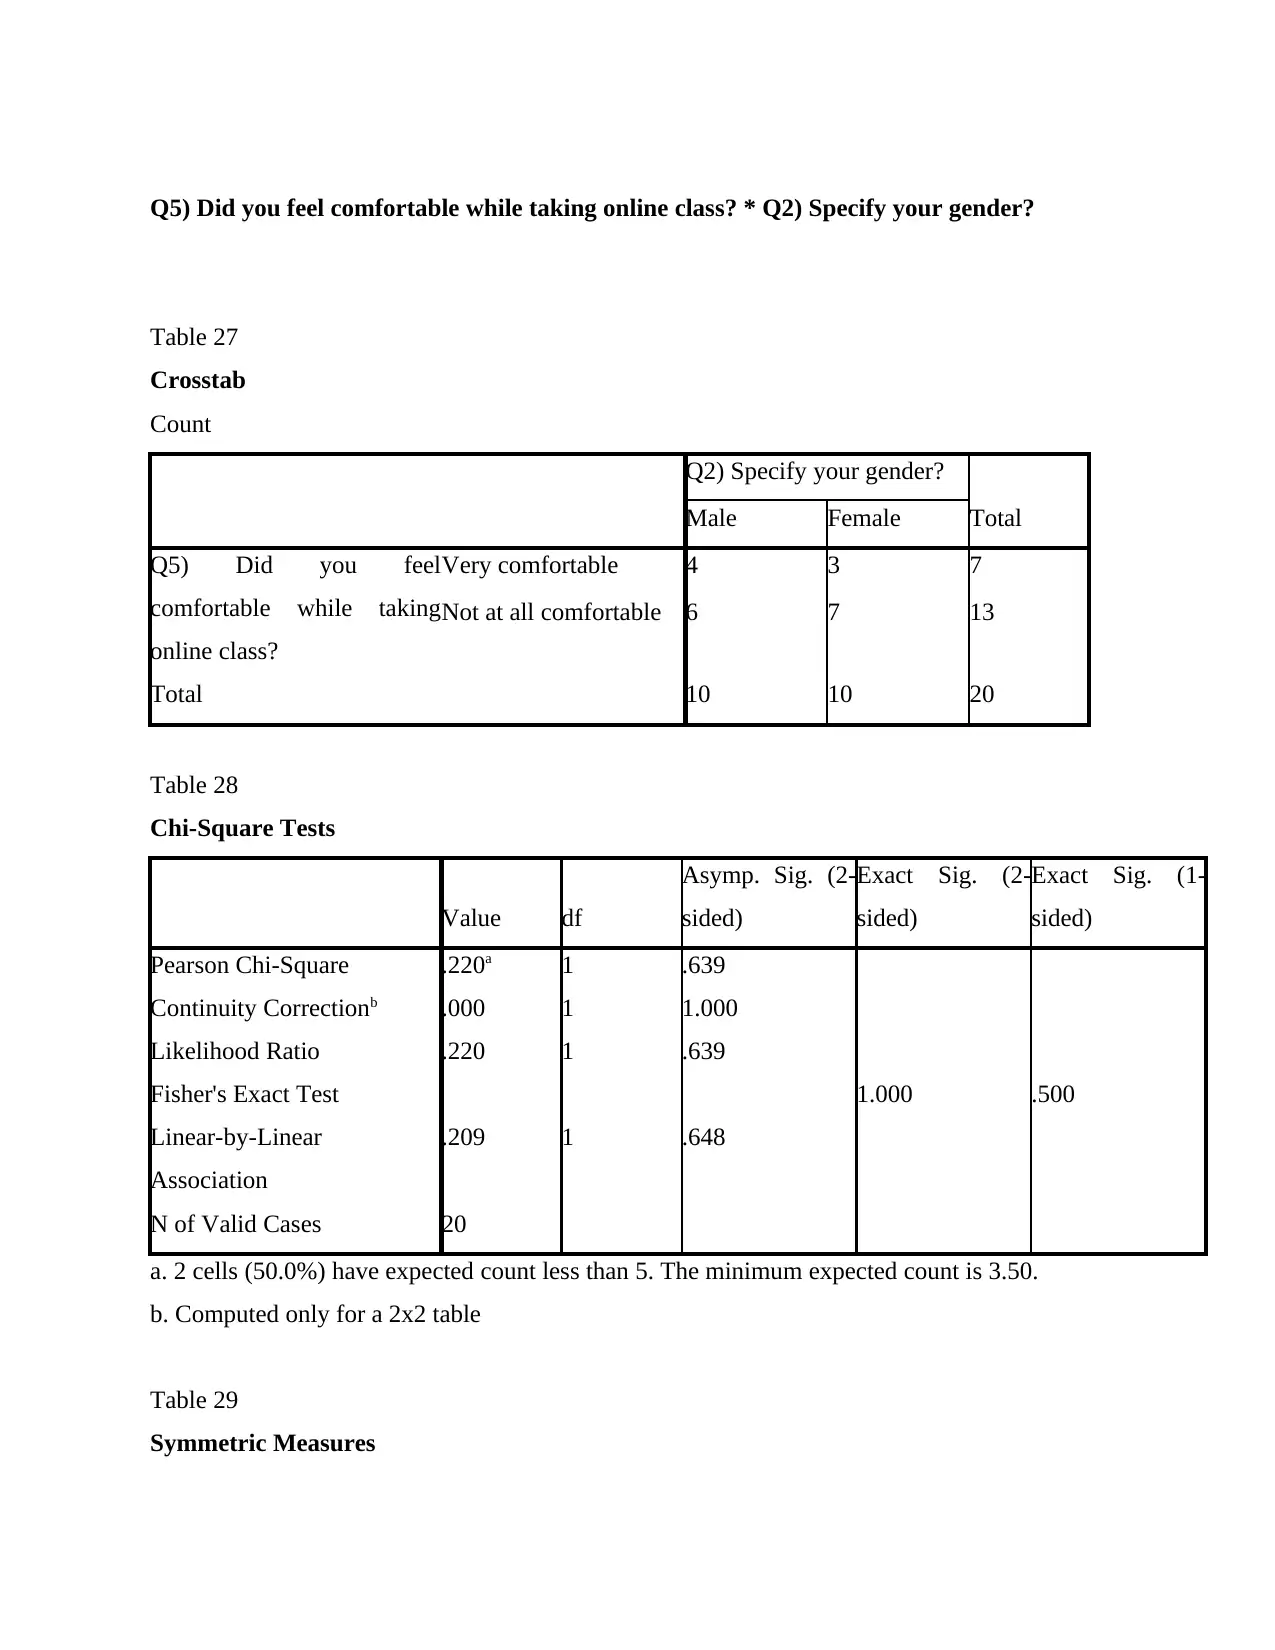
Q5) Did you feel comfortable while taking online class? * Q2) Specify your gender?
Table 27
Crosstab
Count
Q2) Specify your gender?
TotalMale Female
Q5) Did you feel
comfortable while taking
online class?
Very comfortable 4 3 7
Not at all comfortable 6 7 13
Total 10 10 20
Table 28
Chi-Square Tests
Value df
Asymp. Sig. (2-
sided)
Exact Sig. (2-
sided)
Exact Sig. (1-
sided)
Pearson Chi-Square .220a 1 .639
Continuity Correctionb .000 1 1.000
Likelihood Ratio .220 1 .639
Fisher's Exact Test 1.000 .500
Linear-by-Linear
Association
.209 1 .648
N of Valid Cases 20
a. 2 cells (50.0%) have expected count less than 5. The minimum expected count is 3.50.
b. Computed only for a 2x2 table
Table 29
Symmetric Measures
Value
Asymp. Std.
Errora Approx. Tb Approx. Sig.
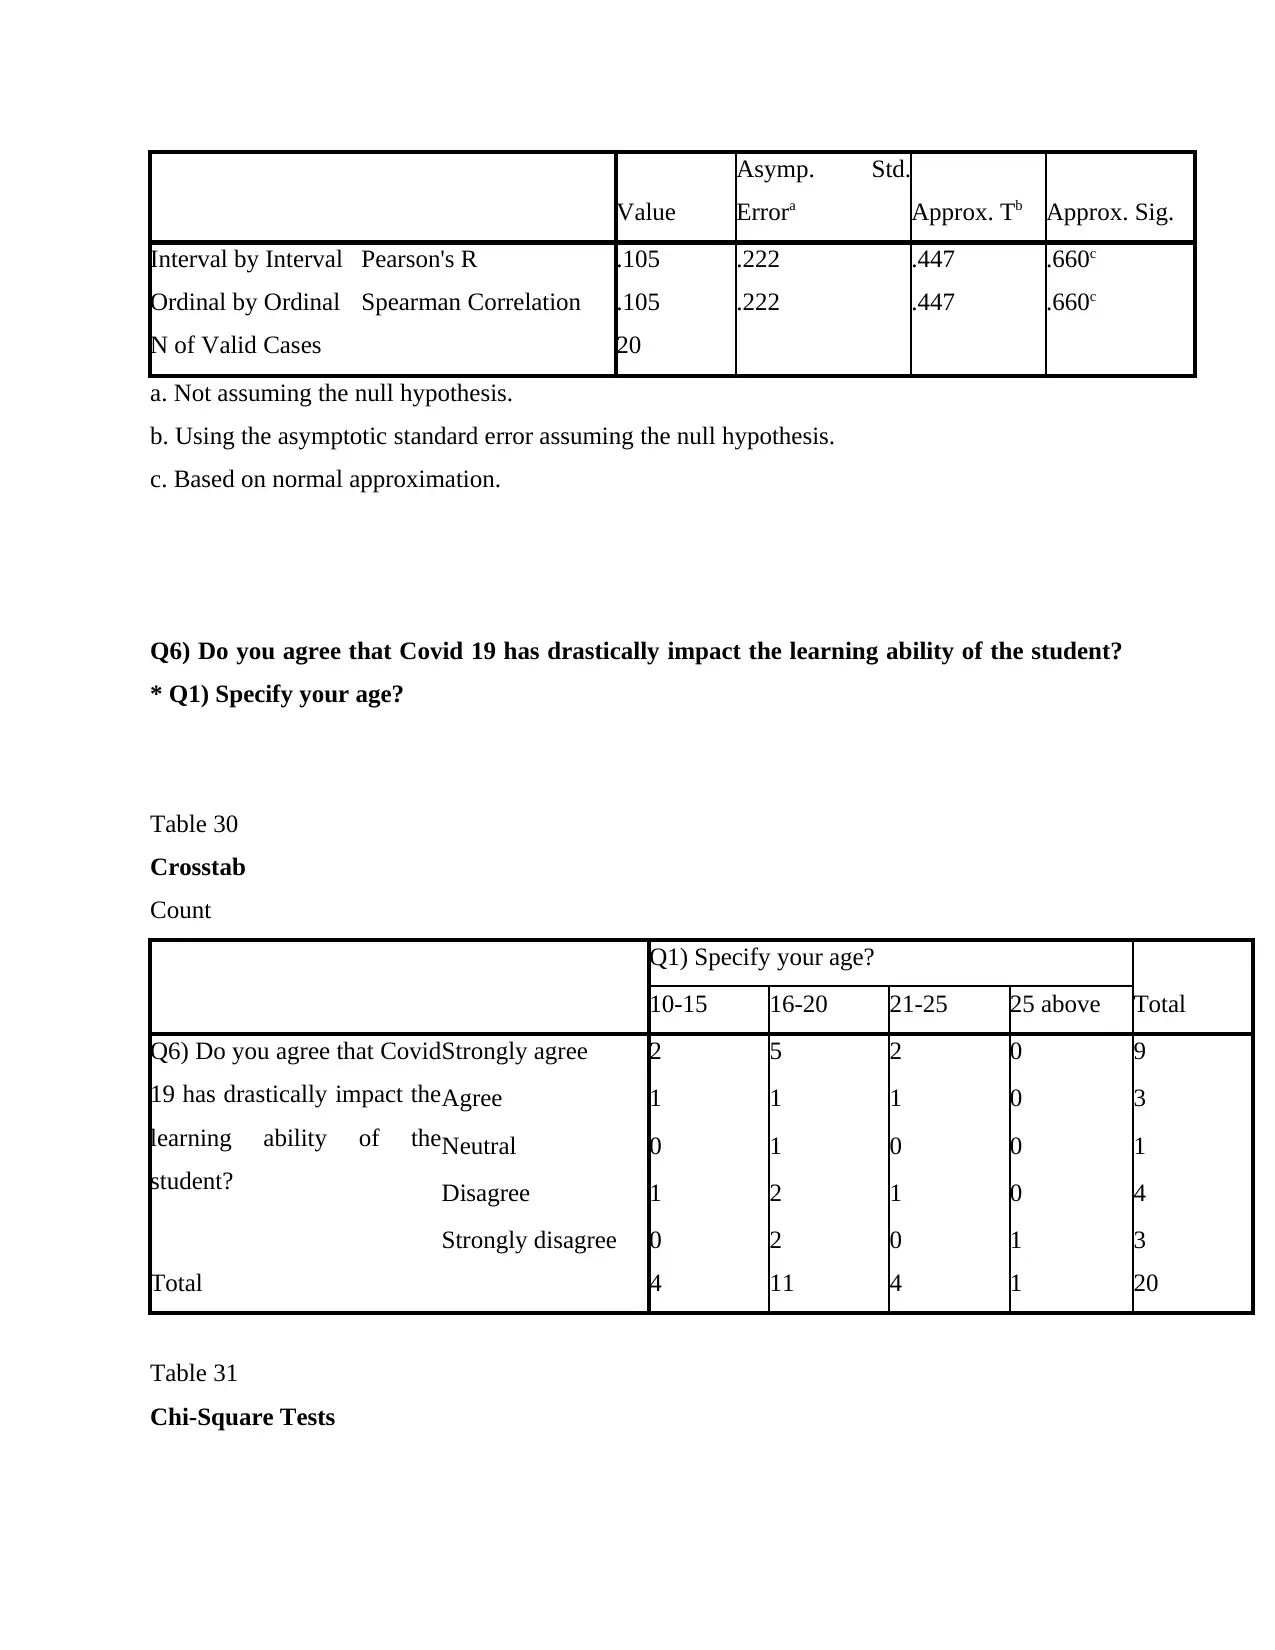
Interval by Interval Pearson's R .105 .222 .447 .660c
Ordinal by Ordinal Spearman Correlation .105 .222 .447 .660c
N of Valid Cases 20
a. Not assuming the null hypothesis.
b. Using the asymptotic standard error assuming the null hypothesis.
c. Based on normal approximation.
Q6) Do you agree that Covid 19 has drastically impact the learning ability of the student?
* Q1) Specify your age?
Table 30
Crosstab
Count
Q1) Specify your age?
Total10-15 16-20 21-25 25 above
Q6) Do you agree that Covid
19 has drastically impact the
learning ability of the
student?
Strongly agree 2 5 2 0 9
Agree 1 1 1 0 3
Neutral 0 1 0 0 1
Disagree 1 2 1 0 4
Strongly disagree 0 2 0 1 3
Total 4 11 4 1 20
Table 31
Chi-Square Tests
Asymp. Std.
Errora Approx. Tb Approx. Sig.
Interval by Interval Pearson's R .105 .222 .447 .660c
Ordinal by Ordinal Spearman Correlation .105 .222 .447 .660c
N of Valid Cases 20
a. Not assuming the null hypothesis.
b. Using the asymptotic standard error assuming the null hypothesis.
c. Based on normal approximation.
Q6) Do you agree that Covid 19 has drastically impact the learning ability of the student?
* Q1) Specify your age?
Table 30
Crosstab
Count
Q1) Specify your age?
Total10-15 16-20 21-25 25 above
Q6) Do you agree that Covid
19 has drastically impact the
learning ability of the
student?
Strongly agree 2 5 2 0 9
Agree 1 1 1 0 3
Neutral 0 1 0 0 1
Disagree 1 2 1 0 4
Strongly disagree 0 2 0 1 3
Total 4 11 4 1 20
Table 31
Chi-Square Tests
Paraphrase This Document
Need a fresh take? Get an instant paraphrase of this document with our AI Paraphraser
Value df
Asymp. Sig. (2-
sided)
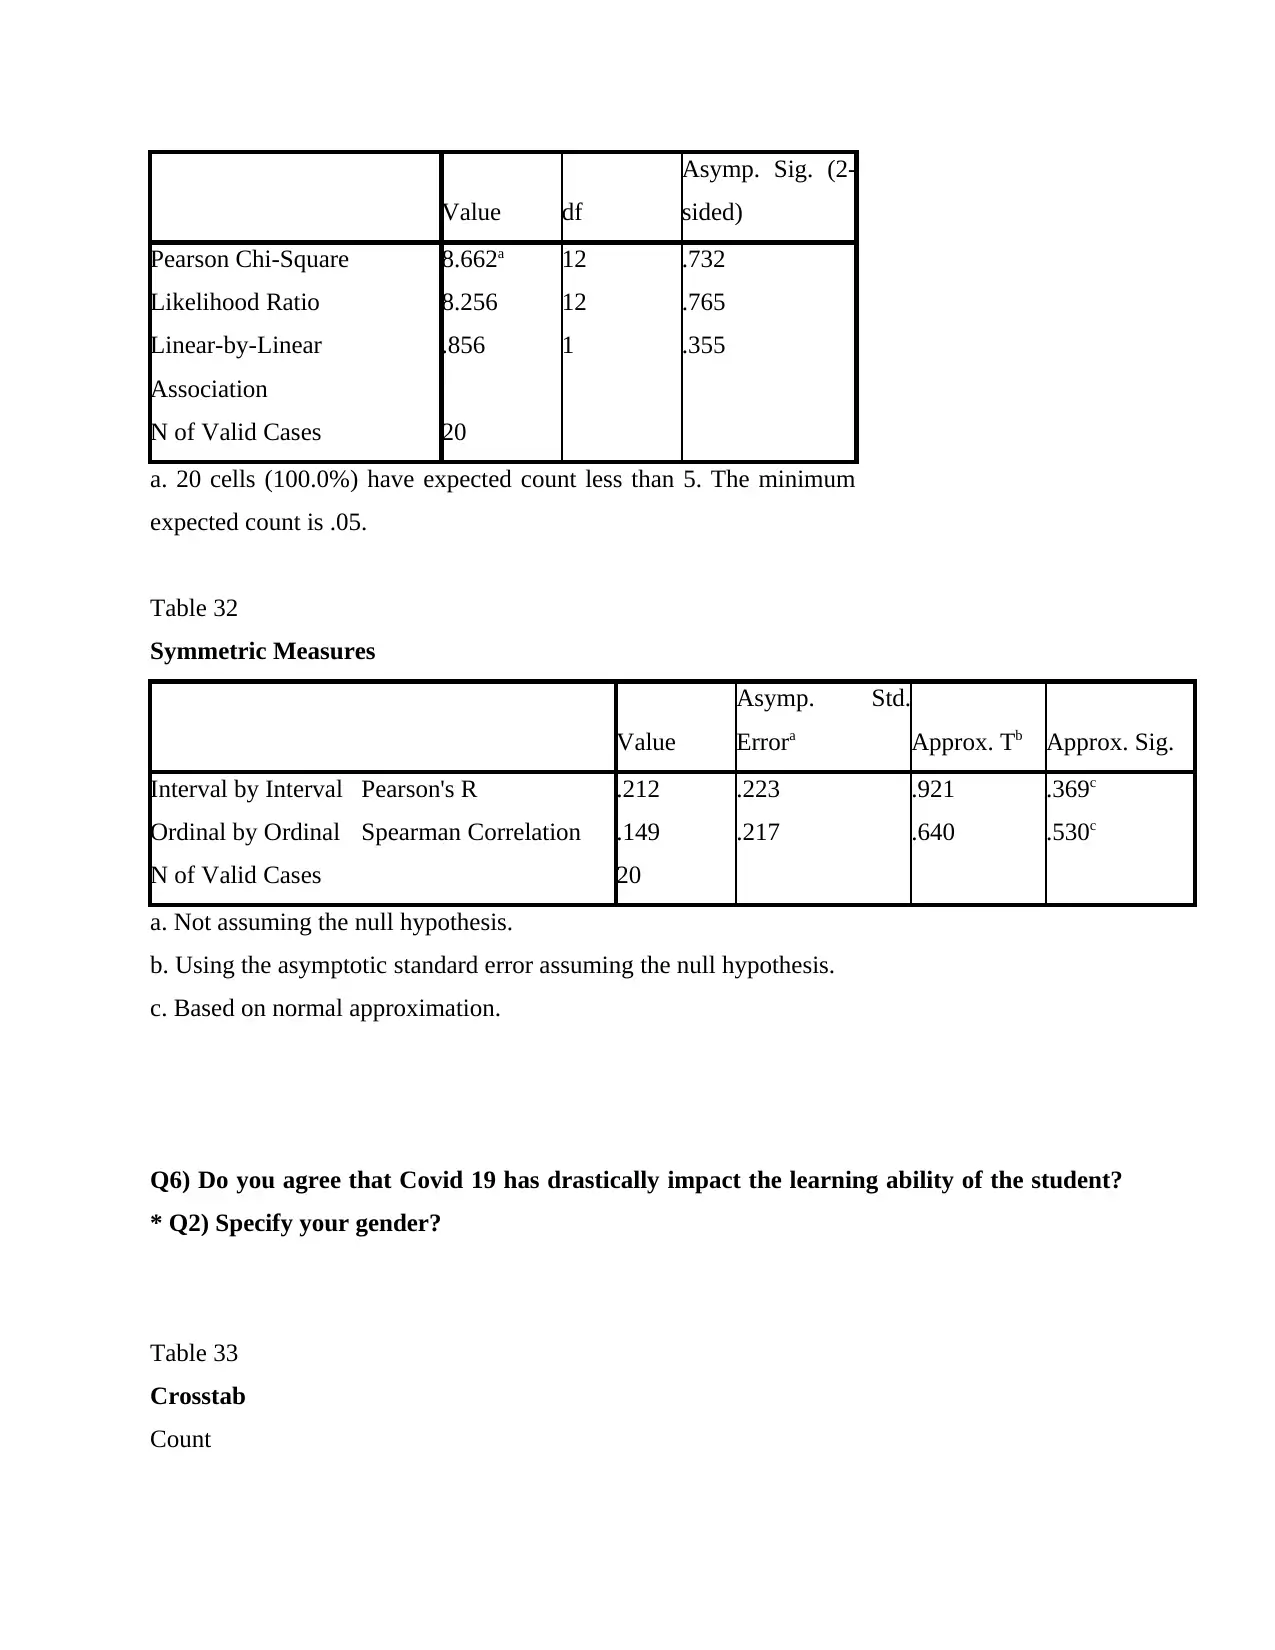
Pearson Chi-Square 8.662a 12 .732
Likelihood Ratio 8.256 12 .765
Linear-by-Linear
Association
.856 1 .355
N of Valid Cases 20
a. 20 cells (100.0%) have expected count less than 5. The minimum
expected count is .05.
Table 32
Symmetric Measures
Value
Asymp. Std.
Errora Approx. Tb Approx. Sig.
Interval by Interval Pearson's R .212 .223 .921 .369c
Ordinal by Ordinal Spearman Correlation .149 .217 .640 .530c
N of Valid Cases 20
a. Not assuming the null hypothesis.
b. Using the asymptotic standard error assuming the null hypothesis.
c. Based on normal approximation.
Q6) Do you agree that Covid 19 has drastically impact the learning ability of the student?
* Q2) Specify your gender?
Table 33
Crosstab
Count
Asymp. Sig. (2-
sided)
Pearson Chi-Square 8.662a 12 .732
Likelihood Ratio 8.256 12 .765
Linear-by-Linear
Association
.856 1 .355
N of Valid Cases 20
a. 20 cells (100.0%) have expected count less than 5. The minimum
expected count is .05.
Table 32
Symmetric Measures
Value
Asymp. Std.
Errora Approx. Tb Approx. Sig.
Interval by Interval Pearson's R .212 .223 .921 .369c
Ordinal by Ordinal Spearman Correlation .149 .217 .640 .530c
N of Valid Cases 20
a. Not assuming the null hypothesis.
b. Using the asymptotic standard error assuming the null hypothesis.
c. Based on normal approximation.
Q6) Do you agree that Covid 19 has drastically impact the learning ability of the student?
* Q2) Specify your gender?
Table 33
Crosstab
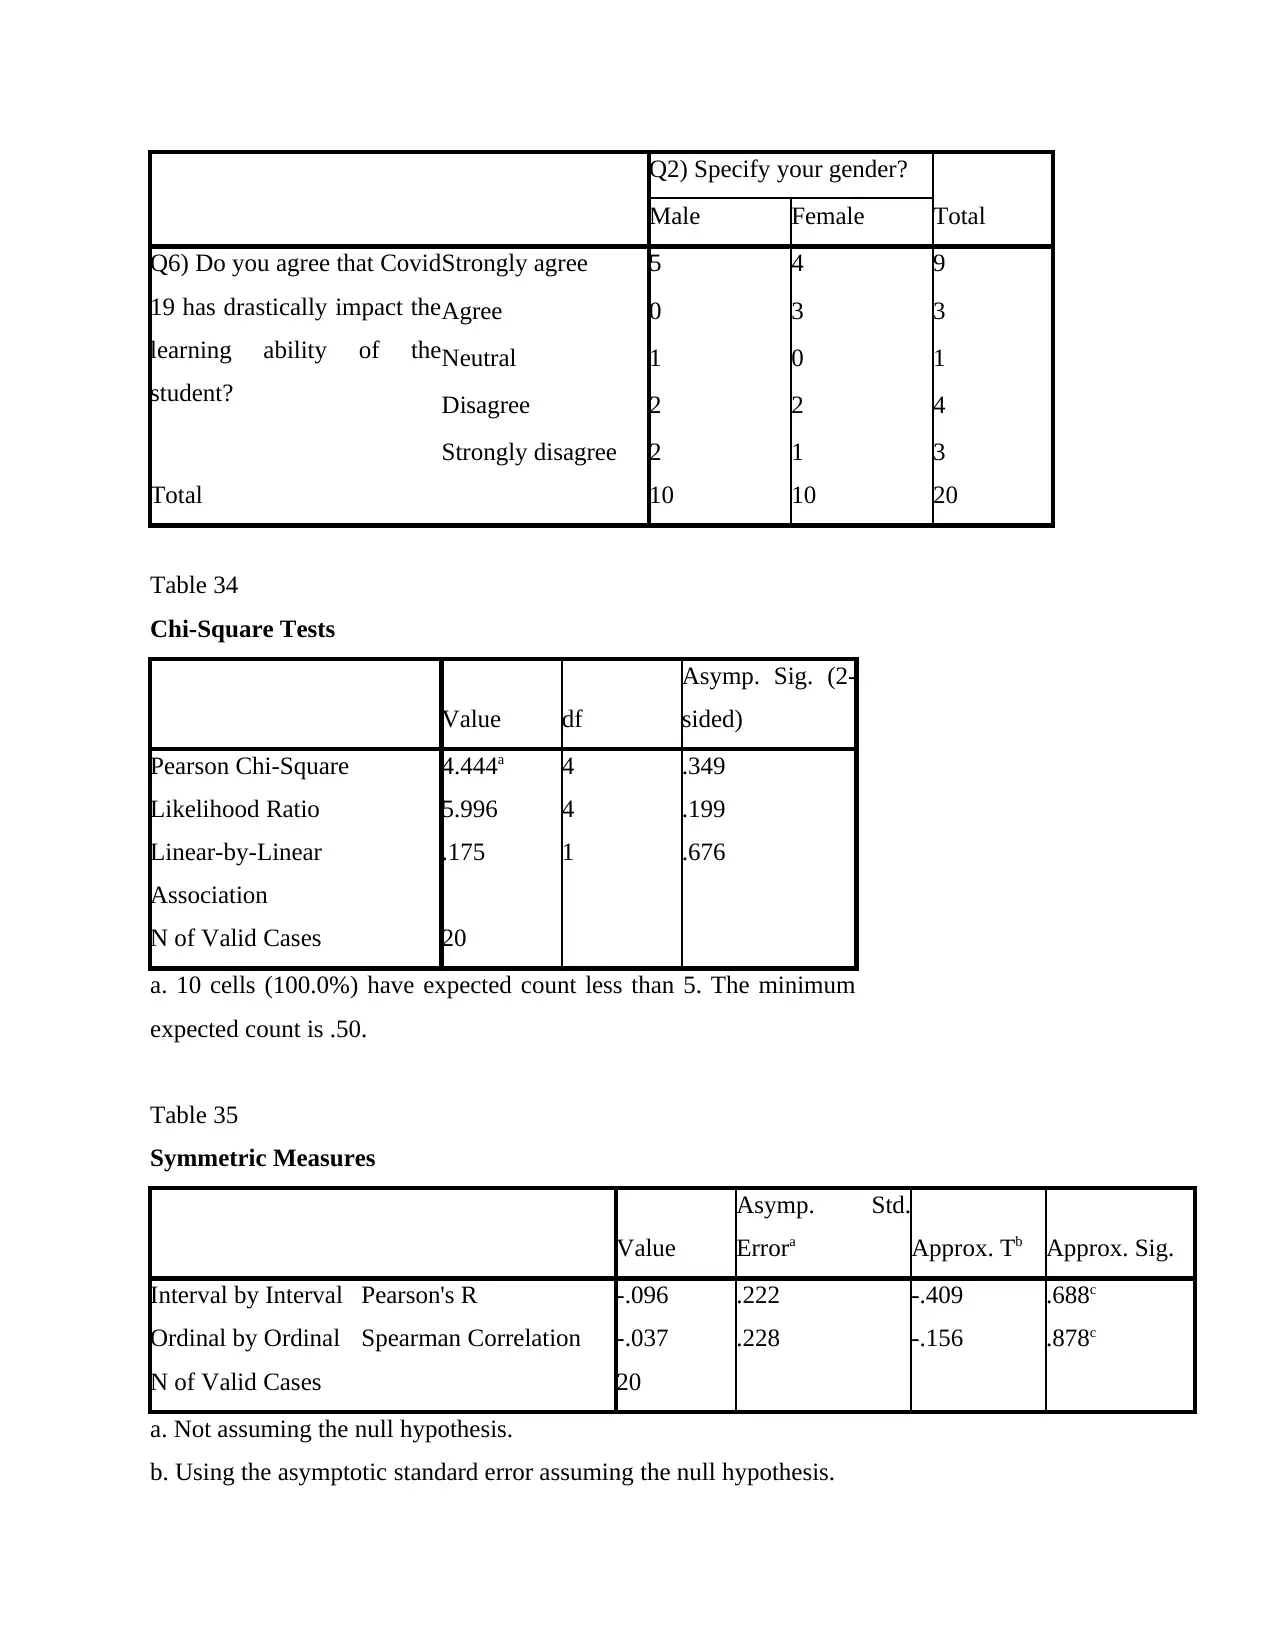
Count
Q2) Specify your gender?
TotalMale Female
Q6) Do you agree that Covid
19 has drastically impact the
learning ability of the
student?
Strongly agree 5 4 9
Agree 0 3 3
Neutral 1 0 1
Disagree 2 2 4
Strongly disagree 2 1 3
Total 10 10 20
Table 34
Chi-Square Tests
Value df
Asymp. Sig. (2-
sided)
Pearson Chi-Square 4.444a 4 .349
Likelihood Ratio 5.996 4 .199
Linear-by-Linear
Association
.175 1 .676
N of Valid Cases 20
a. 10 cells (100.0%) have expected count less than 5. The minimum
expected count is .50.
Table 35
Symmetric Measures
Value
Asymp. Std.
Errora Approx. Tb Approx. Sig.
Interval by Interval Pearson's R -.096 .222 -.409 .688c
Ordinal by Ordinal Spearman Correlation -.037 .228 -.156 .878c
N of Valid Cases 20
a. Not assuming the null hypothesis.
b. Using the asymptotic standard error assuming the null hypothesis.
c. Based on normal approximation.
Q7) Does the Covid 19 increase the Stress among the student about their study? * Q1)
Specify your age?
Table 36
Crosstab
Count
Q1) Specify your age?
Total10-15 16-20 21-25 25 above
Q7) Does the Covid 19
increase the Stress among
the student about their
study?
Yes 1 11 0 0 12
No 3 0 4 1 8
Total 4 11 4 1 20
Table 37
Chi-Square Tests
Value df
Asymp. Sig. (2-
sided)
Pearson Chi-Square 16.875a 3 .001
Likelihood Ratio 22.422 3 .000
Linear-by-Linear
Association
1.624 1 .203
N of Valid Cases 20
a. 7 cells (87.5%) have expected count less than 5. The minimum
expected count is .40.
Secure Best Marks with AI Grader
Need help grading? Try our AI Grader for instant feedback on your assignments.
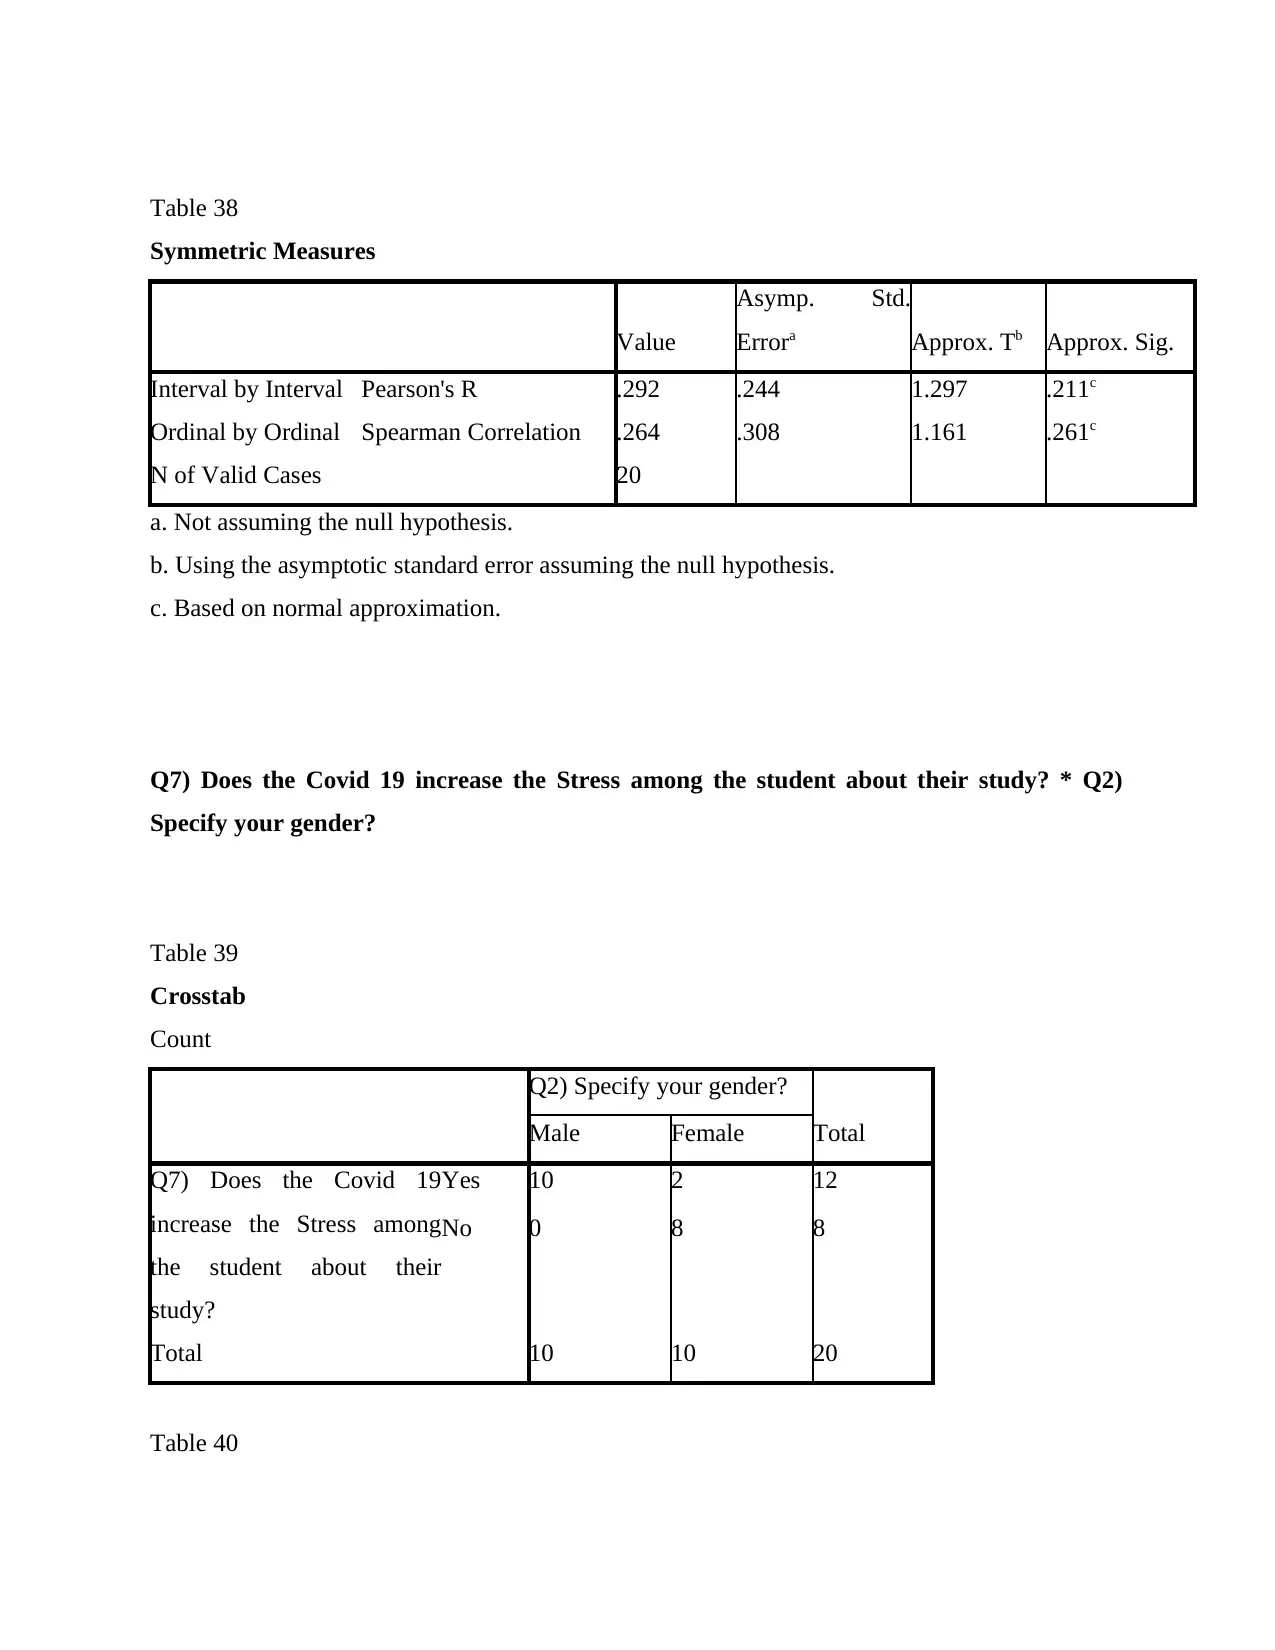
Table 38
Symmetric Measures
Value
Asymp. Std.
Errora Approx. Tb Approx. Sig.
Interval by Interval Pearson's R .292 .244 1.297 .211c
Ordinal by Ordinal Spearman Correlation .264 .308 1.161 .261c
N of Valid Cases 20
a. Not assuming the null hypothesis.
b. Using the asymptotic standard error assuming the null hypothesis.
c. Based on normal approximation.
Q7) Does the Covid 19 increase the Stress among the student about their study? * Q2)
Specify your gender?
Table 39
Crosstab
Count
Q2) Specify your gender?
TotalMale Female
Q7) Does the Covid 19
increase the Stress among
the student about their
study?
Yes 10 2 12
No 0 8 8
Total 10 10 20
Table 40
Chi-Square Tests
Value df
Asymp. Sig. (2-
sided)
Exact Sig. (2-
sided)
Exact Sig. (1-
sided)
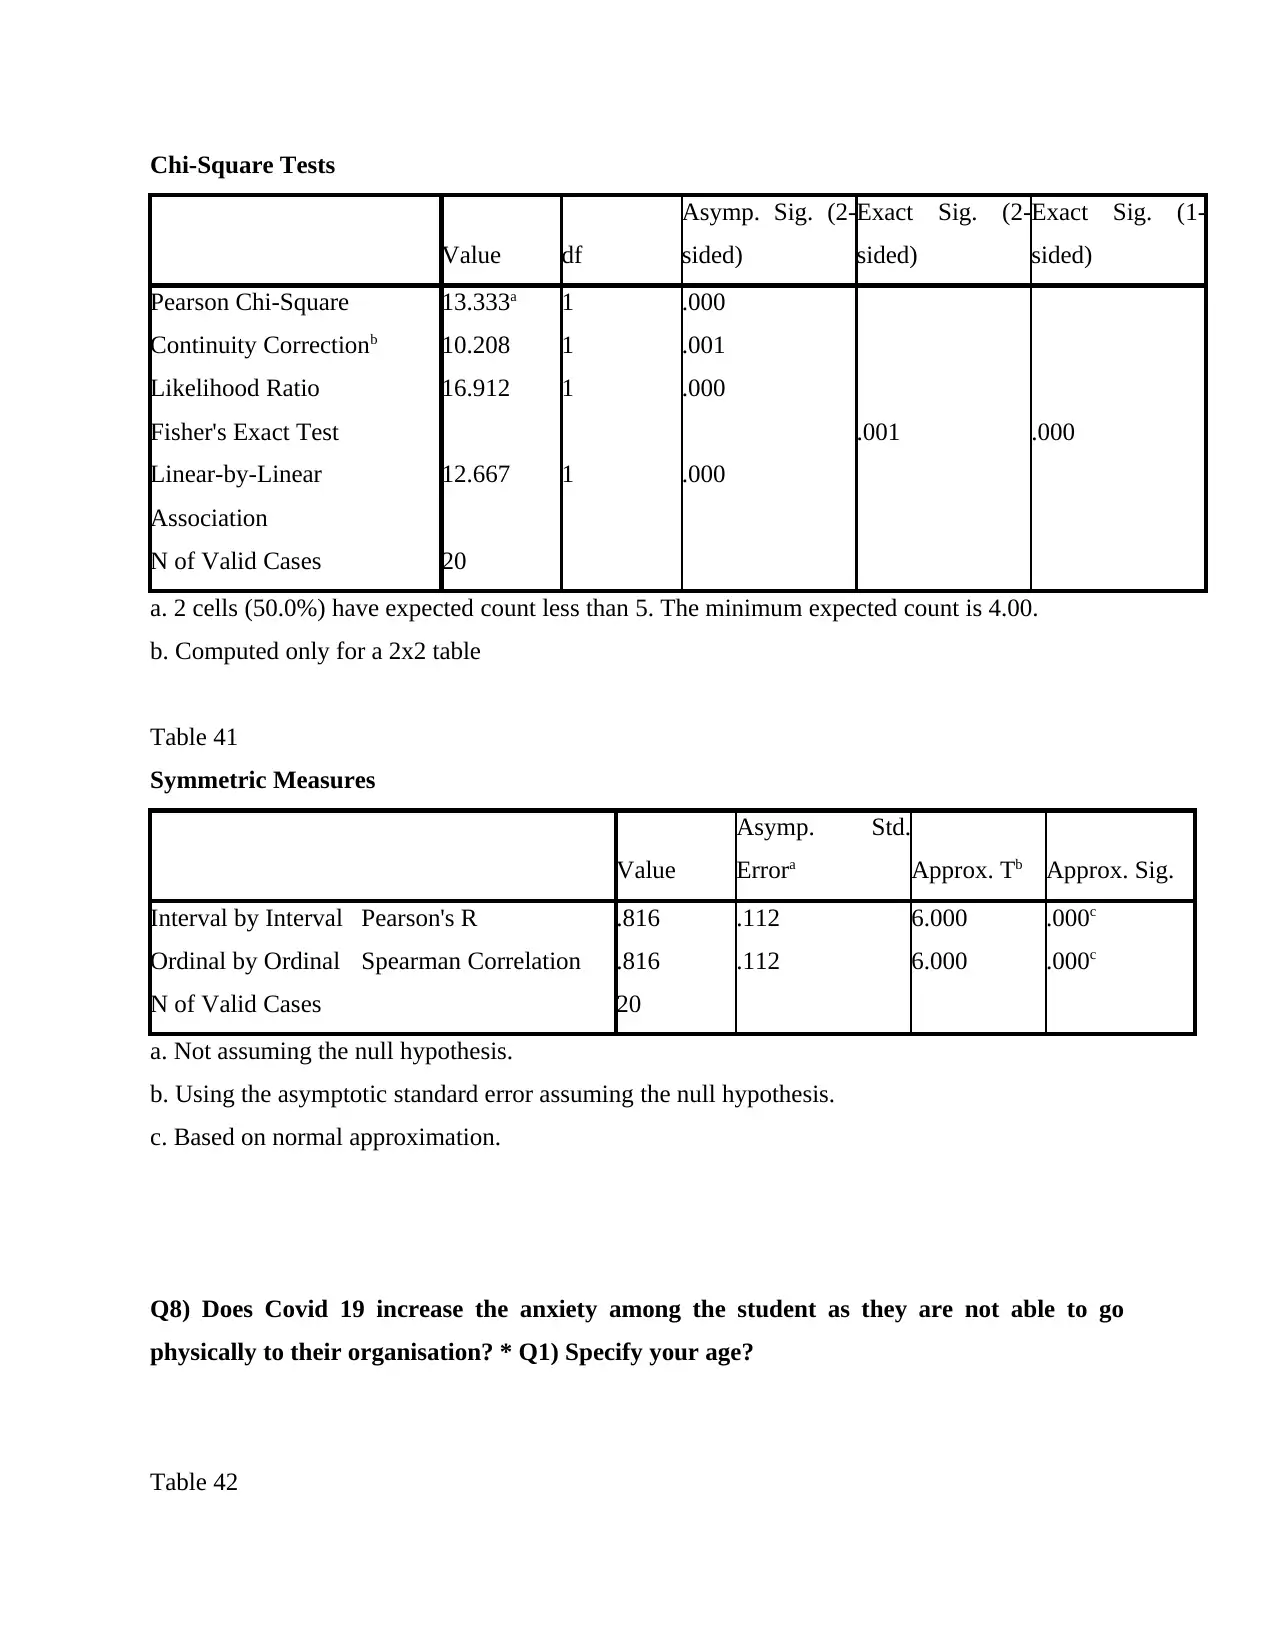
Pearson Chi-Square 13.333a 1 .000
Continuity Correctionb 10.208 1 .001
Likelihood Ratio 16.912 1 .000
Fisher's Exact Test .001 .000
Linear-by-Linear
Association
12.667 1 .000
N of Valid Cases 20
a. 2 cells (50.0%) have expected count less than 5. The minimum expected count is 4.00.
b. Computed only for a 2x2 table
Table 41
Symmetric Measures
Value
Asymp. Std.
Errora Approx. Tb Approx. Sig.
Interval by Interval Pearson's R .816 .112 6.000 .000c
Ordinal by Ordinal Spearman Correlation .816 .112 6.000 .000c
N of Valid Cases 20
a. Not assuming the null hypothesis.
b. Using the asymptotic standard error assuming the null hypothesis.
c. Based on normal approximation.
Q8) Does Covid 19 increase the anxiety among the student as they are not able to go
physically to their organisation? * Q1) Specify your age?
Table 42
Value df
Asymp. Sig. (2-
sided)
Exact Sig. (2-
sided)
Exact Sig. (1-
sided)
Pearson Chi-Square 13.333a 1 .000
Continuity Correctionb 10.208 1 .001
Likelihood Ratio 16.912 1 .000
Fisher's Exact Test .001 .000
Linear-by-Linear
Association
12.667 1 .000
N of Valid Cases 20
a. 2 cells (50.0%) have expected count less than 5. The minimum expected count is 4.00.
b. Computed only for a 2x2 table
Table 41
Symmetric Measures
Value
Asymp. Std.
Errora Approx. Tb Approx. Sig.
Interval by Interval Pearson's R .816 .112 6.000 .000c
Ordinal by Ordinal Spearman Correlation .816 .112 6.000 .000c
N of Valid Cases 20
a. Not assuming the null hypothesis.
b. Using the asymptotic standard error assuming the null hypothesis.
c. Based on normal approximation.
Q8) Does Covid 19 increase the anxiety among the student as they are not able to go
physically to their organisation? * Q1) Specify your age?
Table 42
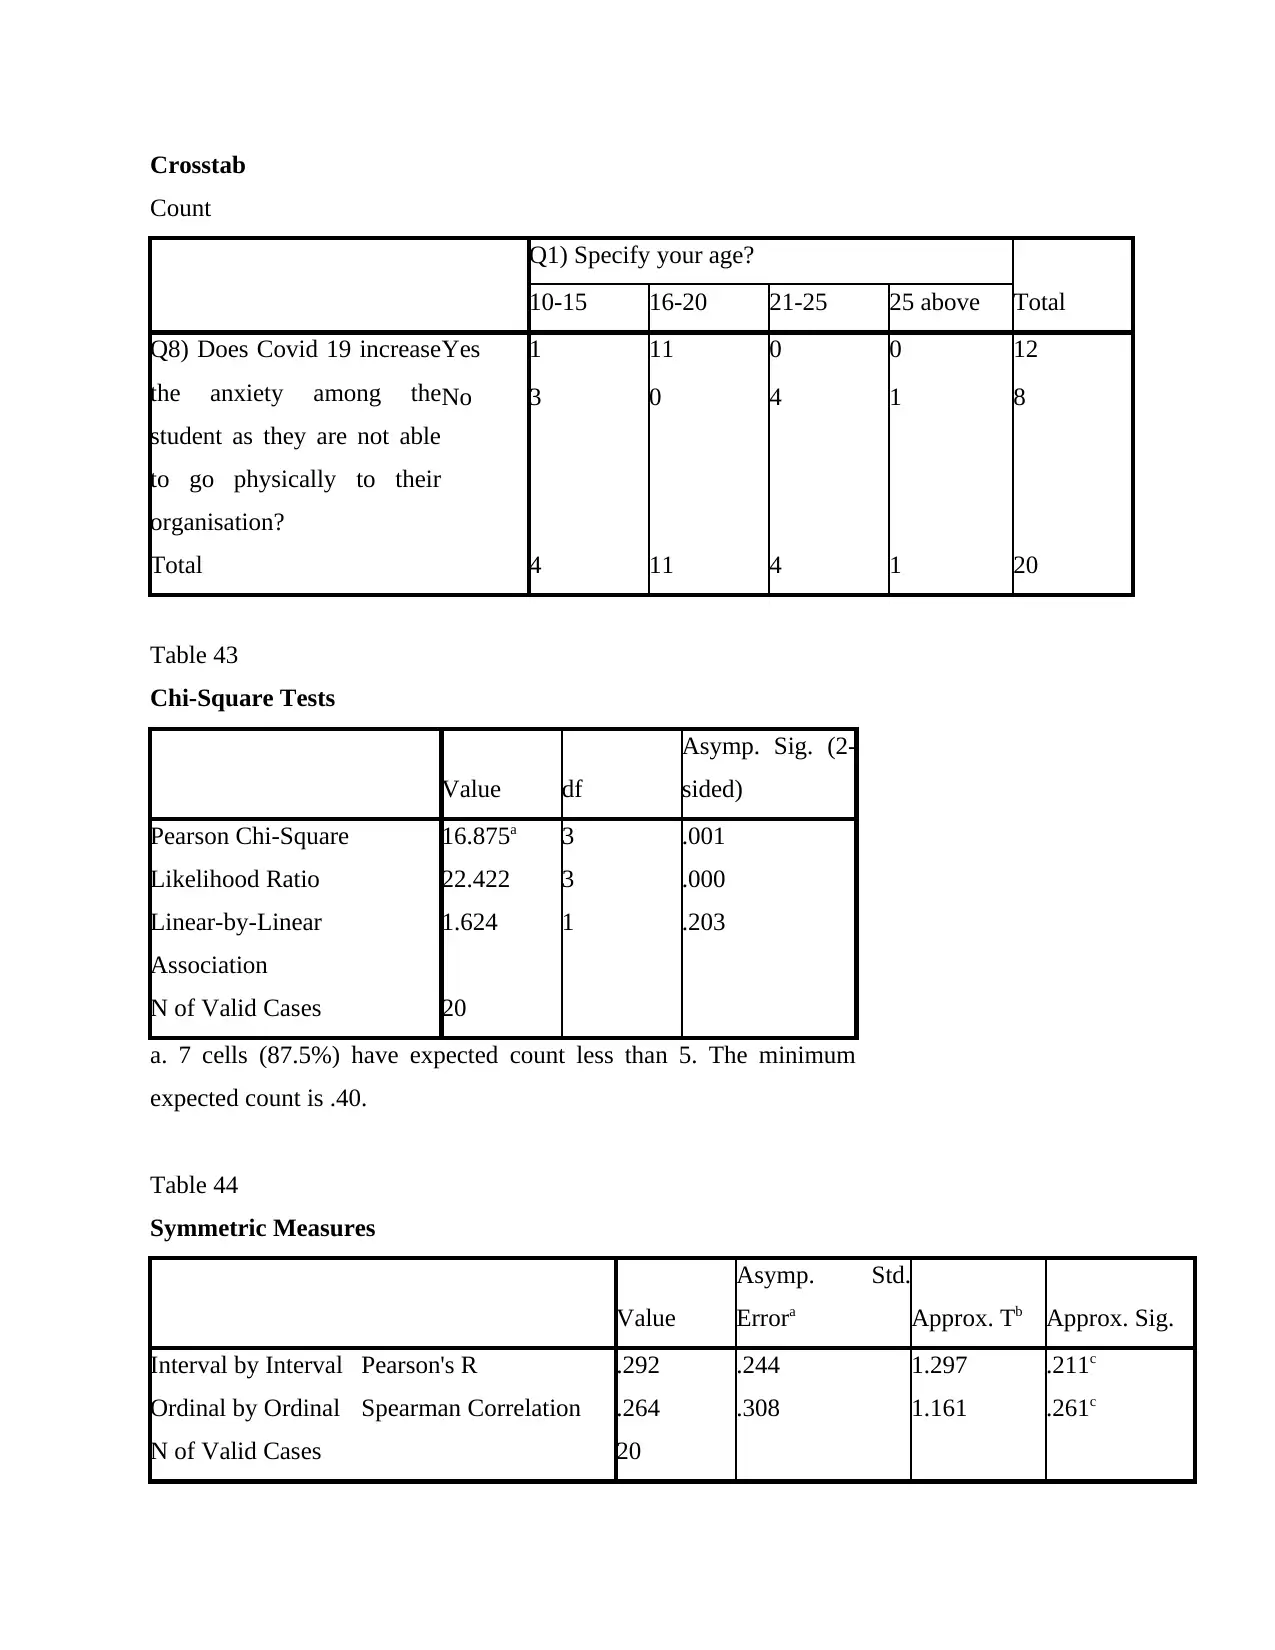
Crosstab
Count
Q1) Specify your age?
Total10-15 16-20 21-25 25 above
Q8) Does Covid 19 increase
the anxiety among the
student as they are not able
to go physically to their
organisation?
Yes 1 11 0 0 12
No 3 0 4 1 8
Total 4 11 4 1 20
Table 43
Chi-Square Tests
Value df
Asymp. Sig. (2-
sided)
Pearson Chi-Square 16.875a 3 .001
Likelihood Ratio 22.422 3 .000
Linear-by-Linear
Association
1.624 1 .203
N of Valid Cases 20
a. 7 cells (87.5%) have expected count less than 5. The minimum
expected count is .40.
Table 44
Symmetric Measures
Value
Asymp. Std.
Errora Approx. Tb Approx. Sig.
Interval by Interval Pearson's R .292 .244 1.297 .211c
Ordinal by Ordinal Spearman Correlation .264 .308 1.161 .261c
N of Valid Cases 20
Paraphrase This Document
Need a fresh take? Get an instant paraphrase of this document with our AI Paraphraser
a. Not assuming the null hypothesis.
b. Using the asymptotic standard error assuming the null hypothesis.
c. Based on normal approximation.
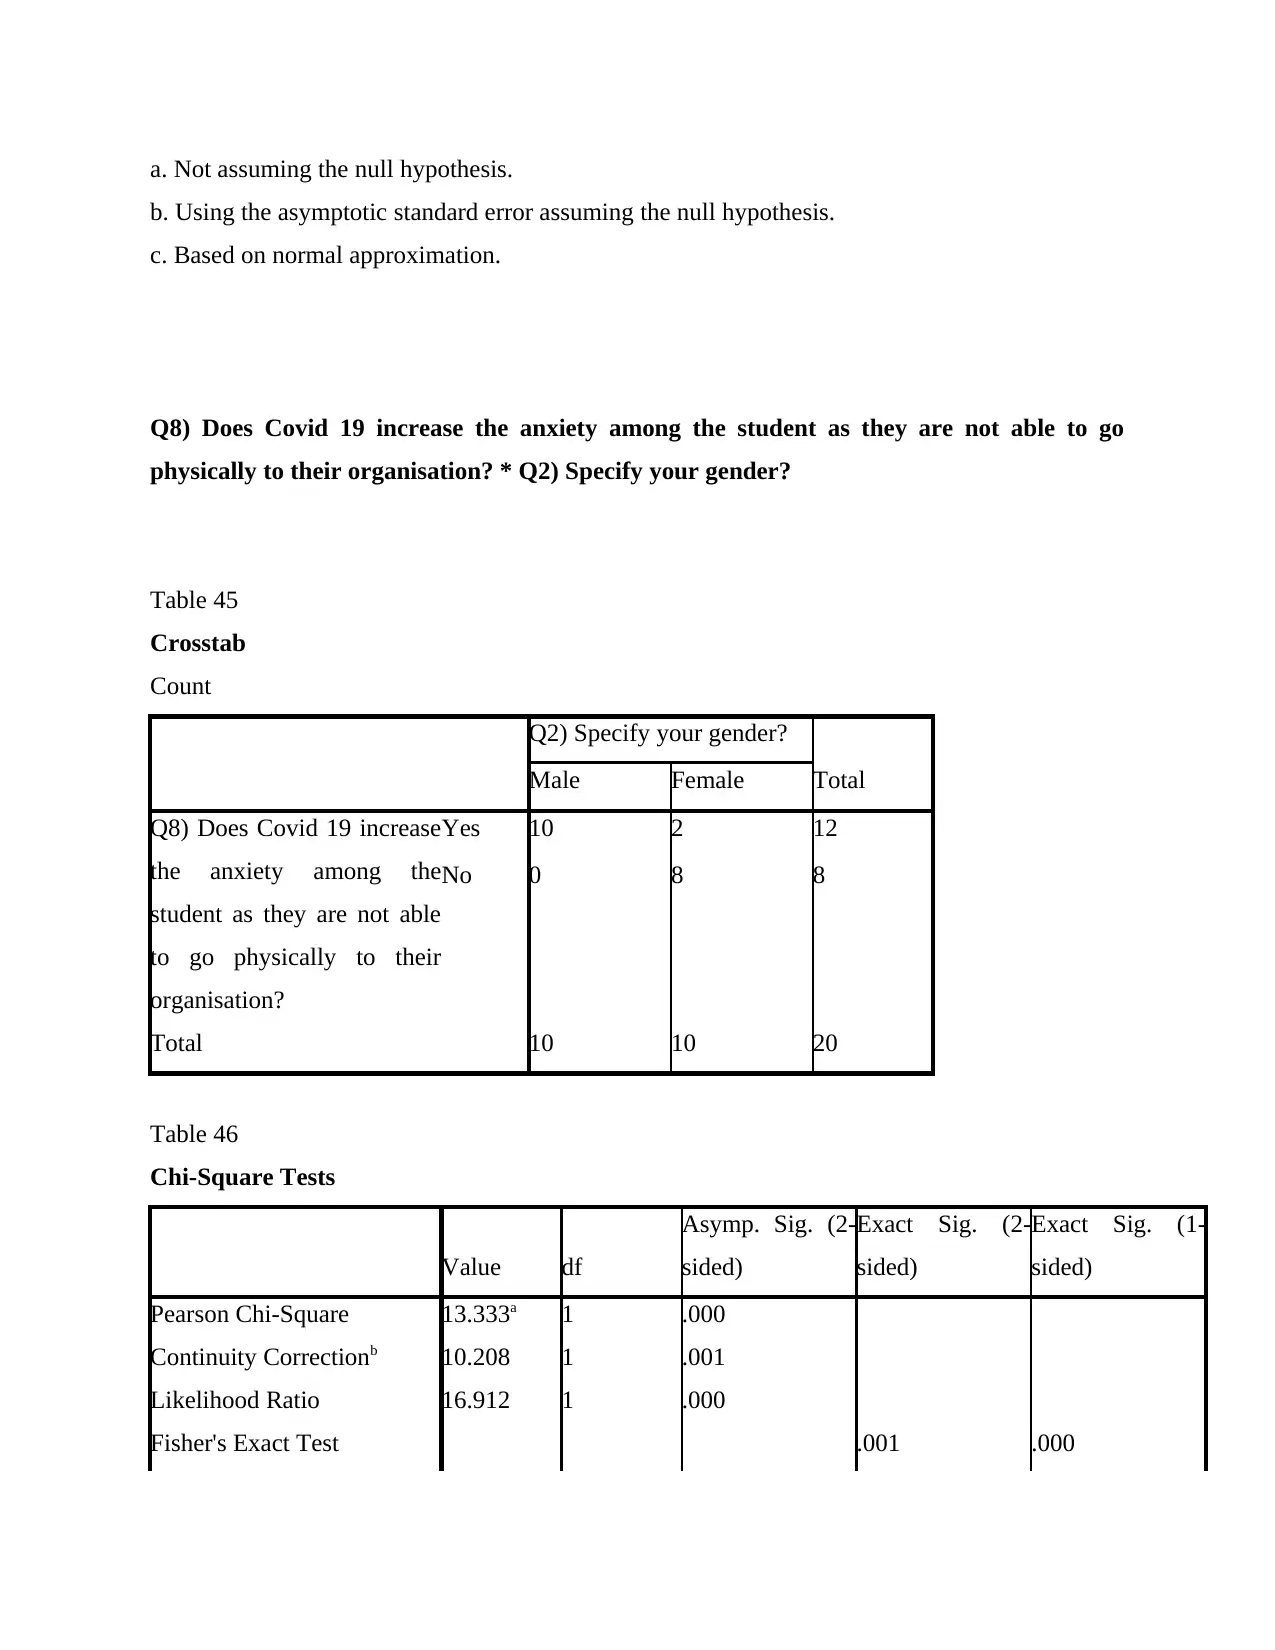
Q8) Does Covid 19 increase the anxiety among the student as they are not able to go
physically to their organisation? * Q2) Specify your gender?
Table 45
Crosstab
Count
Q2) Specify your gender?
TotalMale Female
Q8) Does Covid 19 increase
the anxiety among the
student as they are not able
to go physically to their
organisation?
Yes 10 2 12
No 0 8 8
Total 10 10 20
Table 46
Chi-Square Tests
Value df
Asymp. Sig. (2-
sided)
Exact Sig. (2-
sided)
Exact Sig. (1-
sided)
Pearson Chi-Square 13.333a 1 .000
Continuity Correctionb 10.208 1 .001
Likelihood Ratio 16.912 1 .000
Fisher's Exact Test .001 .000
b. Using the asymptotic standard error assuming the null hypothesis.
c. Based on normal approximation.
Q8) Does Covid 19 increase the anxiety among the student as they are not able to go
physically to their organisation? * Q2) Specify your gender?
Table 45
Crosstab
Count
Q2) Specify your gender?
TotalMale Female
Q8) Does Covid 19 increase
the anxiety among the
student as they are not able
to go physically to their
organisation?
Yes 10 2 12
No 0 8 8
Total 10 10 20
Table 46
Chi-Square Tests
Value df
Asymp. Sig. (2-
sided)
Exact Sig. (2-
sided)
Exact Sig. (1-
sided)
Pearson Chi-Square 13.333a 1 .000
Continuity Correctionb 10.208 1 .001
Likelihood Ratio 16.912 1 .000
Fisher's Exact Test .001 .000
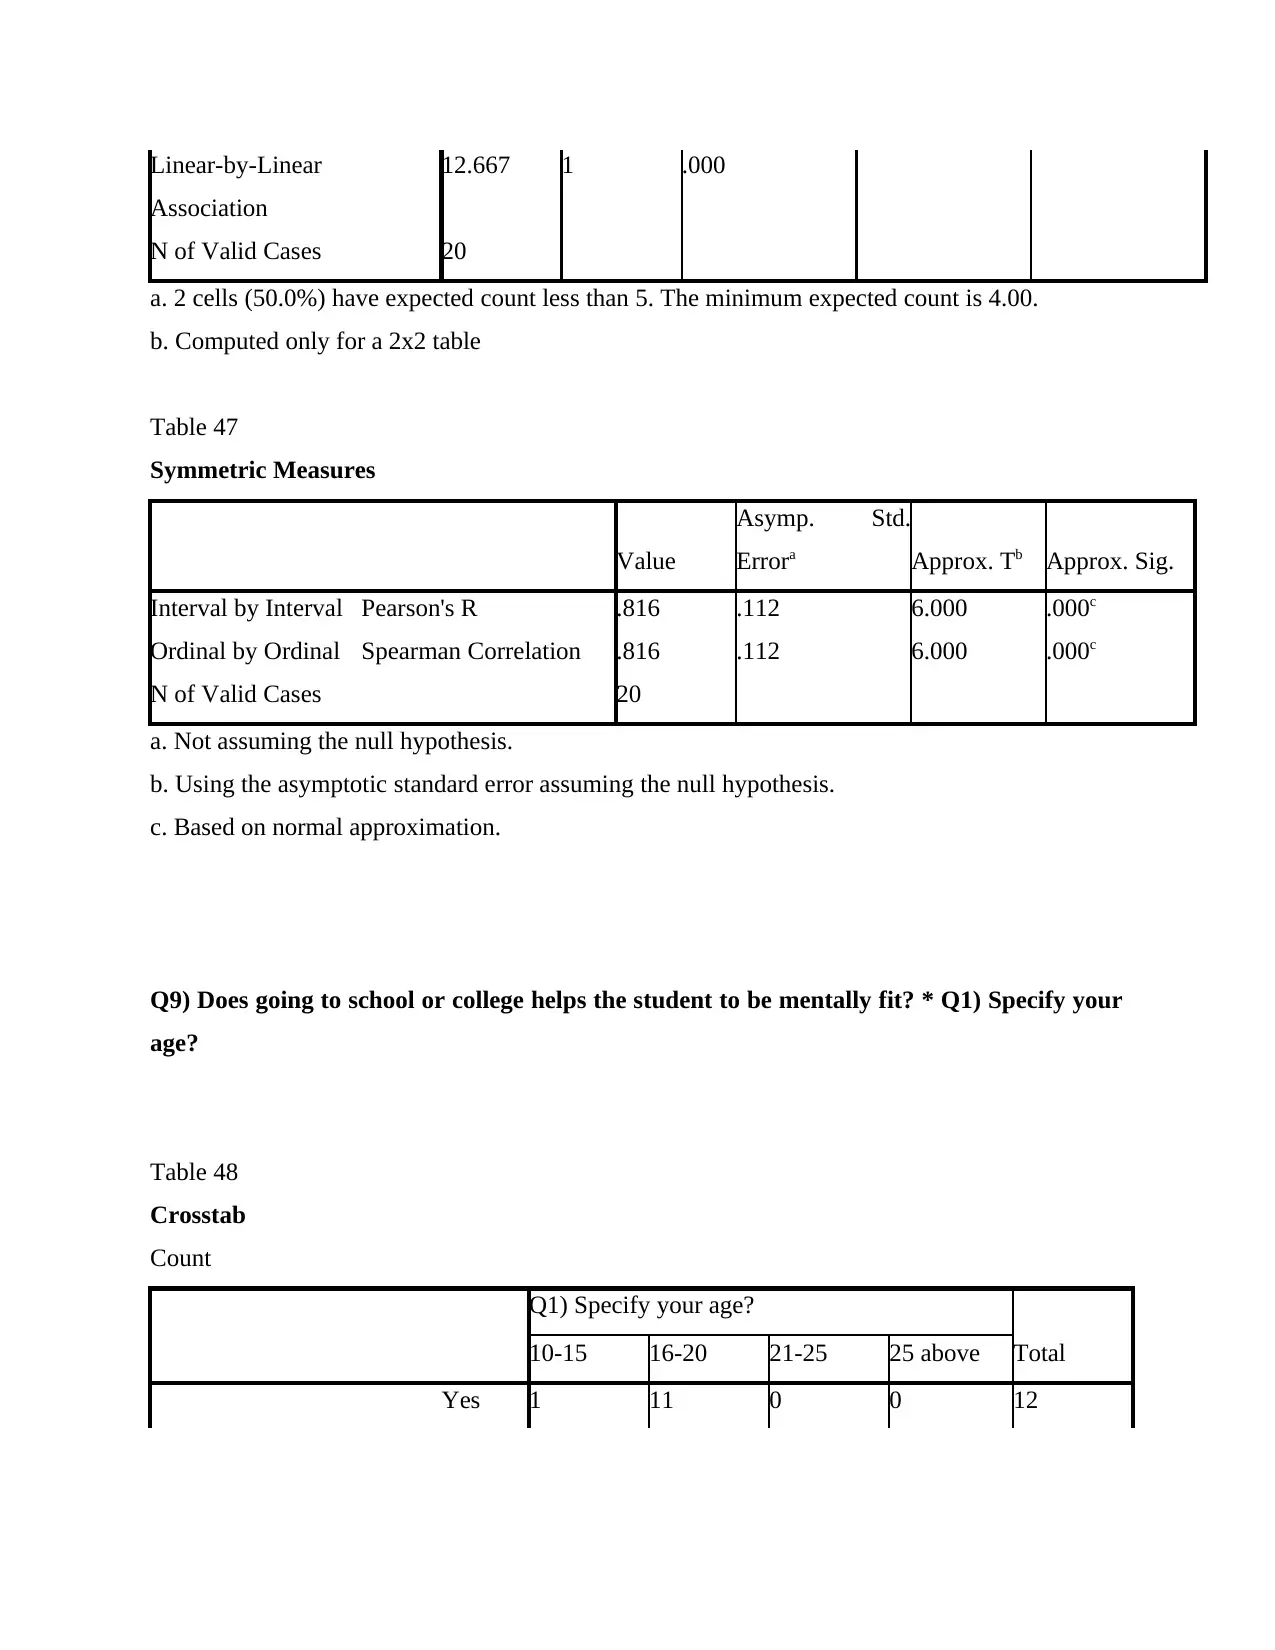
Linear-by-Linear
Association
12.667 1 .000
N of Valid Cases 20
a. 2 cells (50.0%) have expected count less than 5. The minimum expected count is 4.00.
b. Computed only for a 2x2 table
Table 47
Symmetric Measures
Value
Asymp. Std.
Errora Approx. Tb Approx. Sig.
Interval by Interval Pearson's R .816 .112 6.000 .000c
Ordinal by Ordinal Spearman Correlation .816 .112 6.000 .000c
N of Valid Cases 20
a. Not assuming the null hypothesis.
b. Using the asymptotic standard error assuming the null hypothesis.
c. Based on normal approximation.
Q9) Does going to school or college helps the student to be mentally fit? * Q1) Specify your
age?
Table 48
Crosstab
Count
Q1) Specify your age?
Total10-15 16-20 21-25 25 above
Yes 1 11 0 0 12
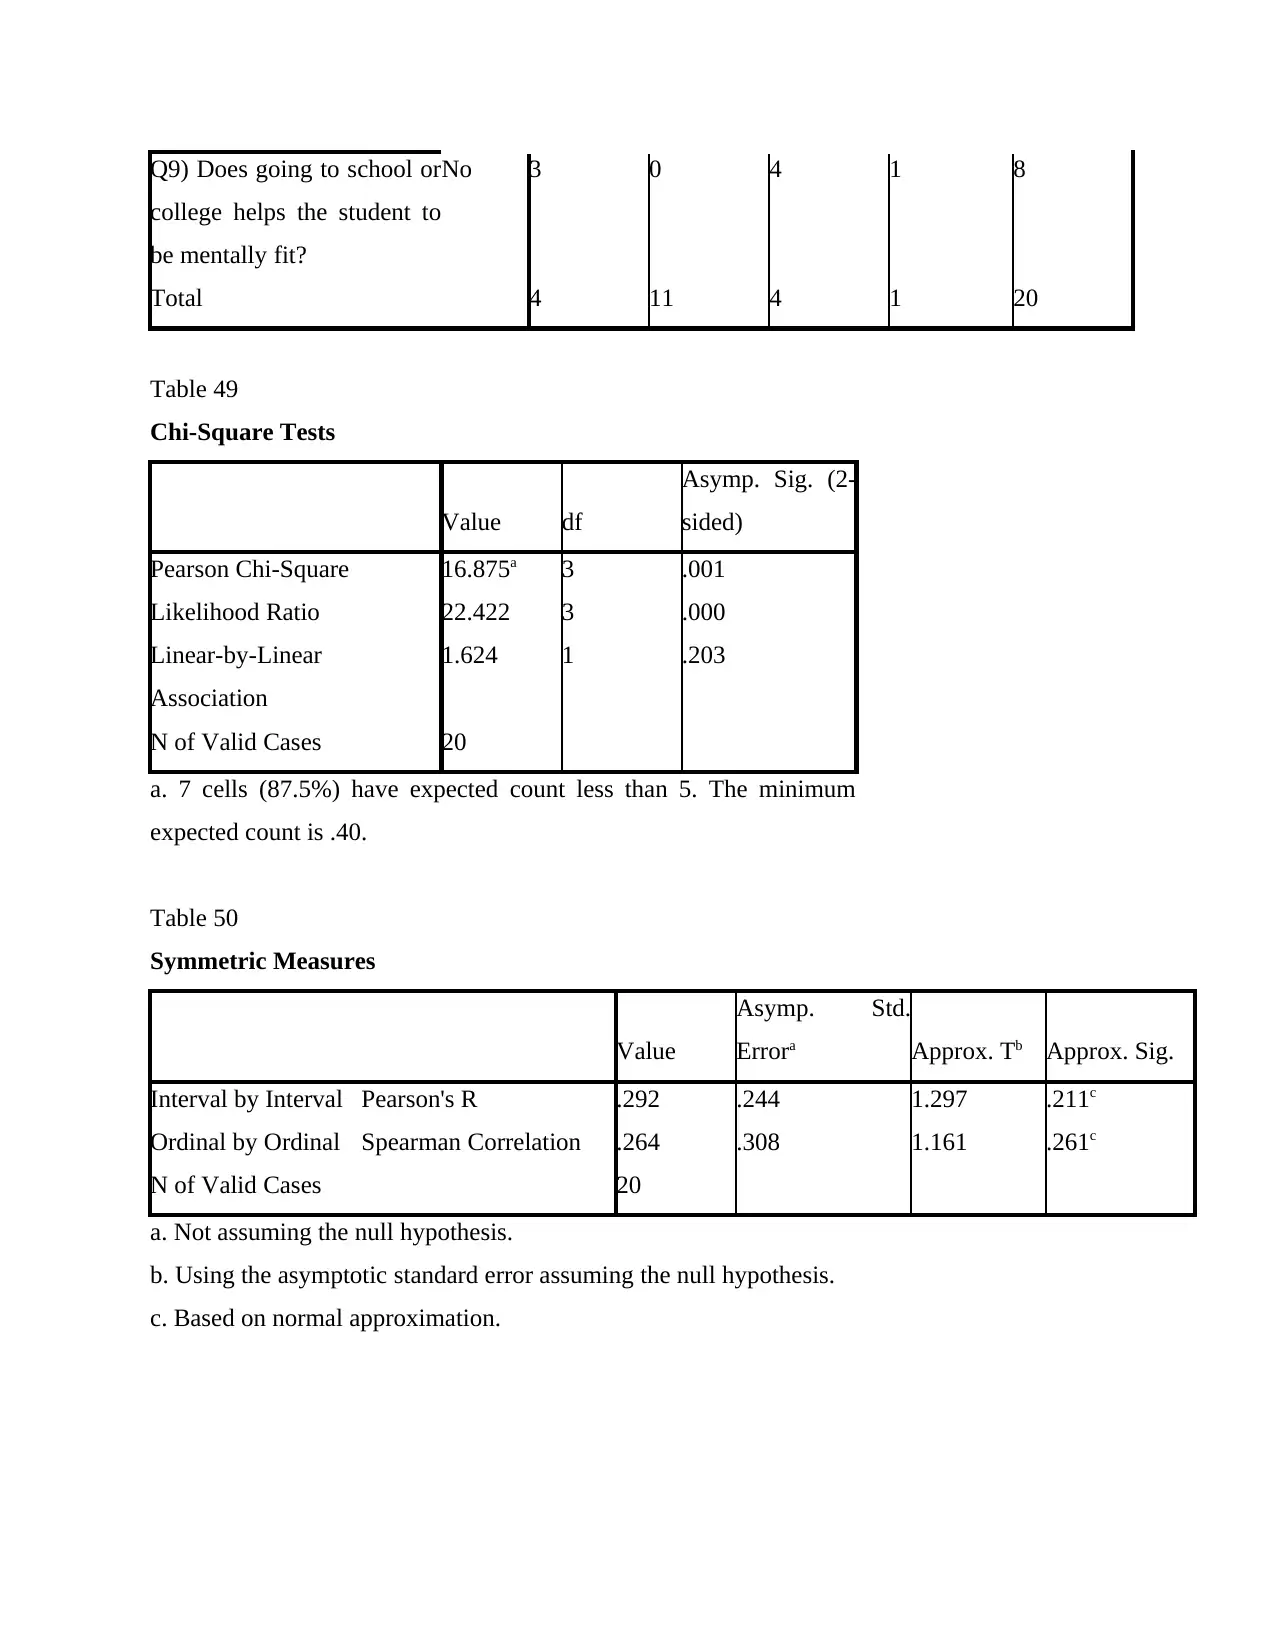
Q9) Does going to school or
college helps the student to
be mentally fit?
No 3 0 4 1 8
Total 4 11 4 1 20
Table 49
Chi-Square Tests
Value df
Asymp. Sig. (2-
sided)
Pearson Chi-Square 16.875a 3 .001
Likelihood Ratio 22.422 3 .000
Linear-by-Linear
Association
1.624 1 .203
N of Valid Cases 20
a. 7 cells (87.5%) have expected count less than 5. The minimum
expected count is .40.
Table 50
Symmetric Measures
Value
Asymp. Std.
Errora Approx. Tb Approx. Sig.
Interval by Interval Pearson's R .292 .244 1.297 .211c
Ordinal by Ordinal Spearman Correlation .264 .308 1.161 .261c
N of Valid Cases 20
a. Not assuming the null hypothesis.
b. Using the asymptotic standard error assuming the null hypothesis.
c. Based on normal approximation.
Secure Best Marks with AI Grader
Need help grading? Try our AI Grader for instant feedback on your assignments.
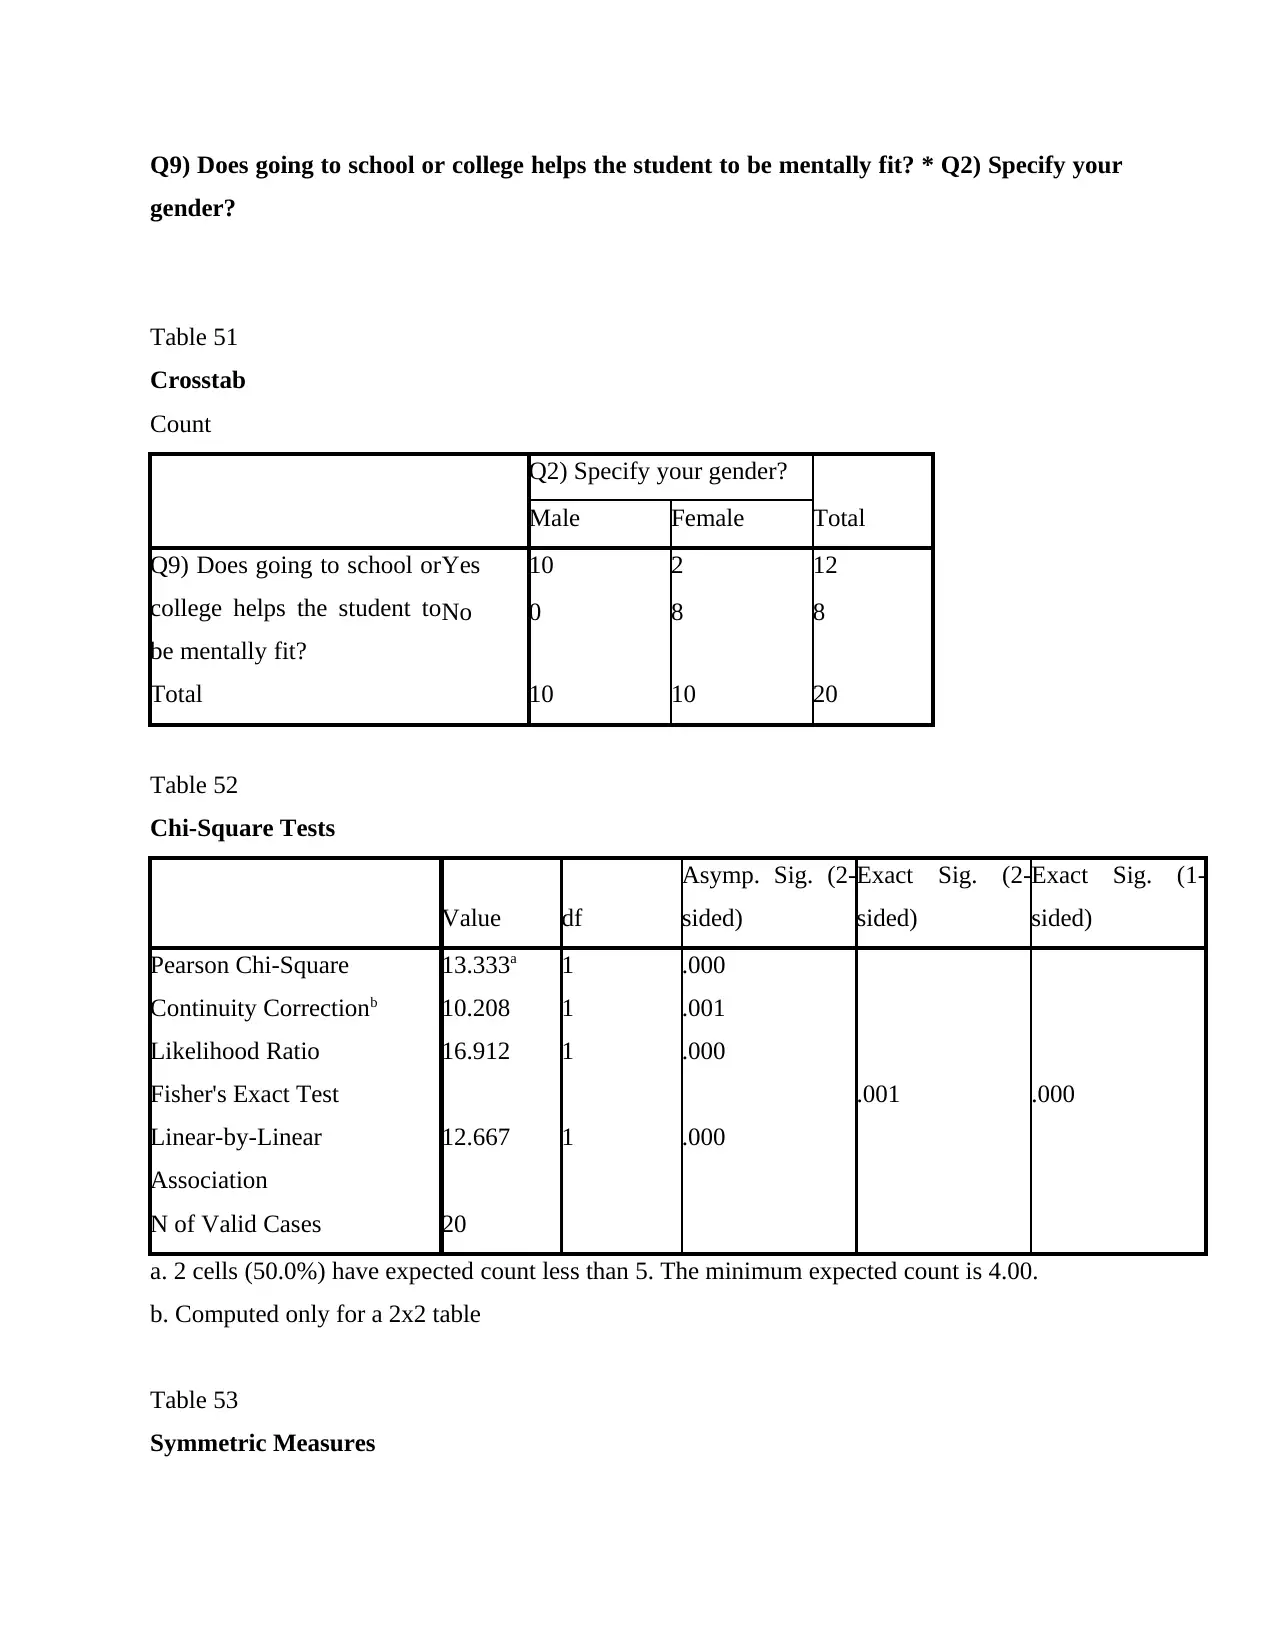
Q9) Does going to school or college helps the student to be mentally fit? * Q2) Specify your
gender?
Table 51
Crosstab
Count
Q2) Specify your gender?
TotalMale Female
Q9) Does going to school or
college helps the student to
be mentally fit?
Yes 10 2 12
No 0 8 8
Total 10 10 20
Table 52
Chi-Square Tests
Value df
Asymp. Sig. (2-
sided)
Exact Sig. (2-
sided)
Exact Sig. (1-
sided)
Pearson Chi-Square 13.333a 1 .000
Continuity Correctionb 10.208 1 .001
Likelihood Ratio 16.912 1 .000
Fisher's Exact Test .001 .000
Linear-by-Linear
Association
12.667 1 .000
N of Valid Cases 20
a. 2 cells (50.0%) have expected count less than 5. The minimum expected count is 4.00.
b. Computed only for a 2x2 table
Table 53
Symmetric Measures
Value
Asymp. Std.
Errora Approx. Tb Approx. Sig.
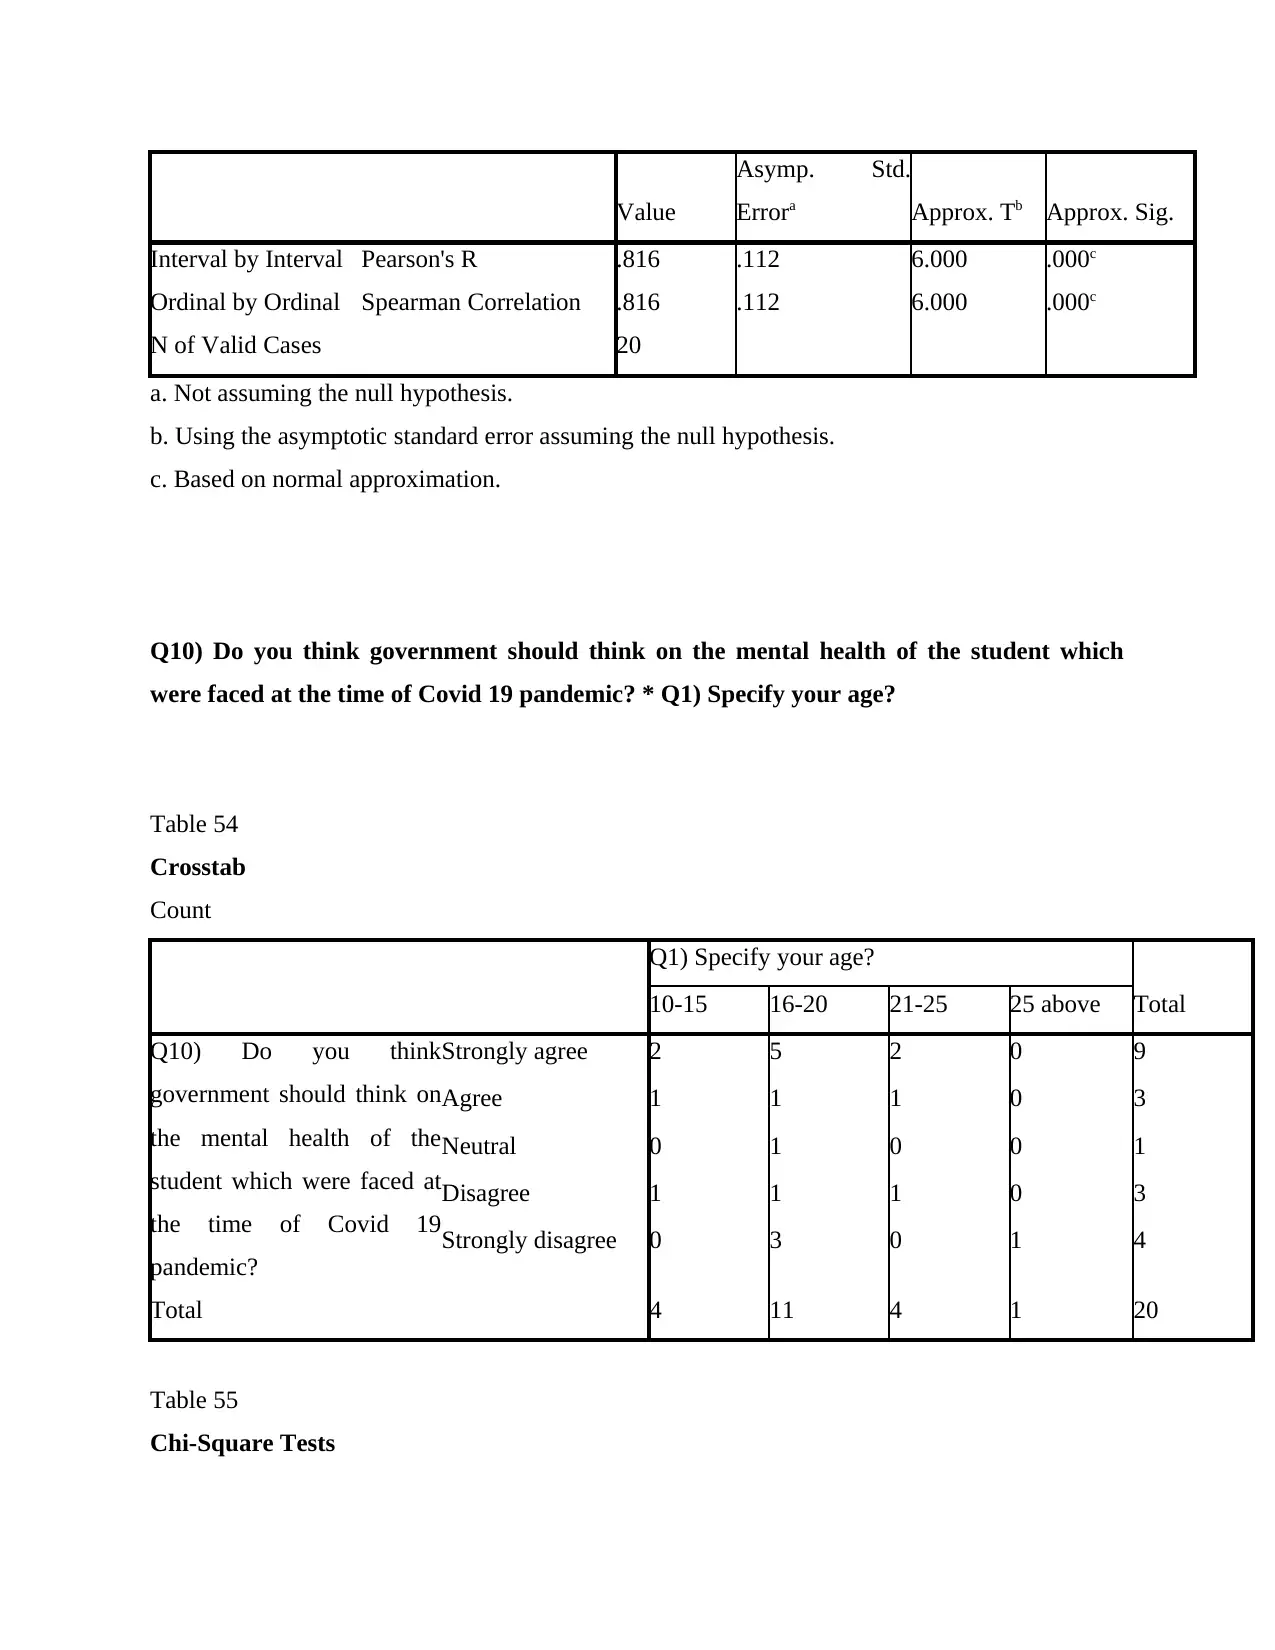
Interval by Interval Pearson's R .816 .112 6.000 .000c
Ordinal by Ordinal Spearman Correlation .816 .112 6.000 .000c
N of Valid Cases 20
a. Not assuming the null hypothesis.
b. Using the asymptotic standard error assuming the null hypothesis.
c. Based on normal approximation.
Q10) Do you think government should think on the mental health of the student which
were faced at the time of Covid 19 pandemic? * Q1) Specify your age?
Table 54
Crosstab
Count
Q1) Specify your age?
Total10-15 16-20 21-25 25 above
Q10) Do you think
government should think on
the mental health of the
student which were faced at
the time of Covid 19
pandemic?
Strongly agree 2 5 2 0 9
Agree 1 1 1 0 3
Neutral 0 1 0 0 1
Disagree 1 1 1 0 3
Strongly disagree 0 3 0 1 4
Total 4 11 4 1 20
Table 55
Chi-Square Tests
Asymp. Std.
Errora Approx. Tb Approx. Sig.
Interval by Interval Pearson's R .816 .112 6.000 .000c
Ordinal by Ordinal Spearman Correlation .816 .112 6.000 .000c
N of Valid Cases 20
a. Not assuming the null hypothesis.
b. Using the asymptotic standard error assuming the null hypothesis.
c. Based on normal approximation.
Q10) Do you think government should think on the mental health of the student which
were faced at the time of Covid 19 pandemic? * Q1) Specify your age?
Table 54
Crosstab
Count
Q1) Specify your age?
Total10-15 16-20 21-25 25 above
Q10) Do you think
government should think on
the mental health of the
student which were faced at
the time of Covid 19
pandemic?
Strongly agree 2 5 2 0 9
Agree 1 1 1 0 3
Neutral 0 1 0 0 1
Disagree 1 1 1 0 3
Strongly disagree 0 3 0 1 4
Total 4 11 4 1 20
Table 55
Chi-Square Tests
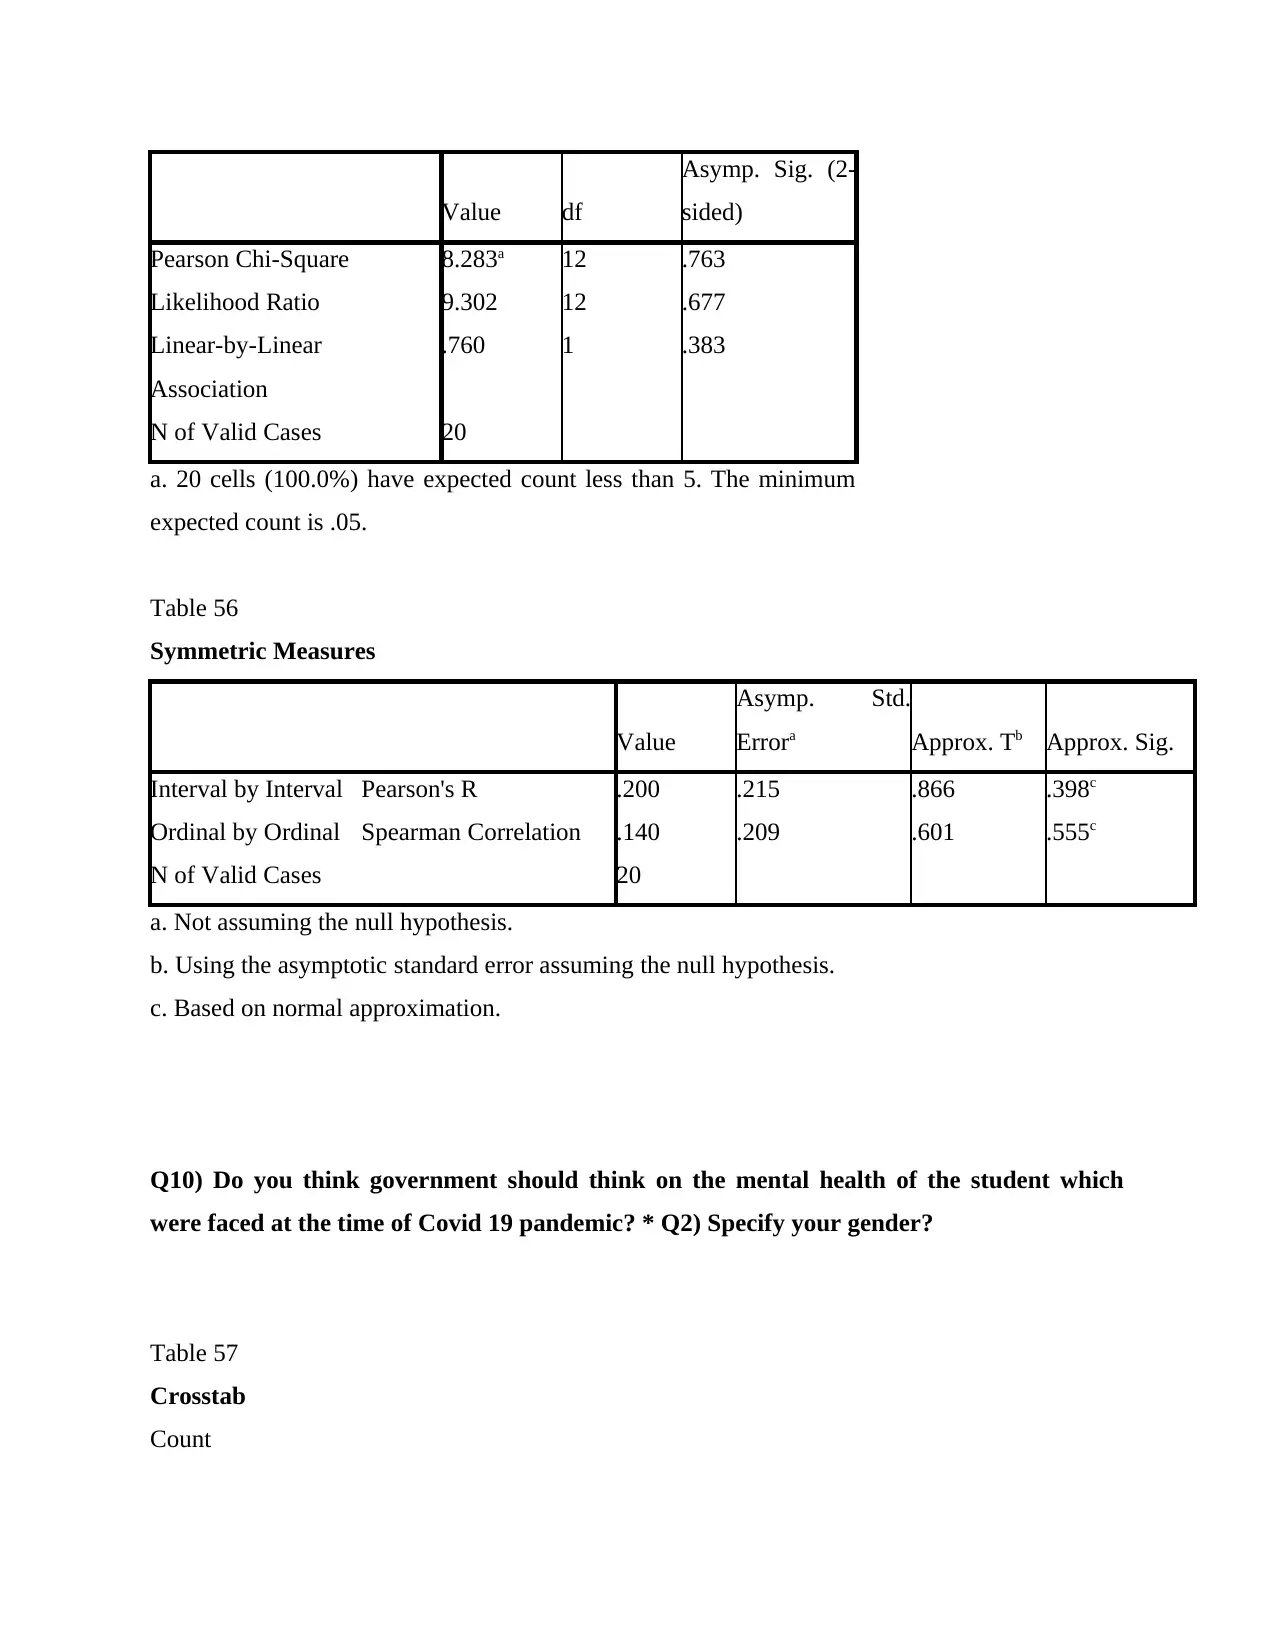
Value df
Asymp. Sig. (2-
sided)
Pearson Chi-Square 8.283a 12 .763
Likelihood Ratio 9.302 12 .677
Linear-by-Linear
Association
.760 1 .383
N of Valid Cases 20
a. 20 cells (100.0%) have expected count less than 5. The minimum
expected count is .05.
Table 56
Symmetric Measures
Value
Asymp. Std.
Errora Approx. Tb Approx. Sig.
Interval by Interval Pearson's R .200 .215 .866 .398c
Ordinal by Ordinal Spearman Correlation .140 .209 .601 .555c
N of Valid Cases 20
a. Not assuming the null hypothesis.
b. Using the asymptotic standard error assuming the null hypothesis.
c. Based on normal approximation.
Q10) Do you think government should think on the mental health of the student which
were faced at the time of Covid 19 pandemic? * Q2) Specify your gender?
Table 57
Crosstab
Count
Paraphrase This Document
Need a fresh take? Get an instant paraphrase of this document with our AI Paraphraser
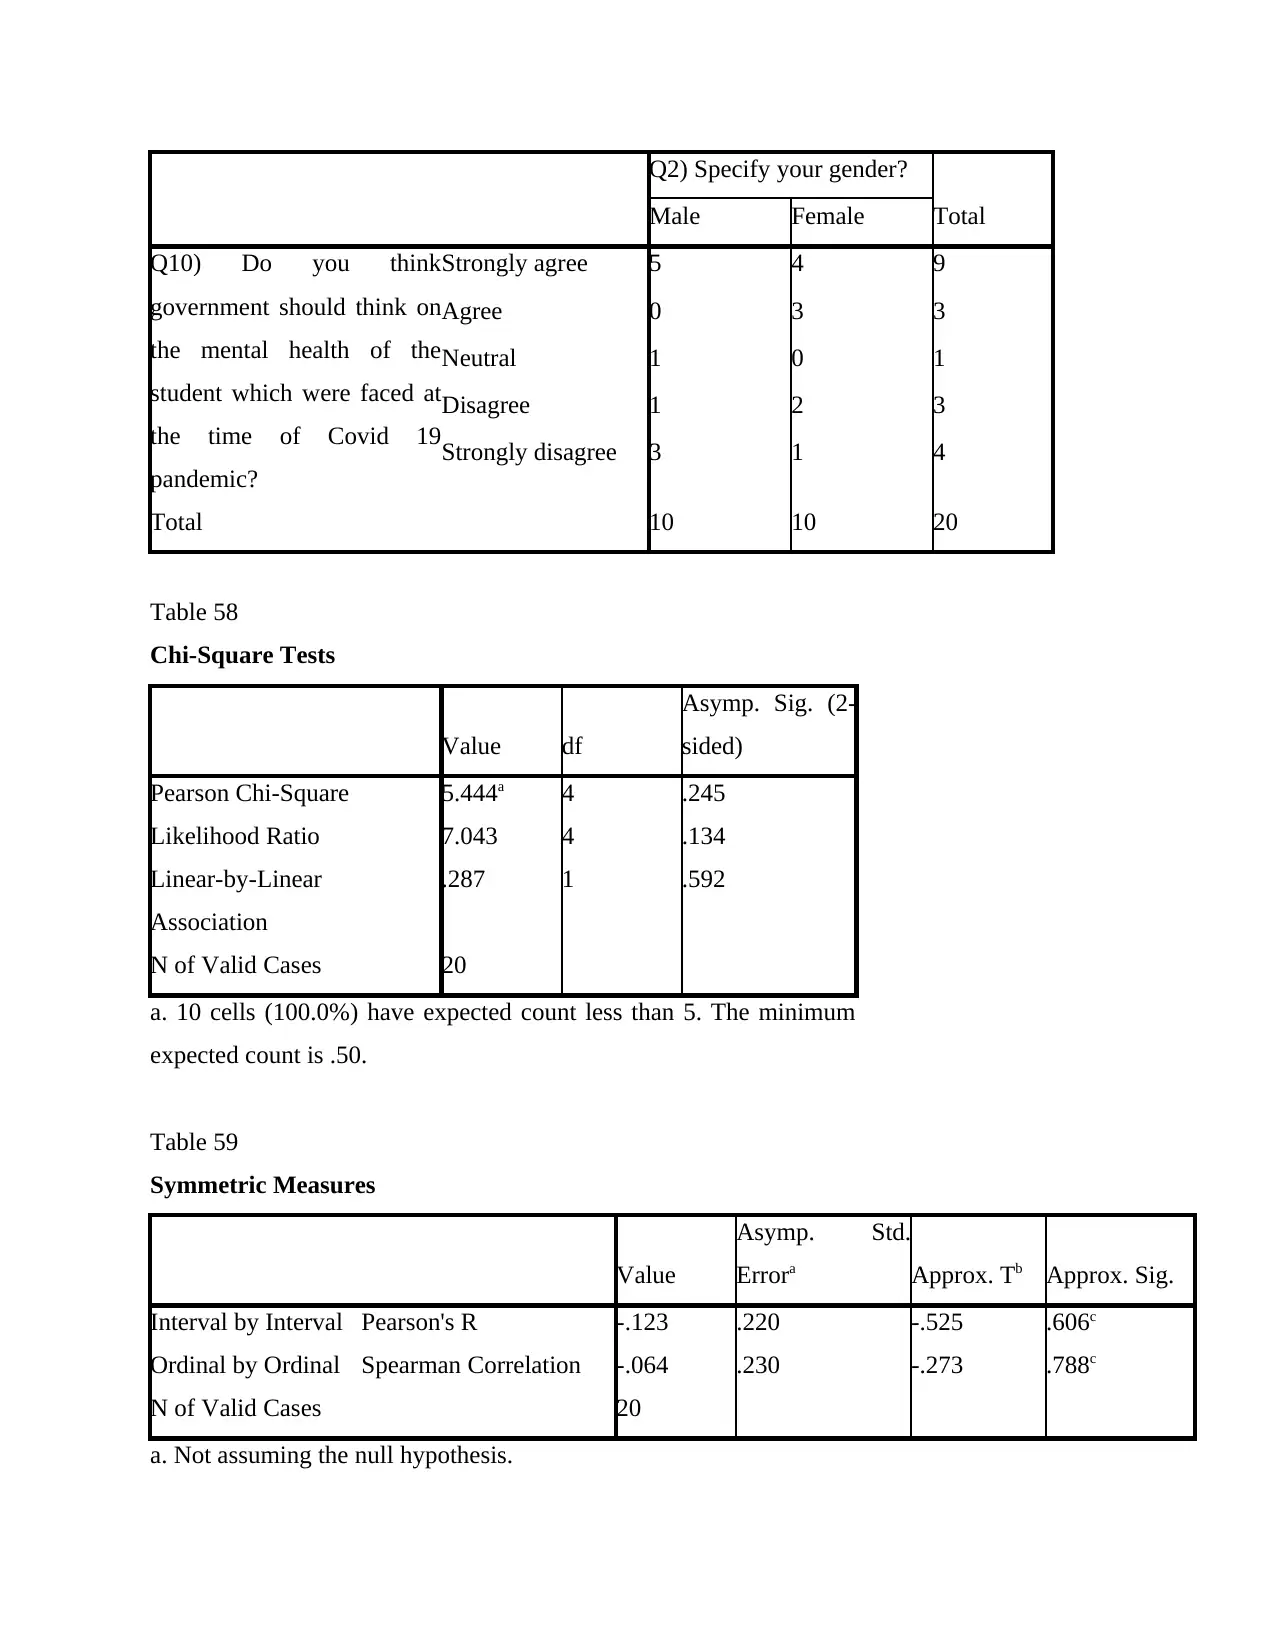
Q2) Specify your gender?
TotalMale Female
Q10) Do you think
government should think on
the mental health of the
student which were faced at
the time of Covid 19
pandemic?
Strongly agree 5 4 9
Agree 0 3 3
Neutral 1 0 1
Disagree 1 2 3
Strongly disagree 3 1 4
Total 10 10 20
Table 58
Chi-Square Tests
Value df
Asymp. Sig. (2-
sided)
Pearson Chi-Square 5.444a 4 .245
Likelihood Ratio 7.043 4 .134
Linear-by-Linear
Association
.287 1 .592
N of Valid Cases 20
a. 10 cells (100.0%) have expected count less than 5. The minimum
expected count is .50.
Table 59
Symmetric Measures
Value
Asymp. Std.
Errora Approx. Tb Approx. Sig.
Interval by Interval Pearson's R -.123 .220 -.525 .606c
Ordinal by Ordinal Spearman Correlation -.064 .230 -.273 .788c
N of Valid Cases 20
a. Not assuming the null hypothesis.
b. Using the asymptotic standard error assuming the null hypothesis.
c. Based on normal approximation.
APPENDIX 3
Questionnaire
Q1) Specify your gender?
a) Male
b) Female
Q2) Specify your age?
a) 10 -15
b) 16-20
c) 21-25
d) 25 above
Q3) Does the global pandemic Covid 19 affect your study?
a) Yes
b) No
Q4) Does Covid 19 affect the mental health of yours?
a) Yes
b) No
Q5) Did you feel comfortable while taking online class?
a) Very comfortable
b) Not at all comfortable
Q6) Do you agree that Covid 19 has drastically impact the learning ability of the student?
a) Strongly agree
b) Agree
c) Neutral
d) Disagree
Q7) Does the Covid 19 increase the Stress among the student about their study?
a) Yes
b) No
Q8) Does Covid 19 increase the anxiety among the student as they are not able to go physically
to their organisation?
a) Yes
b) No
Q9) Does going to school or college helps the student to be mentally fit?
a) Yes
b) No
Q10) Do you think government should think on the mental health of the student which were
faced at the time of Covid 19 pandemic?
a) Strongly agree
b) Agree
c) Neutral
d) Disagree
e) Strongly disagree
1 out of 46
Related Documents


Your All-in-One AI-Powered Toolkit for Academic Success.
+13062052269
info@desklib.com
Available 24*7 on WhatsApp / Email
![[object Object]](/_next/static/media/star-bottom.7253800d.svg)
Unlock your academic potential
© 2024 | Zucol Services PVT LTD | All rights reserved.