Comparative Analysis of CPET Results: Healthy vs. Anemic Individuals
VerifiedAdded on 2023/06/04
|31
|6179
|357
Project
AI Summary
This research project presents a comparative analysis of Cardiopulmonary Exercise Testing (CPET) results between a healthy population and an anemic group. The study investigates differences in respiratory responses and heart rates at rest, anaerobic threshold, and peak exercise. Data was collected from eight participants in each group, with detailed demographic characteristics provided. Statistical analyses, including t-tests, were used to compare variables such as heart rate, oxygen intake, and carbon dioxide output. The results section provides descriptive statistics for both groups at different exercise levels, followed by paired samples tests to identify significant differences. The findings reveal notable variations in CPET results, highlighting the impact of anemia on exercise tolerance and physiological responses. The project includes an introduction, research questions, hypotheses, methods, results, conclusion, and limitations, offering a comprehensive overview of the study's design, findings, and implications. The study concludes that there are significant differences between CPET results of healthy and anemic populations across various exercise levels.
A RESEARCH PROJECT TO COMPARE CPET RESULTS OF A NORMAL HEALTHY
POPULATION AND THOSE OF AN ANEMIC GROUP
POPULATION AND THOSE OF AN ANEMIC GROUP
Paraphrase This Document
Need a fresh take? Get an instant paraphrase of this document with our AI Paraphraser
Table of Contents
Introduction.................................................................................................................................................3
Research question...................................................................................................................................4
Hypothesis...............................................................................................................................................4
Methods......................................................................................................................................................5
Demographic characteristics...................................................................................................................5
Statistical analysis....................................................................................................................................6
Results.........................................................................................................................................................7
Comparison between means of tests at rest for a healthy and anemic population..............................11
Comparison between means of tests at anaerobic threshold for a healthy and anemic population....13
Comparison between means of tests at peak exercise for a healthy and anemic population...............16
Conclusion.................................................................................................................................................19
Limitations.................................................................................................................................................20
References.................................................................................................................................................21
Introduction
This research report aims to compare Cardiopulmonary Exercise Testing (CPET) of a normal
healthy group with those of an anemia population. It shall outline differences in the responses
from the healthy and anemic groups.
Cardiopulmonary Exercise Testing (CPET) is a method used to assess the performance of the
heart and lungs at rest and during activity without introducing medical instruments into the body
(Weisman, 2002). It has become an essential tool for evaluating heart and lung performance and
predicting outcome in patients with failures in these organs (Steve Benington, 2012).
CPET involves measurement of inspiratory gas, oxygen uptake (Vo2) and expiratory gas, Carbon
(IV) oxide production (Vco2) and heart rate (Weisman, 2002).
It is expected that respiratory activities of a normal healthy person shall be standard normal
while the respiratory activities of any anemic person shall experience variations (Bandera, 2015).
It then follows that patients with anemia experience exercise intolerance leading to exercise
limitation.
Exercise plays a significant role in determining one’s oxygen intake, carbon (IV) oxide emission
and pulse rate. Lung dysfunctions could lead to low inspiratory and expiratory metabolism (Hale,
1977). The exercise one performs plays an important role in determining their respiratory
response and heart rate. The heart does not beat as quickly when at rest, when you exercise at a
moderate rate and at vigorous rate. Exercises such as water aerobics, walking and dancing are
moderately vigorous while exercises such as swimming, jogging and running are among
vigorous exercises.
⊘ This is a preview!⊘
Do you want full access?
Subscribe today to unlock all pages.
Trusted by 1+ million students worldwide
In this research, we examined respiratory respondents for a healthy and anemic population at
rest, at anaerobic threshold and at peak exercise. Analysis was then carried out and differences in
the respiratory responses of the two groups and comparison made.
Research question
The following research questions guided the study;
i. How do CPET of a normal healthy group compare to that of an anemic population?
ii. How do CPET results compare at rest, at anaerobic threshold and at peak exercise for
normal and anemic populations?
Hypothesis
The null and alternative hypotheses based on the research question are:
i. H0: There is no difference in CPET results of a normal healthy group and that of an
anemic population.
H1: There is difference in CPET results of a normal healthy group and that of an anemic
population.
ii. H0: There is no difference in CPET results of normal and anemic populations at rest, at
anaerobic threshold and at peak exercise.
H1: There is difference in CPET results of normal and healthy populations at rest, at
anaerobic threshold and at peak exercise.
Paraphrase This Document
Need a fresh take? Get an instant paraphrase of this document with our AI Paraphraser
Methods
Demographic characteristics
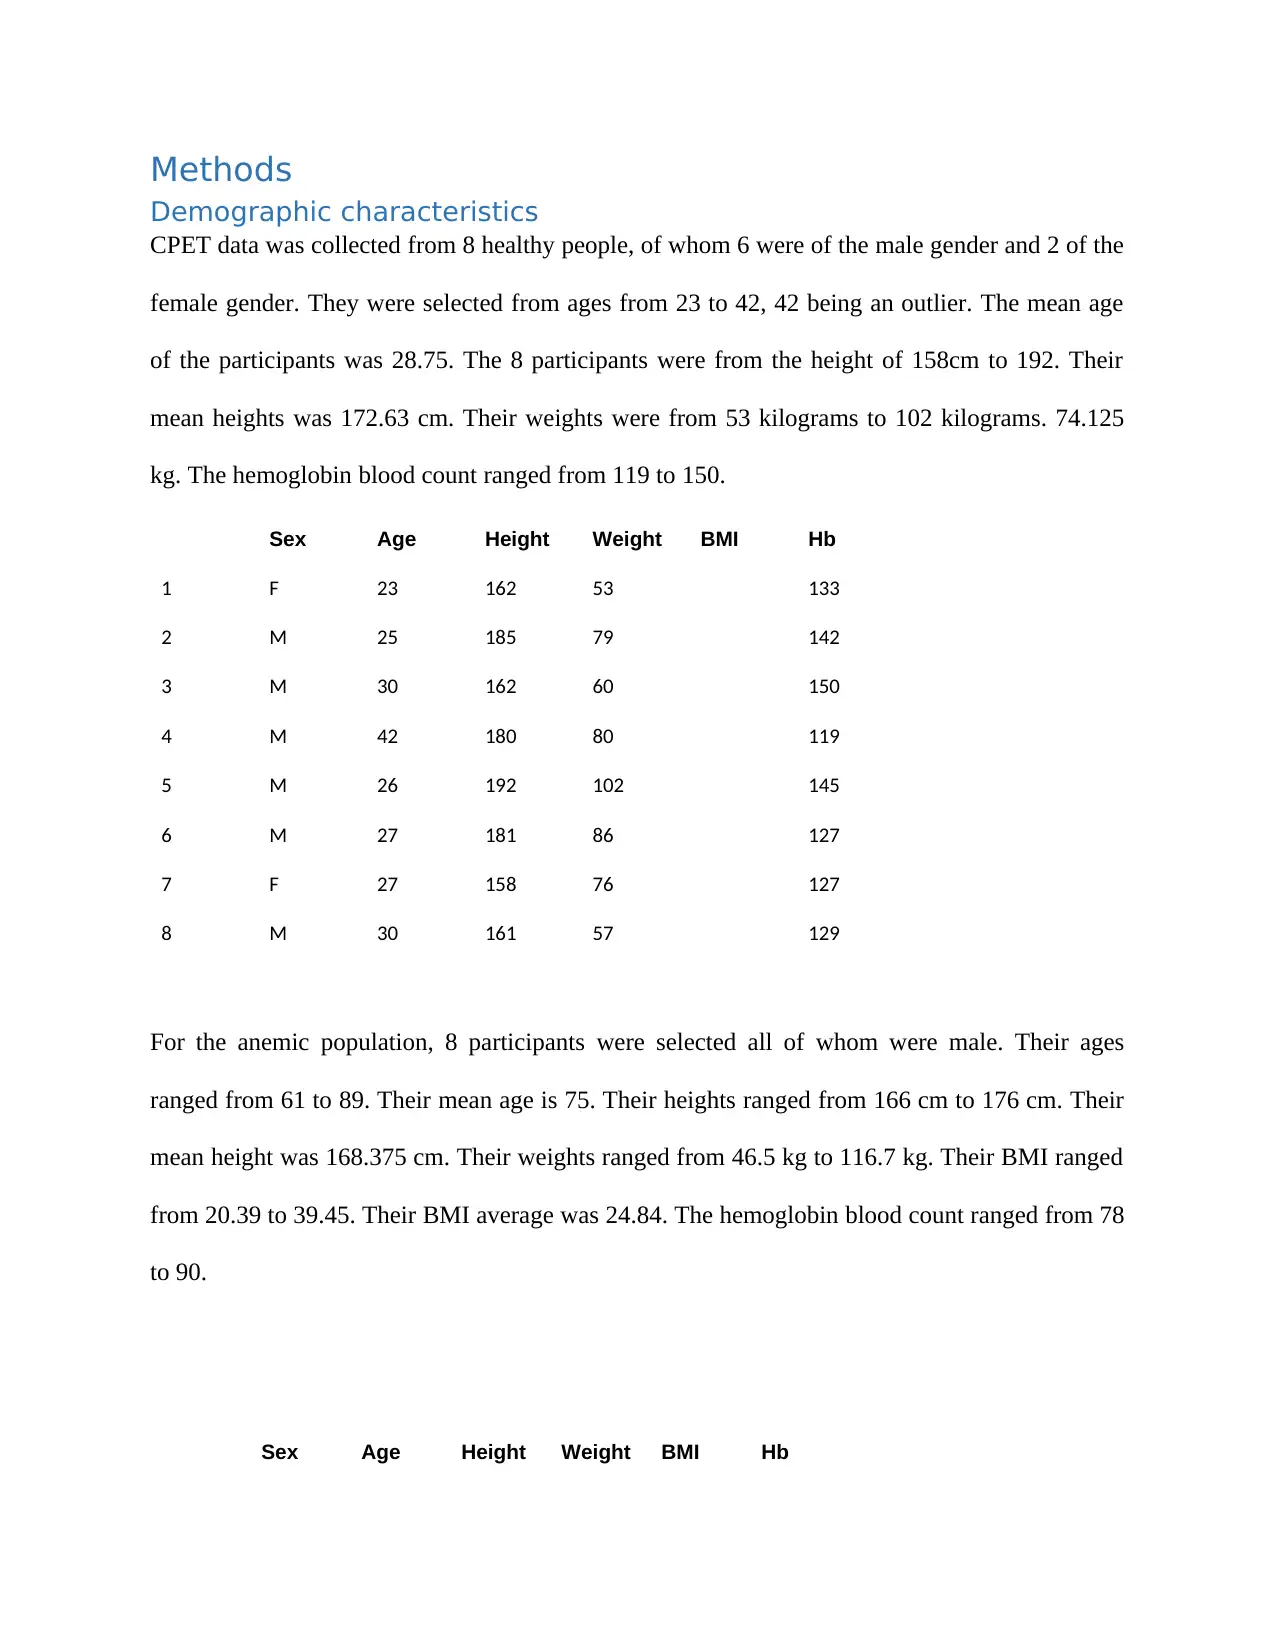
CPET data was collected from 8 healthy people, of whom 6 were of the male gender and 2 of the
female gender. They were selected from ages from 23 to 42, 42 being an outlier. The mean age
of the participants was 28.75. The 8 participants were from the height of 158cm to 192. Their
mean heights was 172.63 cm. Their weights were from 53 kilograms to 102 kilograms. 74.125
kg. The hemoglobin blood count ranged from 119 to 150.
Sex Age Height Weight BMI Hb
1 F 23 162 53 133
2 M 25 185 79 142
3 M 30 162 60 150
4 M 42 180 80 119
5 M 26 192 102 145
6 M 27 181 86 127
7 F 27 158 76 127
8 M 30 161 57 129
For the anemic population, 8 participants were selected all of whom were male. Their ages
ranged from 61 to 89. Their mean age is 75. Their heights ranged from 166 cm to 176 cm. Their
mean height was 168.375 cm. Their weights ranged from 46.5 kg to 116.7 kg. Their BMI ranged
from 20.39 to 39.45. Their BMI average was 24.84. The hemoglobin blood count ranged from 78
to 90.
Sex Age Height Weight BMI Hb
Demographic characteristics
CPET data was collected from 8 healthy people, of whom 6 were of the male gender and 2 of the
female gender. They were selected from ages from 23 to 42, 42 being an outlier. The mean age
of the participants was 28.75. The 8 participants were from the height of 158cm to 192. Their
mean heights was 172.63 cm. Their weights were from 53 kilograms to 102 kilograms. 74.125
kg. The hemoglobin blood count ranged from 119 to 150.
Sex Age Height Weight BMI Hb
1 F 23 162 53 133
2 M 25 185 79 142
3 M 30 162 60 150
4 M 42 180 80 119
5 M 26 192 102 145
6 M 27 181 86 127
7 F 27 158 76 127
8 M 30 161 57 129
For the anemic population, 8 participants were selected all of whom were male. Their ages
ranged from 61 to 89. Their mean age is 75. Their heights ranged from 166 cm to 176 cm. Their
mean height was 168.375 cm. Their weights ranged from 46.5 kg to 116.7 kg. Their BMI ranged
from 20.39 to 39.45. Their BMI average was 24.84. The hemoglobin blood count ranged from 78
to 90.
Sex Age Height Weight BMI Hb
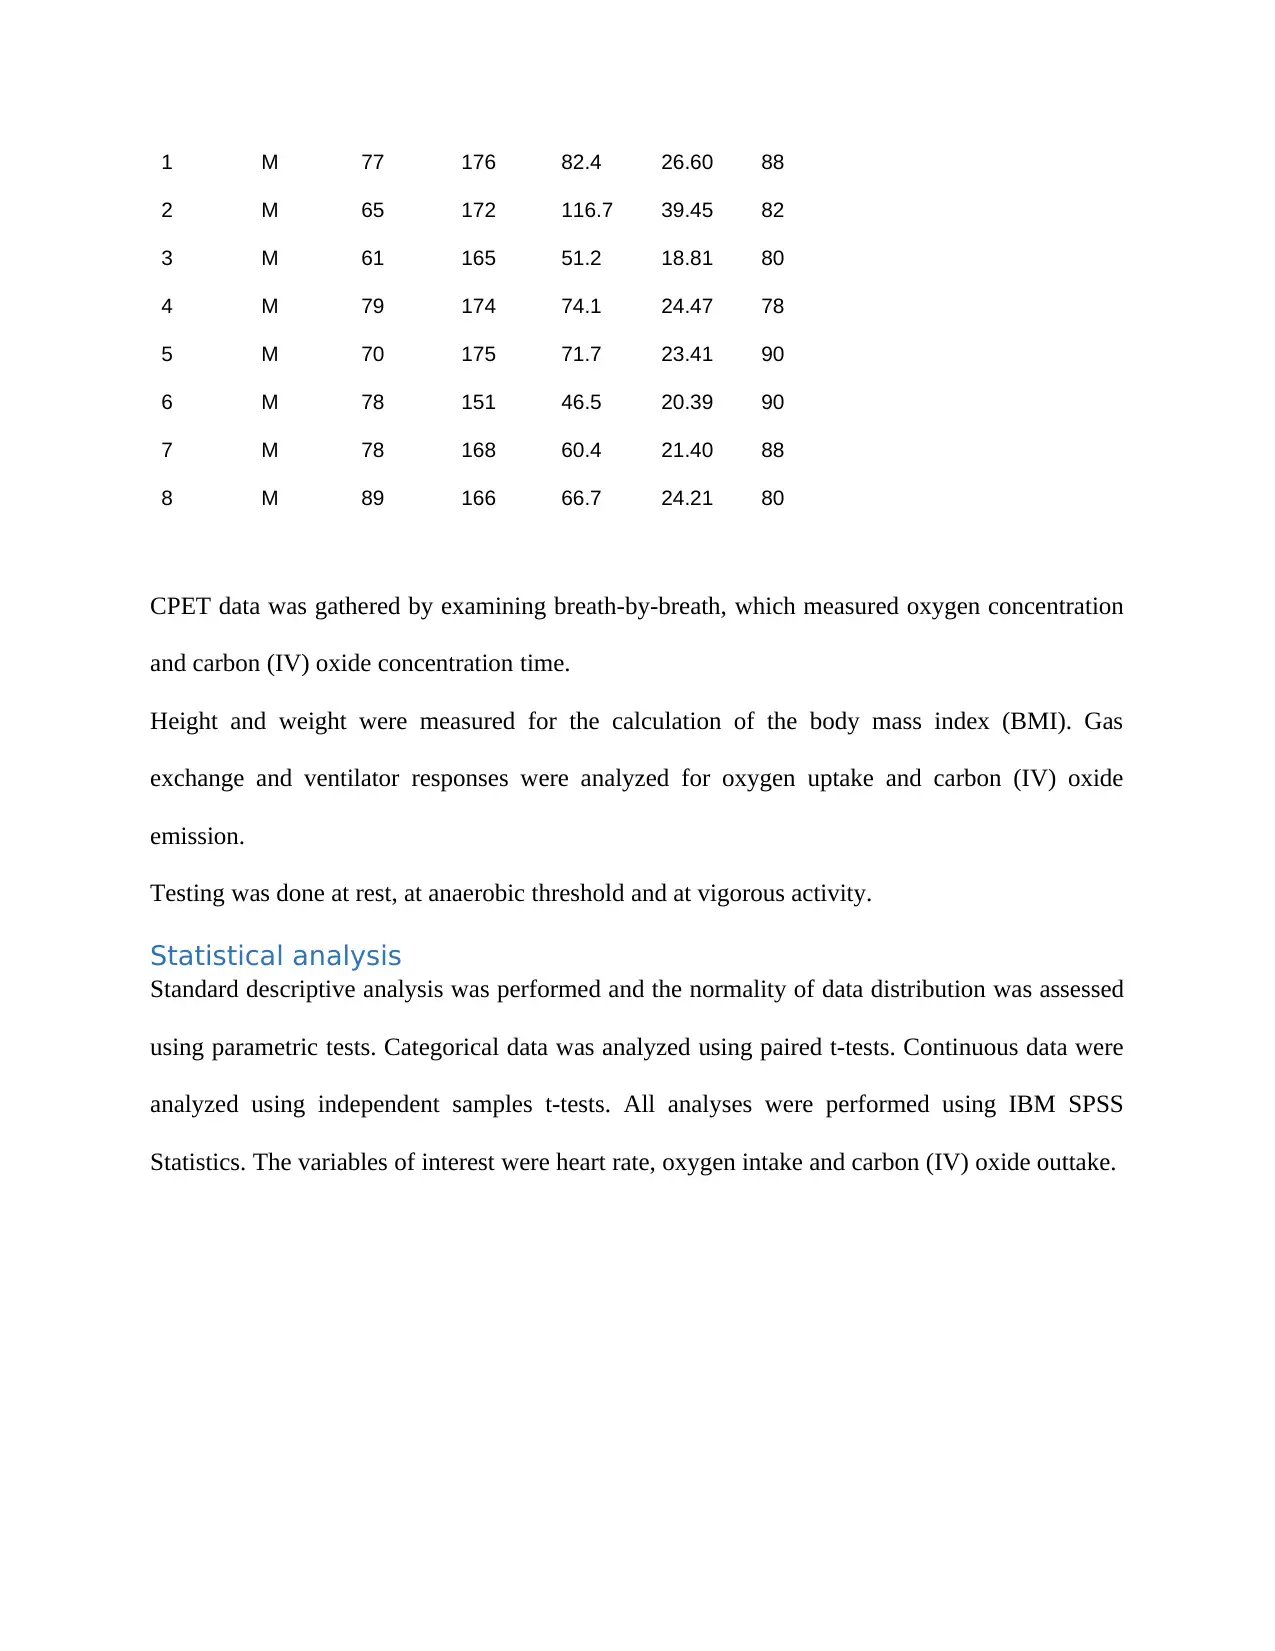
1 M 77 176 82.4 26.60 88
2 M 65 172 116.7 39.45 82
3 M 61 165 51.2 18.81 80
4 M 79 174 74.1 24.47 78
5 M 70 175 71.7 23.41 90
6 M 78 151 46.5 20.39 90
7 M 78 168 60.4 21.40 88
8 M 89 166 66.7 24.21 80
CPET data was gathered by examining breath-by-breath, which measured oxygen concentration
and carbon (IV) oxide concentration time.
Height and weight were measured for the calculation of the body mass index (BMI). Gas
exchange and ventilator responses were analyzed for oxygen uptake and carbon (IV) oxide
emission.
Testing was done at rest, at anaerobic threshold and at vigorous activity.
Statistical analysis
Standard descriptive analysis was performed and the normality of data distribution was assessed
using parametric tests. Categorical data was analyzed using paired t-tests. Continuous data were
analyzed using independent samples t-tests. All analyses were performed using IBM SPSS
Statistics. The variables of interest were heart rate, oxygen intake and carbon (IV) oxide outtake.
⊘ This is a preview!⊘
Do you want full access?
Subscribe today to unlock all pages.
Trusted by 1+ million students worldwide
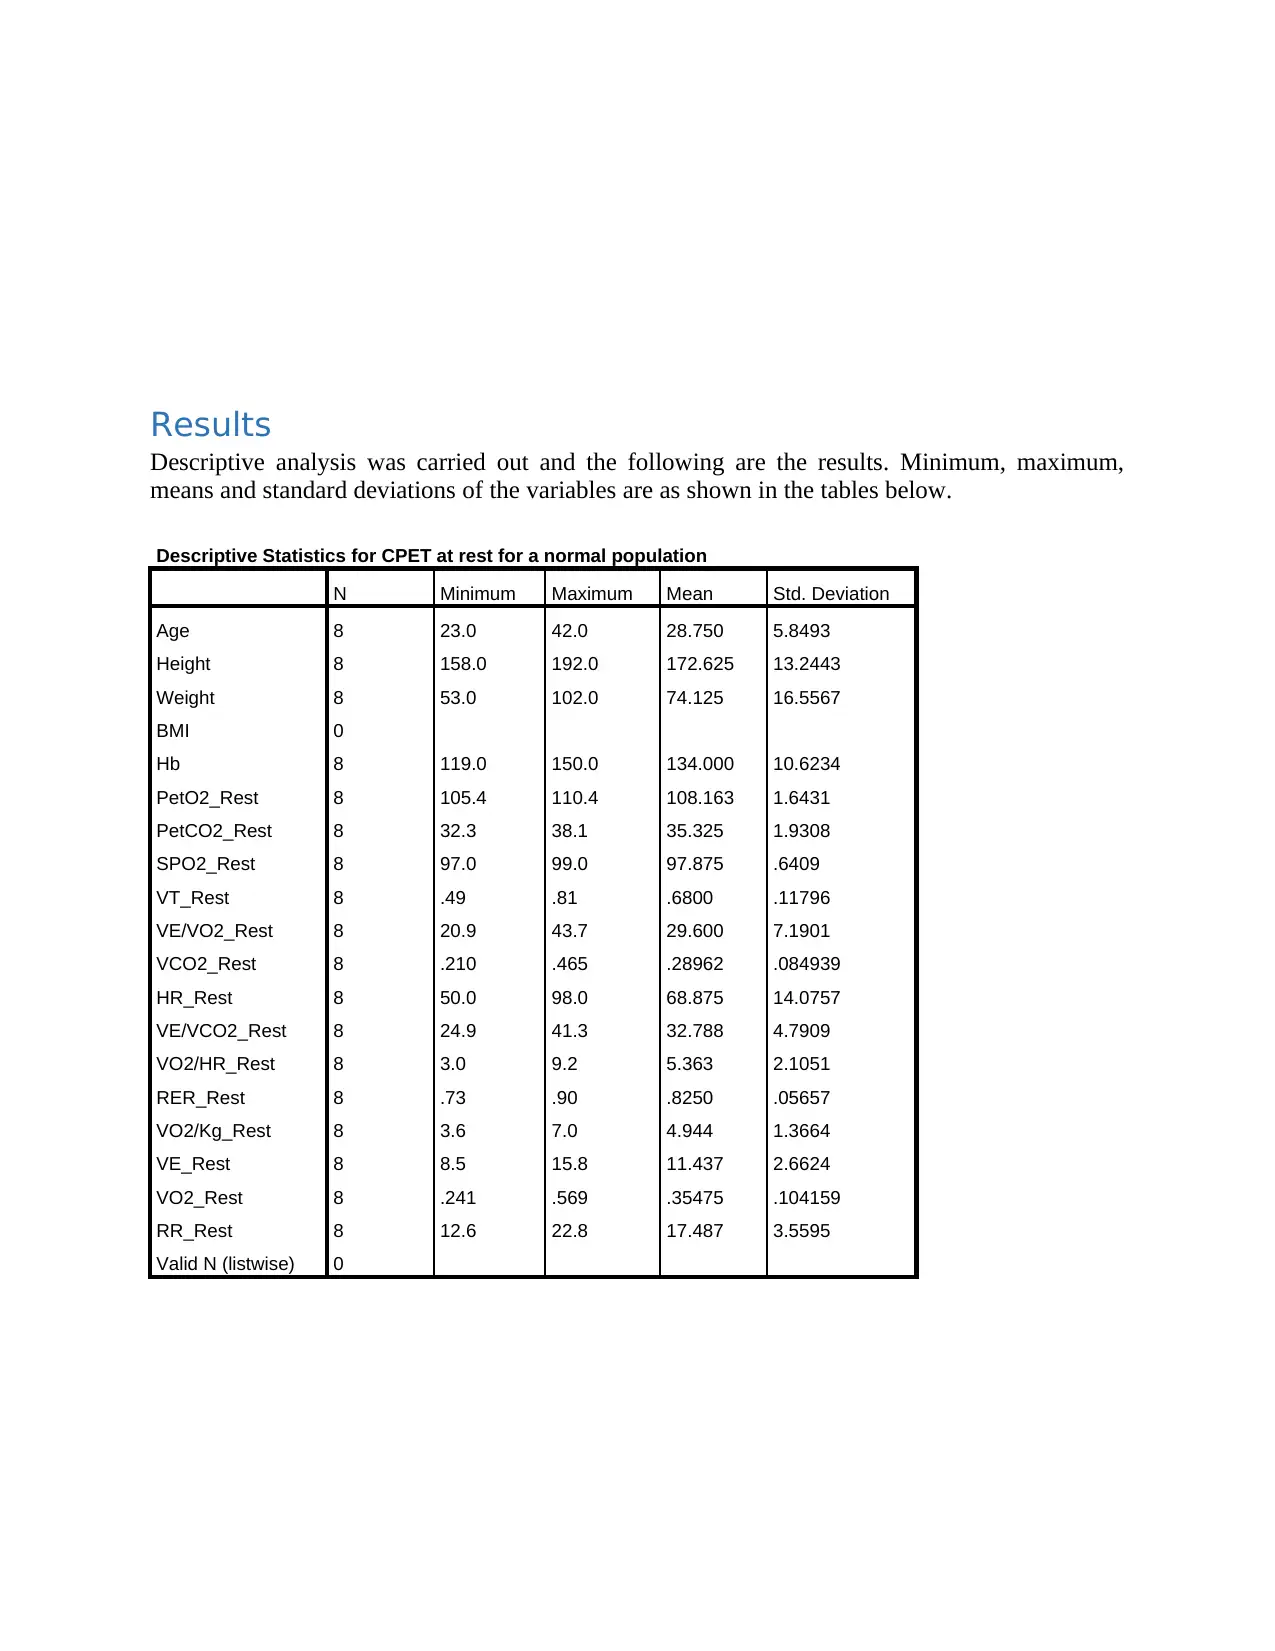
Results
Descriptive analysis was carried out and the following are the results. Minimum, maximum,
means and standard deviations of the variables are as shown in the tables below.
Descriptive Statistics for CPET at rest for a normal population
N Minimum Maximum Mean Std. Deviation
Age 8 23.0 42.0 28.750 5.8493
Height 8 158.0 192.0 172.625 13.2443
Weight 8 53.0 102.0 74.125 16.5567
BMI 0
Hb 8 119.0 150.0 134.000 10.6234
PetO2_Rest 8 105.4 110.4 108.163 1.6431
PetCO2_Rest 8 32.3 38.1 35.325 1.9308
SPO2_Rest 8 97.0 99.0 97.875 .6409
VT_Rest 8 .49 .81 .6800 .11796
VE/VO2_Rest 8 20.9 43.7 29.600 7.1901
VCO2_Rest 8 .210 .465 .28962 .084939
HR_Rest 8 50.0 98.0 68.875 14.0757
VE/VCO2_Rest 8 24.9 41.3 32.788 4.7909
VO2/HR_Rest 8 3.0 9.2 5.363 2.1051
RER_Rest 8 .73 .90 .8250 .05657
VO2/Kg_Rest 8 3.6 7.0 4.944 1.3664
VE_Rest 8 8.5 15.8 11.437 2.6624
VO2_Rest 8 .241 .569 .35475 .104159
RR_Rest 8 12.6 22.8 17.487 3.5595
Valid N (listwise) 0
Paraphrase This Document
Need a fresh take? Get an instant paraphrase of this document with our AI Paraphraser
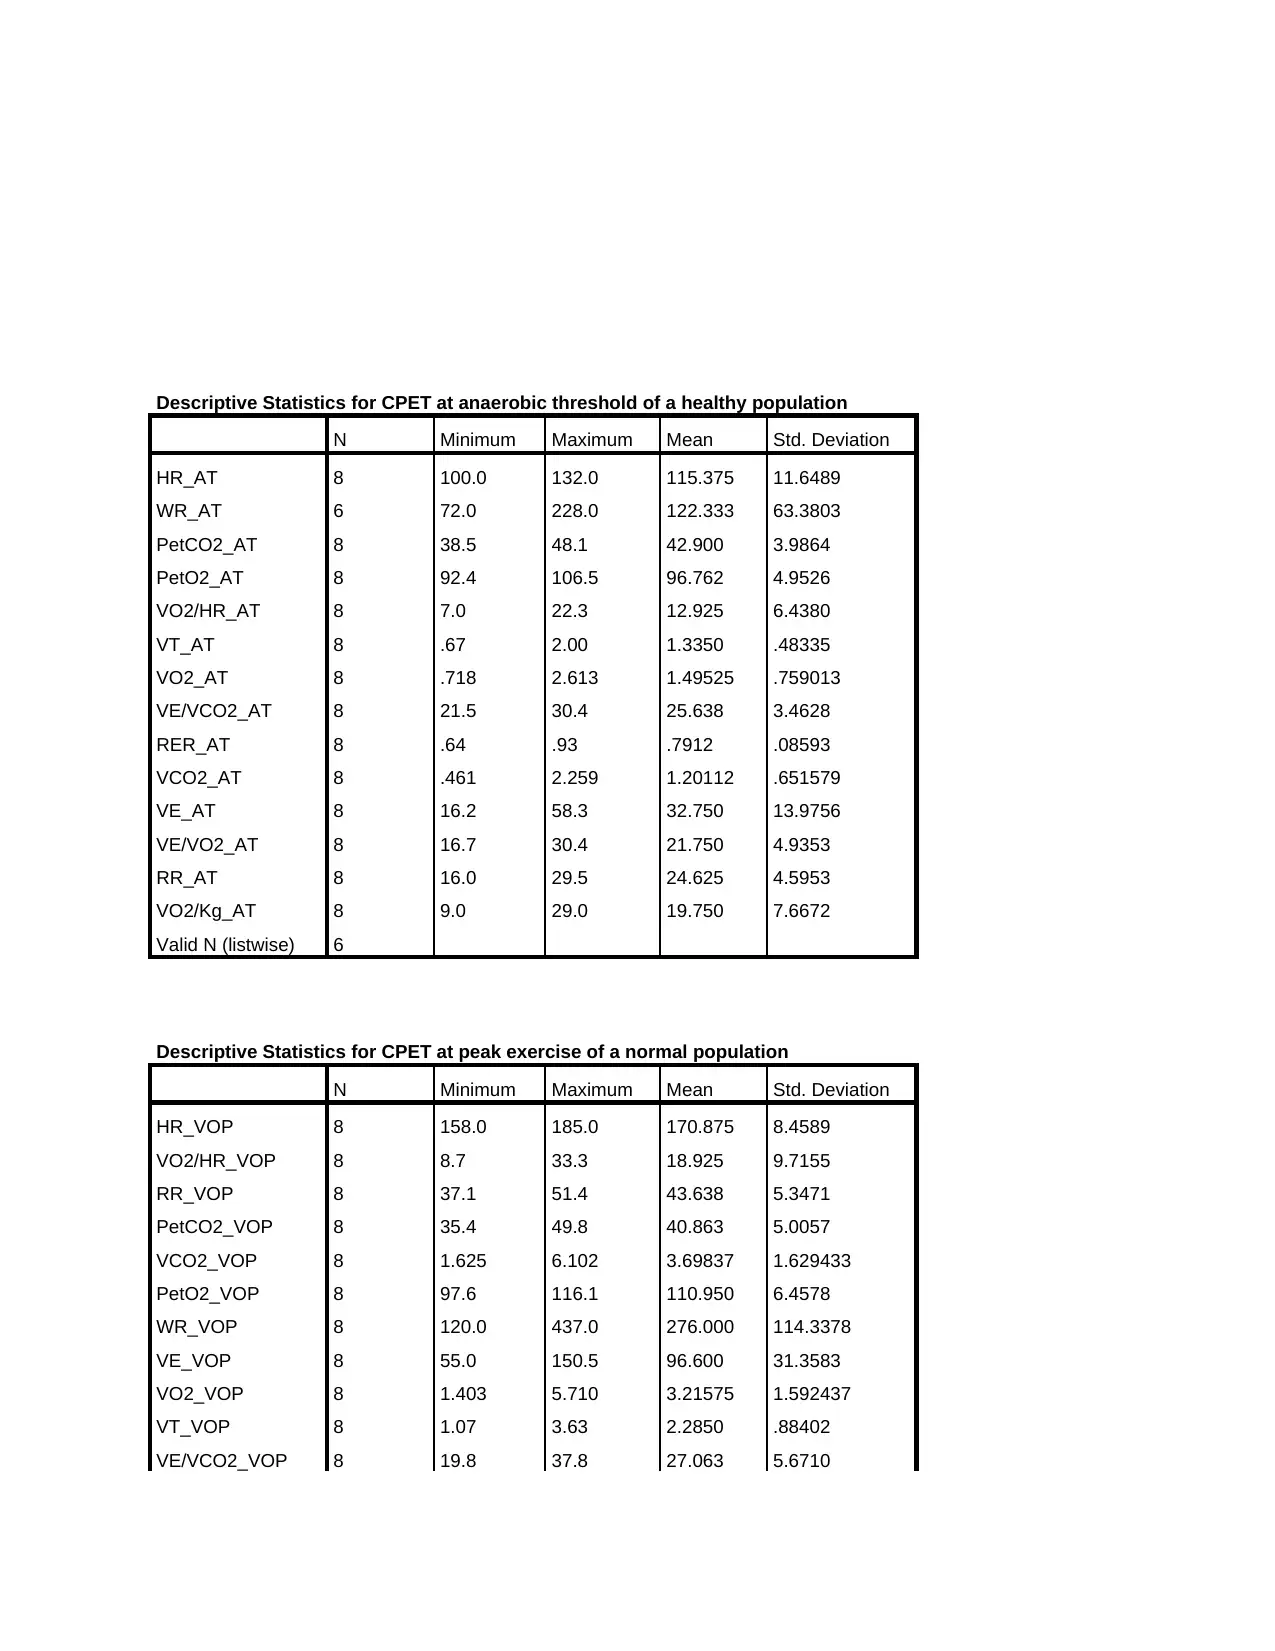
Descriptive Statistics for CPET at anaerobic threshold of a healthy population
N Minimum Maximum Mean Std. Deviation
HR_AT 8 100.0 132.0 115.375 11.6489
WR_AT 6 72.0 228.0 122.333 63.3803
PetCO2_AT 8 38.5 48.1 42.900 3.9864
PetO2_AT 8 92.4 106.5 96.762 4.9526
VO2/HR_AT 8 7.0 22.3 12.925 6.4380
VT_AT 8 .67 2.00 1.3350 .48335
VO2_AT 8 .718 2.613 1.49525 .759013
VE/VCO2_AT 8 21.5 30.4 25.638 3.4628
RER_AT 8 .64 .93 .7912 .08593
VCO2_AT 8 .461 2.259 1.20112 .651579
VE_AT 8 16.2 58.3 32.750 13.9756
VE/VO2_AT 8 16.7 30.4 21.750 4.9353
RR_AT 8 16.0 29.5 24.625 4.5953
VO2/Kg_AT 8 9.0 29.0 19.750 7.6672
Valid N (listwise) 6
Descriptive Statistics for CPET at peak exercise of a normal population
N Minimum Maximum Mean Std. Deviation
HR_VOP 8 158.0 185.0 170.875 8.4589
VO2/HR_VOP 8 8.7 33.3 18.925 9.7155
RR_VOP 8 37.1 51.4 43.638 5.3471
PetCO2_VOP 8 35.4 49.8 40.863 5.0057
VCO2_VOP 8 1.625 6.102 3.69837 1.629433
PetO2_VOP 8 97.6 116.1 110.950 6.4578
WR_VOP 8 120.0 437.0 276.000 114.3378
VE_VOP 8 55.0 150.5 96.600 31.3583
VO2_VOP 8 1.403 5.710 3.21575 1.592437
VT_VOP 8 1.07 3.63 2.2850 .88402
VE/VCO2_VOP 8 19.8 37.8 27.063 5.6710
N Minimum Maximum Mean Std. Deviation
HR_AT 8 100.0 132.0 115.375 11.6489
WR_AT 6 72.0 228.0 122.333 63.3803
PetCO2_AT 8 38.5 48.1 42.900 3.9864
PetO2_AT 8 92.4 106.5 96.762 4.9526
VO2/HR_AT 8 7.0 22.3 12.925 6.4380
VT_AT 8 .67 2.00 1.3350 .48335
VO2_AT 8 .718 2.613 1.49525 .759013
VE/VCO2_AT 8 21.5 30.4 25.638 3.4628
RER_AT 8 .64 .93 .7912 .08593
VCO2_AT 8 .461 2.259 1.20112 .651579
VE_AT 8 16.2 58.3 32.750 13.9756
VE/VO2_AT 8 16.7 30.4 21.750 4.9353
RR_AT 8 16.0 29.5 24.625 4.5953
VO2/Kg_AT 8 9.0 29.0 19.750 7.6672
Valid N (listwise) 6
Descriptive Statistics for CPET at peak exercise of a normal population
N Minimum Maximum Mean Std. Deviation
HR_VOP 8 158.0 185.0 170.875 8.4589
VO2/HR_VOP 8 8.7 33.3 18.925 9.7155
RR_VOP 8 37.1 51.4 43.638 5.3471
PetCO2_VOP 8 35.4 49.8 40.863 5.0057
VCO2_VOP 8 1.625 6.102 3.69837 1.629433
PetO2_VOP 8 97.6 116.1 110.950 6.4578
WR_VOP 8 120.0 437.0 276.000 114.3378
VE_VOP 8 55.0 150.5 96.600 31.3583
VO2_VOP 8 1.403 5.710 3.21575 1.592437
VT_VOP 8 1.07 3.63 2.2850 .88402
VE/VCO2_VOP 8 19.8 37.8 27.063 5.6710
VE/VO2_VOP 8 21.2 36.5 29.863 5.5693
RER_VOP 8 1.06 1.35 1.1825 .10566
VO2/Kg_VOP 8 18.0 64.0 42.375 15.2497
Valid N (listwise) 8
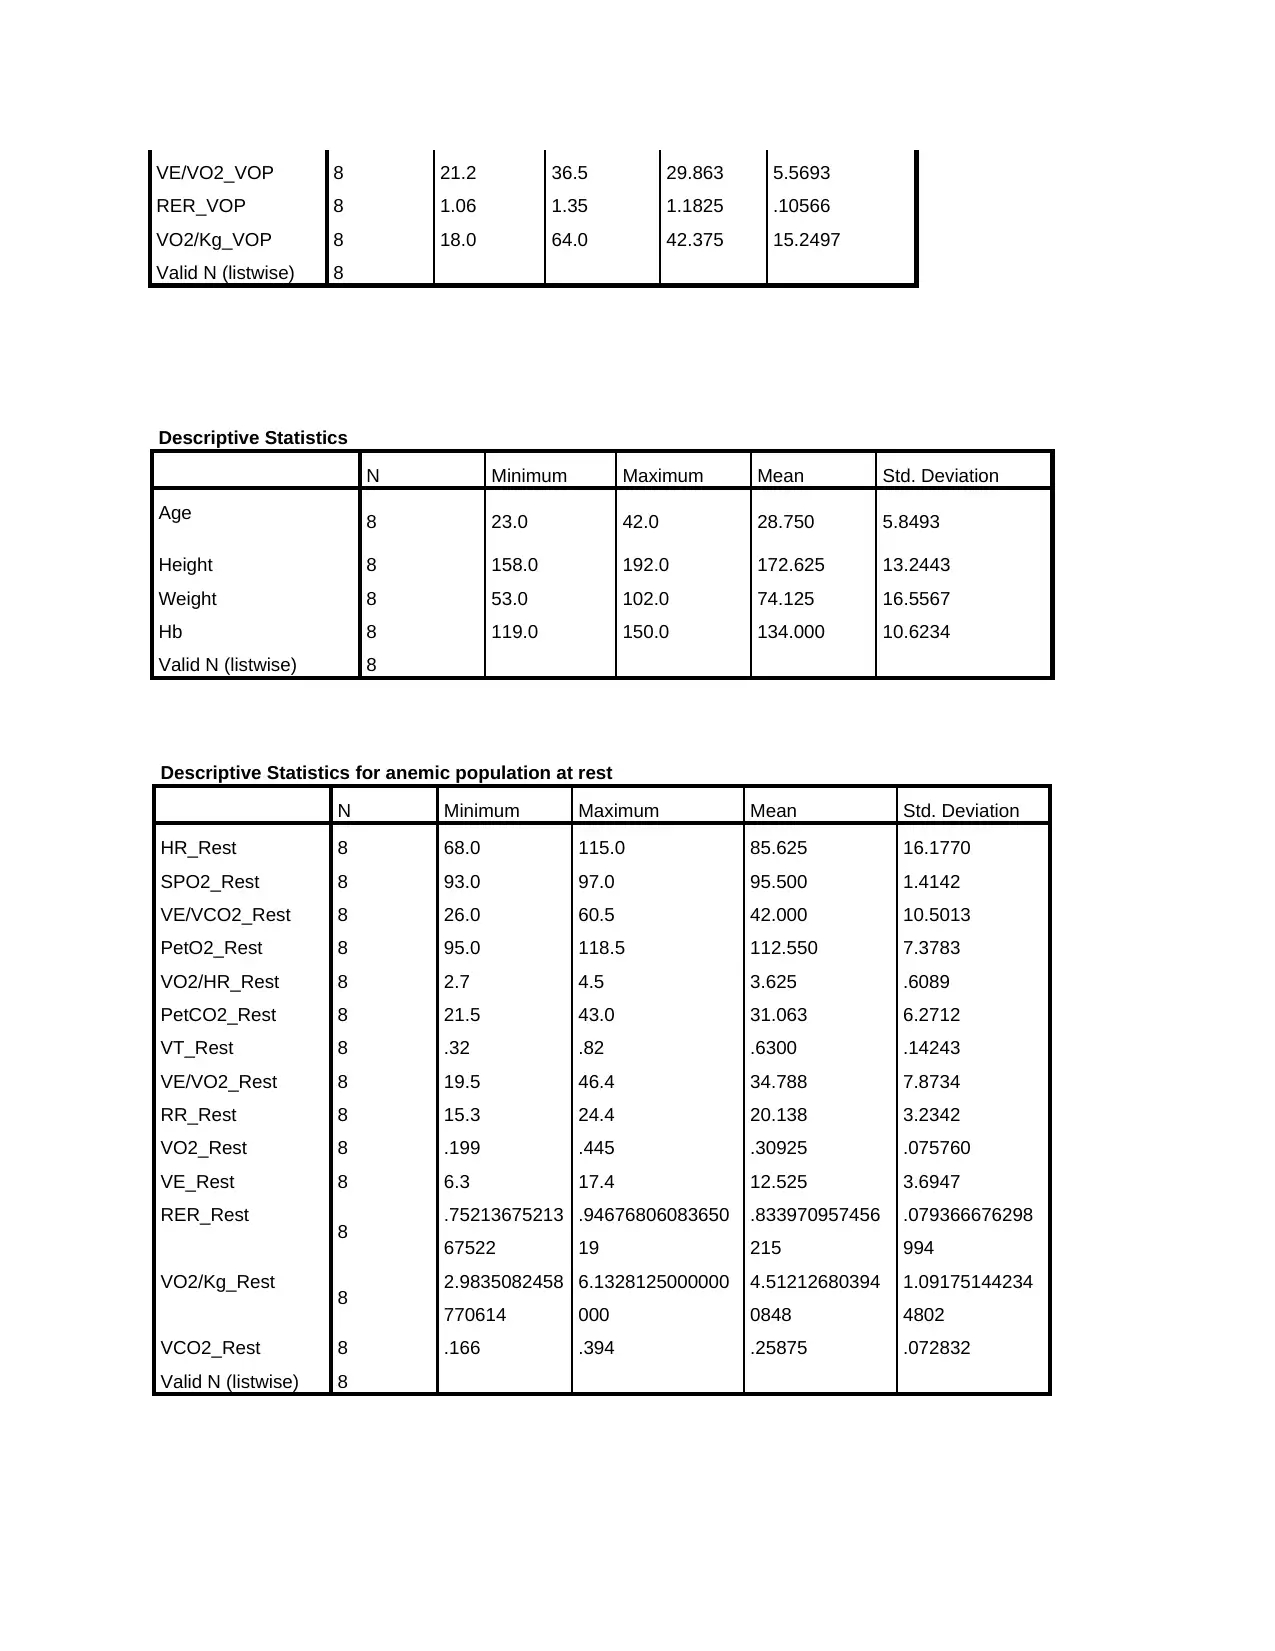
Descriptive Statistics
N Minimum Maximum Mean Std. Deviation
Age 8 23.0 42.0 28.750 5.8493
Height 8 158.0 192.0 172.625 13.2443
Weight 8 53.0 102.0 74.125 16.5567
Hb 8 119.0 150.0 134.000 10.6234
Valid N (listwise) 8
Descriptive Statistics for anemic population at rest
N Minimum Maximum Mean Std. Deviation
HR_Rest 8 68.0 115.0 85.625 16.1770
SPO2_Rest 8 93.0 97.0 95.500 1.4142
VE/VCO2_Rest 8 26.0 60.5 42.000 10.5013
PetO2_Rest 8 95.0 118.5 112.550 7.3783
VO2/HR_Rest 8 2.7 4.5 3.625 .6089
PetCO2_Rest 8 21.5 43.0 31.063 6.2712
VT_Rest 8 .32 .82 .6300 .14243
VE/VO2_Rest 8 19.5 46.4 34.788 7.8734
RR_Rest 8 15.3 24.4 20.138 3.2342
VO2_Rest 8 .199 .445 .30925 .075760
VE_Rest 8 6.3 17.4 12.525 3.6947
RER_Rest 8 .75213675213
67522
.94676806083650
19
.833970957456
215
.079366676298
994
VO2/Kg_Rest 8 2.9835082458
770614
6.1328125000000
000
4.51212680394
0848
1.09175144234
4802
VCO2_Rest 8 .166 .394 .25875 .072832
Valid N (listwise) 8
RER_VOP 8 1.06 1.35 1.1825 .10566
VO2/Kg_VOP 8 18.0 64.0 42.375 15.2497
Valid N (listwise) 8
Descriptive Statistics
N Minimum Maximum Mean Std. Deviation
Age 8 23.0 42.0 28.750 5.8493
Height 8 158.0 192.0 172.625 13.2443
Weight 8 53.0 102.0 74.125 16.5567
Hb 8 119.0 150.0 134.000 10.6234
Valid N (listwise) 8
Descriptive Statistics for anemic population at rest
N Minimum Maximum Mean Std. Deviation
HR_Rest 8 68.0 115.0 85.625 16.1770
SPO2_Rest 8 93.0 97.0 95.500 1.4142
VE/VCO2_Rest 8 26.0 60.5 42.000 10.5013
PetO2_Rest 8 95.0 118.5 112.550 7.3783
VO2/HR_Rest 8 2.7 4.5 3.625 .6089
PetCO2_Rest 8 21.5 43.0 31.063 6.2712
VT_Rest 8 .32 .82 .6300 .14243
VE/VO2_Rest 8 19.5 46.4 34.788 7.8734
RR_Rest 8 15.3 24.4 20.138 3.2342
VO2_Rest 8 .199 .445 .30925 .075760
VE_Rest 8 6.3 17.4 12.525 3.6947
RER_Rest 8 .75213675213
67522
.94676806083650
19
.833970957456
215
.079366676298
994
VO2/Kg_Rest 8 2.9835082458
770614
6.1328125000000
000
4.51212680394
0848
1.09175144234
4802
VCO2_Rest 8 .166 .394 .25875 .072832
Valid N (listwise) 8
⊘ This is a preview!⊘
Do you want full access?
Subscribe today to unlock all pages.
Trusted by 1+ million students worldwide
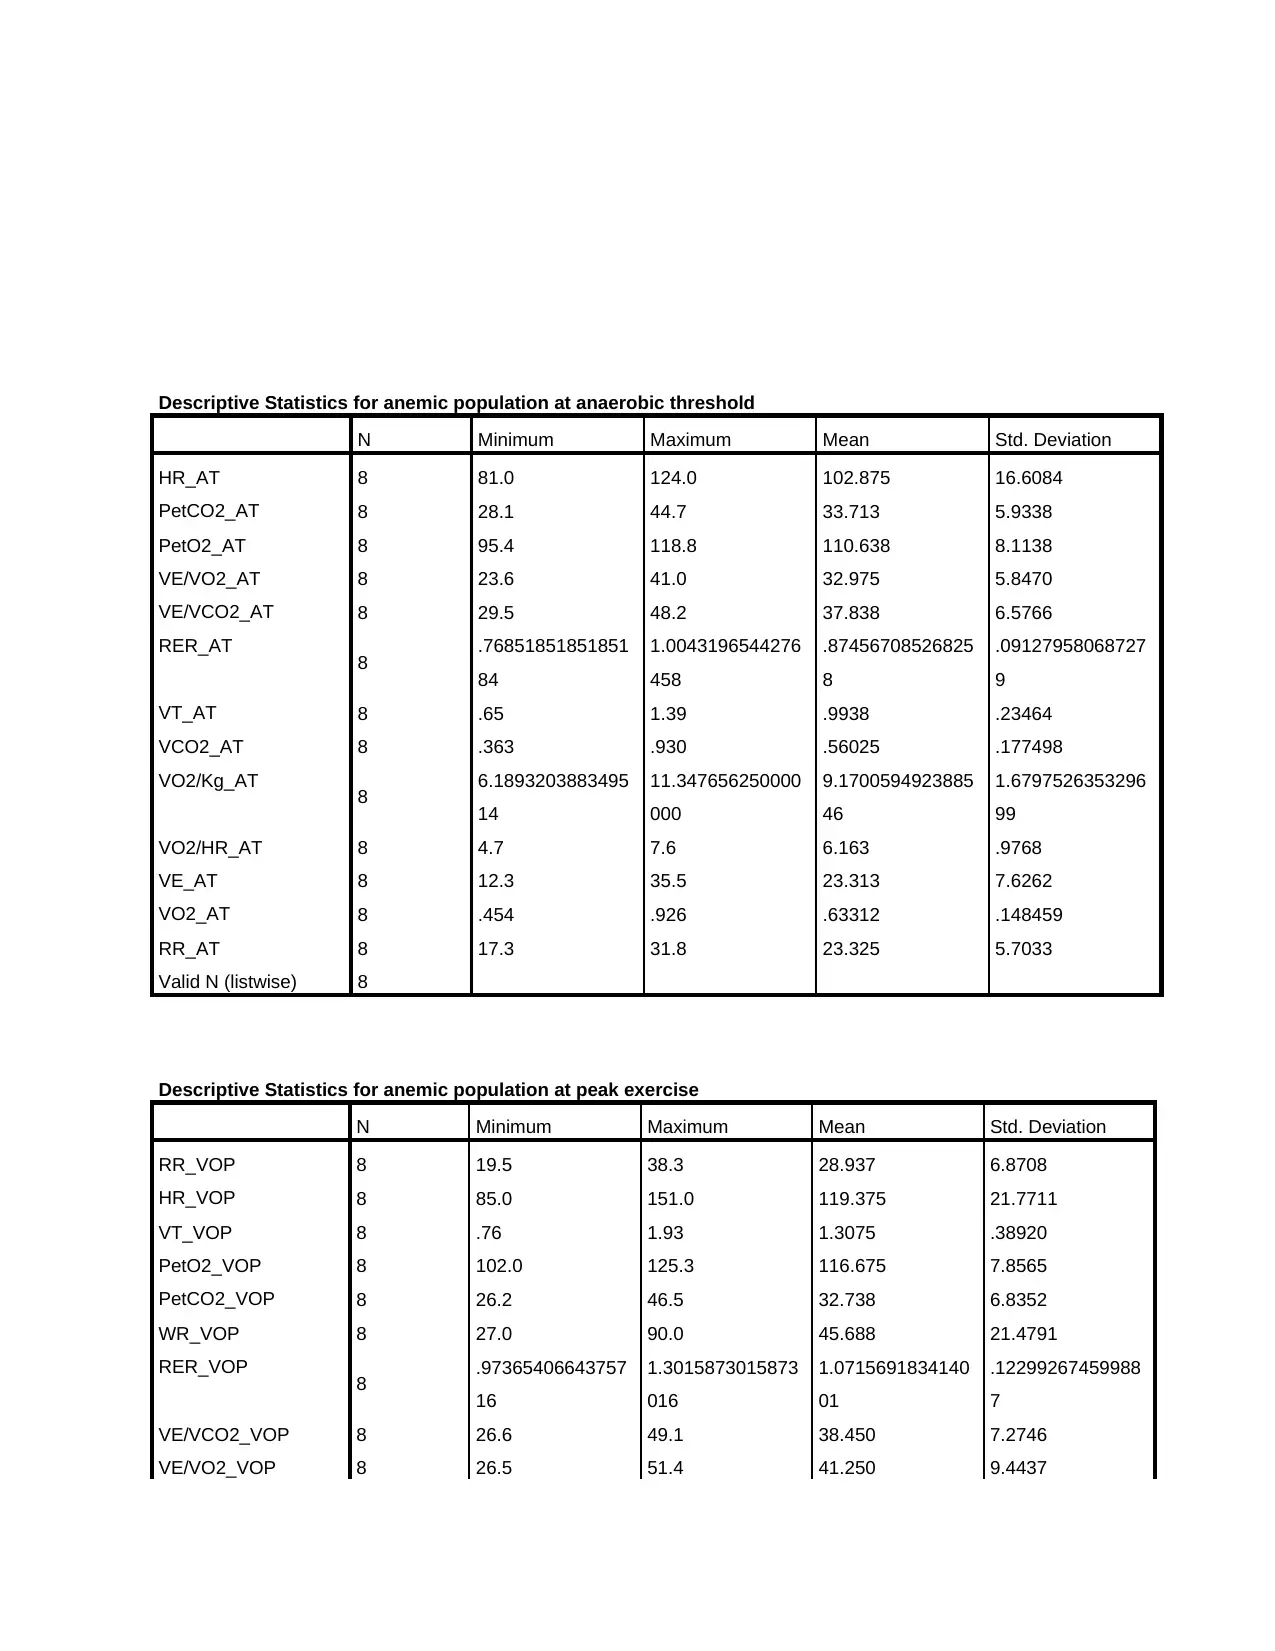
Descriptive Statistics for anemic population at anaerobic threshold
N Minimum Maximum Mean Std. Deviation
HR_AT 8 81.0 124.0 102.875 16.6084
PetCO2_AT 8 28.1 44.7 33.713 5.9338
PetO2_AT 8 95.4 118.8 110.638 8.1138
VE/VO2_AT 8 23.6 41.0 32.975 5.8470
VE/VCO2_AT 8 29.5 48.2 37.838 6.5766
RER_AT 8 .76851851851851
84
1.0043196544276
458
.87456708526825
8
.09127958068727
9
VT_AT 8 .65 1.39 .9938 .23464
VCO2_AT 8 .363 .930 .56025 .177498
VO2/Kg_AT 8 6.1893203883495
14
11.347656250000
000
9.1700594923885
46
1.6797526353296
99
VO2/HR_AT 8 4.7 7.6 6.163 .9768
VE_AT 8 12.3 35.5 23.313 7.6262
VO2_AT 8 .454 .926 .63312 .148459
RR_AT 8 17.3 31.8 23.325 5.7033
Valid N (listwise) 8
Descriptive Statistics for anemic population at peak exercise
N Minimum Maximum Mean Std. Deviation
RR_VOP 8 19.5 38.3 28.937 6.8708
HR_VOP 8 85.0 151.0 119.375 21.7711
VT_VOP 8 .76 1.93 1.3075 .38920
PetO2_VOP 8 102.0 125.3 116.675 7.8565
PetCO2_VOP 8 26.2 46.5 32.738 6.8352
WR_VOP 8 27.0 90.0 45.688 21.4791
RER_VOP 8 .97365406643757
16
1.3015873015873
016
1.0715691834140
01
.12299267459988
7
VE/VCO2_VOP 8 26.6 49.1 38.450 7.2746
VE/VO2_VOP 8 26.5 51.4 41.250 9.4437
N Minimum Maximum Mean Std. Deviation
HR_AT 8 81.0 124.0 102.875 16.6084
PetCO2_AT 8 28.1 44.7 33.713 5.9338
PetO2_AT 8 95.4 118.8 110.638 8.1138
VE/VO2_AT 8 23.6 41.0 32.975 5.8470
VE/VCO2_AT 8 29.5 48.2 37.838 6.5766
RER_AT 8 .76851851851851
84
1.0043196544276
458
.87456708526825
8
.09127958068727
9
VT_AT 8 .65 1.39 .9938 .23464
VCO2_AT 8 .363 .930 .56025 .177498
VO2/Kg_AT 8 6.1893203883495
14
11.347656250000
000
9.1700594923885
46
1.6797526353296
99
VO2/HR_AT 8 4.7 7.6 6.163 .9768
VE_AT 8 12.3 35.5 23.313 7.6262
VO2_AT 8 .454 .926 .63312 .148459
RR_AT 8 17.3 31.8 23.325 5.7033
Valid N (listwise) 8
Descriptive Statistics for anemic population at peak exercise
N Minimum Maximum Mean Std. Deviation
RR_VOP 8 19.5 38.3 28.937 6.8708
HR_VOP 8 85.0 151.0 119.375 21.7711
VT_VOP 8 .76 1.93 1.3075 .38920
PetO2_VOP 8 102.0 125.3 116.675 7.8565
PetCO2_VOP 8 26.2 46.5 32.738 6.8352
WR_VOP 8 27.0 90.0 45.688 21.4791
RER_VOP 8 .97365406643757
16
1.3015873015873
016
1.0715691834140
01
.12299267459988
7
VE/VCO2_VOP 8 26.6 49.1 38.450 7.2746
VE/VO2_VOP 8 26.5 51.4 41.250 9.4437
Paraphrase This Document
Need a fresh take? Get an instant paraphrase of this document with our AI Paraphraser
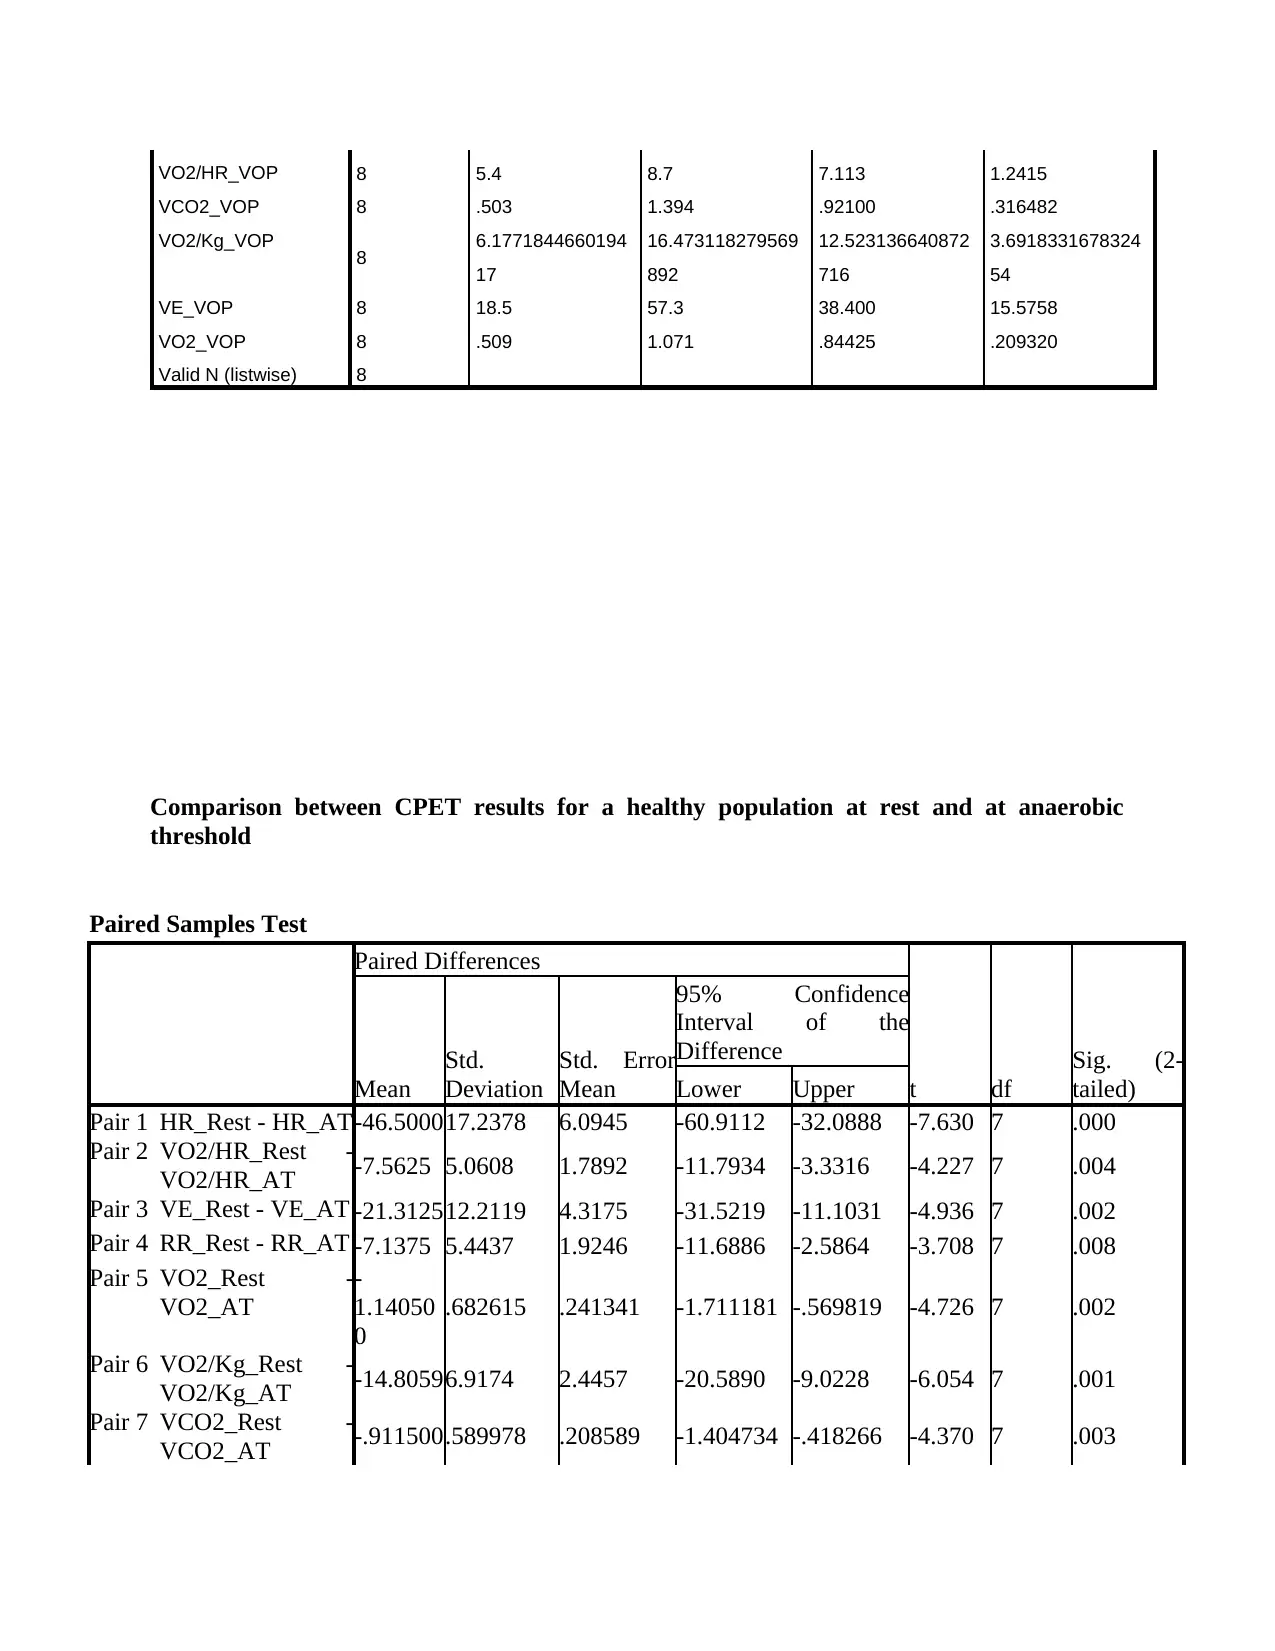
VO2/HR_VOP 8 5.4 8.7 7.113 1.2415
VCO2_VOP 8 .503 1.394 .92100 .316482
VO2/Kg_VOP 8 6.1771844660194
17
16.473118279569
892
12.523136640872
716
3.6918331678324
54
VE_VOP 8 18.5 57.3 38.400 15.5758
VO2_VOP 8 .509 1.071 .84425 .209320
Valid N (listwise) 8
Comparison between CPET results for a healthy population at rest and at anaerobic
threshold
Paired Samples Test
Paired Differences
t df
Sig. (2-
tailed)Mean
Std.
Deviation
Std. Error
Mean
95% Confidence
Interval of the
Difference
Lower Upper
Pair 1 HR_Rest - HR_AT-46.500017.2378 6.0945 -60.9112 -32.0888 -7.630 7 .000
Pair 2 VO2/HR_Rest -
VO2/HR_AT -7.5625 5.0608 1.7892 -11.7934 -3.3316 -4.227 7 .004
Pair 3 VE_Rest - VE_AT -21.312512.2119 4.3175 -31.5219 -11.1031 -4.936 7 .002
Pair 4 RR_Rest - RR_AT -7.1375 5.4437 1.9246 -11.6886 -2.5864 -3.708 7 .008
Pair 5 VO2_Rest -
VO2_AT
-
1.14050
0
.682615 .241341 -1.711181 -.569819 -4.726 7 .002
Pair 6 VO2/Kg_Rest -
VO2/Kg_AT -14.80596.9174 2.4457 -20.5890 -9.0228 -6.054 7 .001
Pair 7 VCO2_Rest -
VCO2_AT -.911500.589978 .208589 -1.404734 -.418266 -4.370 7 .003
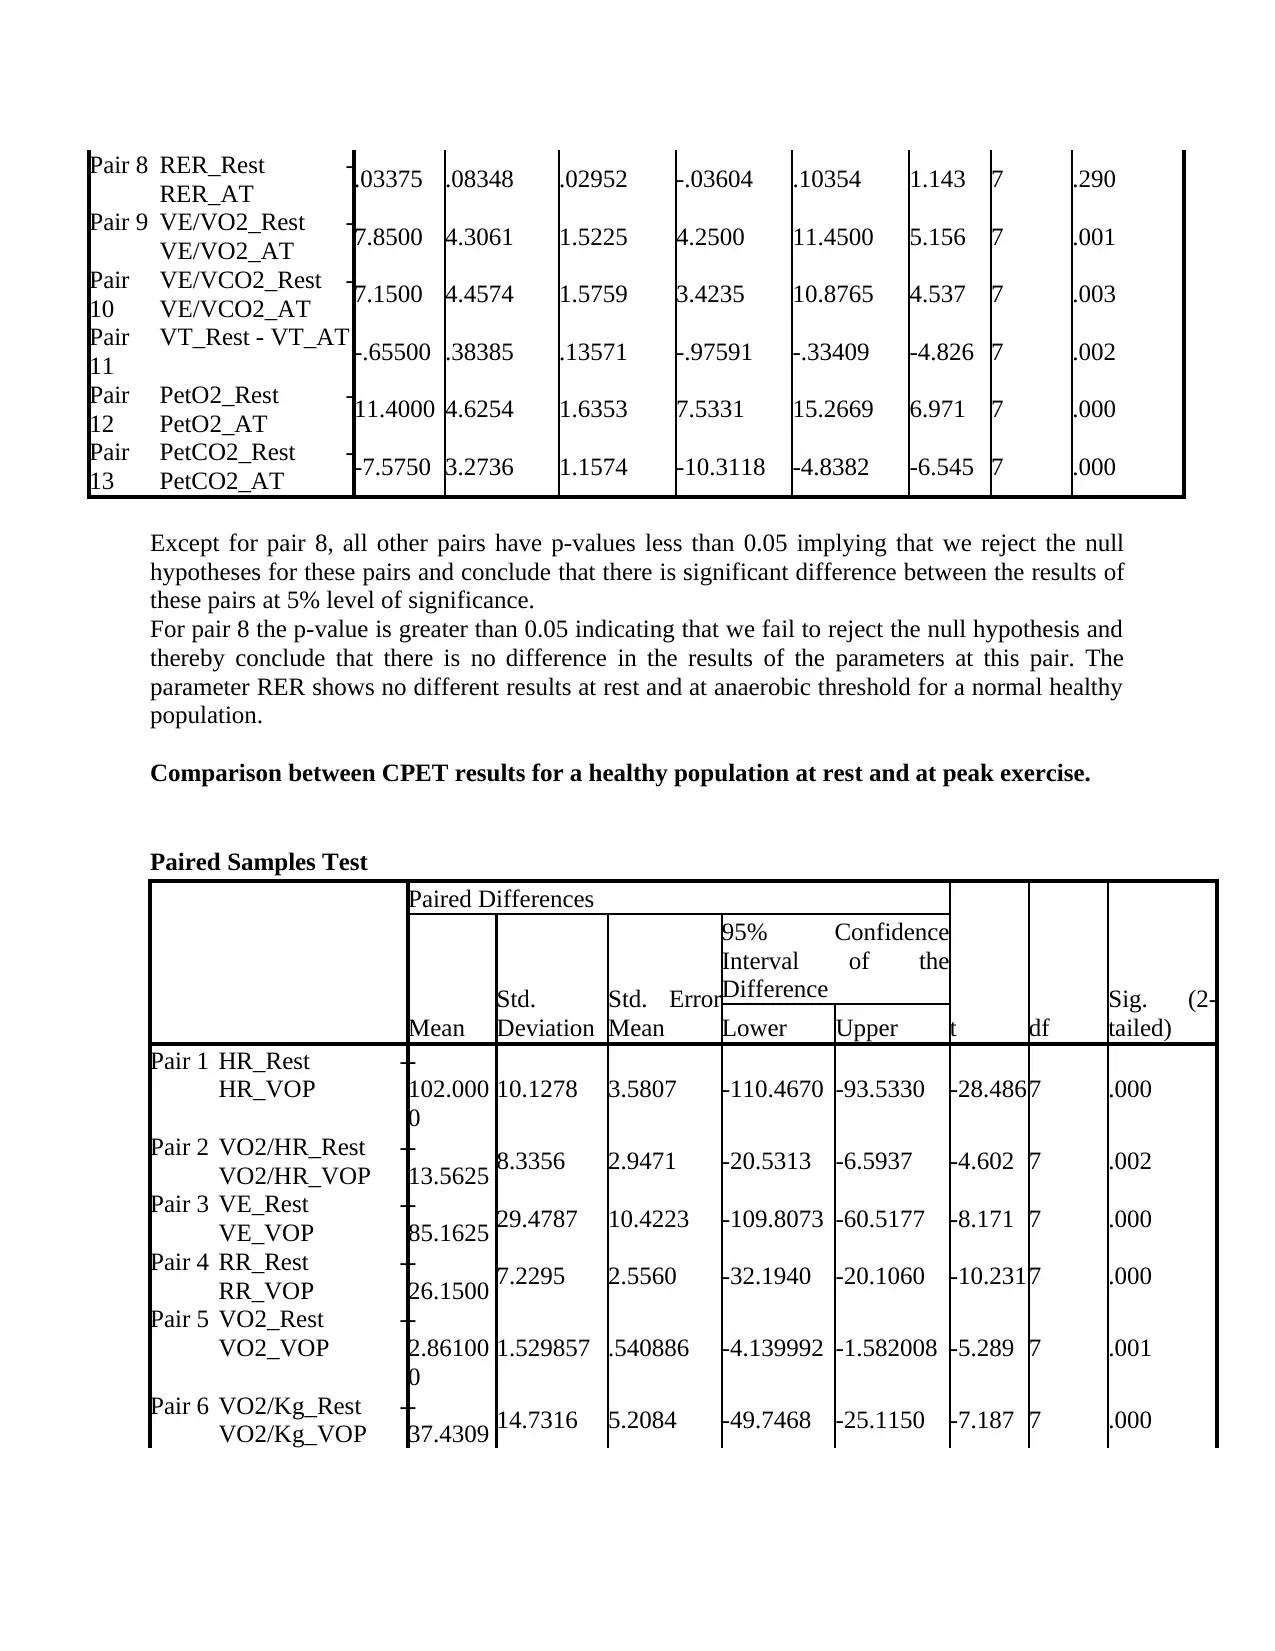
Pair 8 RER_Rest -
RER_AT .03375 .08348 .02952 -.03604 .10354 1.143 7 .290
Pair 9 VE/VO2_Rest -
VE/VO2_AT 7.8500 4.3061 1.5225 4.2500 11.4500 5.156 7 .001
Pair
10
VE/VCO2_Rest -
VE/VCO2_AT 7.1500 4.4574 1.5759 3.4235 10.8765 4.537 7 .003
Pair
11
VT_Rest - VT_AT -.65500 .38385 .13571 -.97591 -.33409 -4.826 7 .002
Pair
12
PetO2_Rest -
PetO2_AT 11.4000 4.6254 1.6353 7.5331 15.2669 6.971 7 .000
Pair
13
PetCO2_Rest -
PetCO2_AT -7.5750 3.2736 1.1574 -10.3118 -4.8382 -6.545 7 .000
Except for pair 8, all other pairs have p-values less than 0.05 implying that we reject the null
hypotheses for these pairs and conclude that there is significant difference between the results of
these pairs at 5% level of significance.
For pair 8 the p-value is greater than 0.05 indicating that we fail to reject the null hypothesis and
thereby conclude that there is no difference in the results of the parameters at this pair. The
parameter RER shows no different results at rest and at anaerobic threshold for a normal healthy
population.
Comparison between CPET results for a healthy population at rest and at peak exercise.
Paired Samples Test
Paired Differences
t df
Sig. (2-
tailed)Mean
Std.
Deviation
Std. Error
Mean
95% Confidence
Interval of the
Difference
Lower Upper
Pair 1 HR_Rest -
HR_VOP
-
102.000
0
10.1278 3.5807 -110.4670 -93.5330 -28.4867 .000
Pair 2 VO2/HR_Rest -
VO2/HR_VOP
-
13.5625 8.3356 2.9471 -20.5313 -6.5937 -4.602 7 .002
Pair 3 VE_Rest -
VE_VOP
-
85.1625 29.4787 10.4223 -109.8073 -60.5177 -8.171 7 .000
Pair 4 RR_Rest -
RR_VOP
-
26.1500 7.2295 2.5560 -32.1940 -20.1060 -10.2317 .000
Pair 5 VO2_Rest -
VO2_VOP
-
2.86100
0
1.529857 .540886 -4.139992 -1.582008 -5.289 7 .001
Pair 6 VO2/Kg_Rest -
VO2/Kg_VOP
-
37.4309 14.7316 5.2084 -49.7468 -25.1150 -7.187 7 .000
⊘ This is a preview!⊘
Do you want full access?
Subscribe today to unlock all pages.
Trusted by 1+ million students worldwide
1 out of 31
Your All-in-One AI-Powered Toolkit for Academic Success.
+13062052269
info@desklib.com
Available 24*7 on WhatsApp / Email
![[object Object]](/_next/static/media/star-bottom.7253800d.svg)
Unlock your academic potential
Copyright © 2020–2026 A2Z Services. All Rights Reserved. Developed and managed by ZUCOL.