Federation University: ITECH1103 Chicago Crime Data Analysis Project
VerifiedAdded on 2023/06/03
|14
|2099
|332
Report
AI Summary
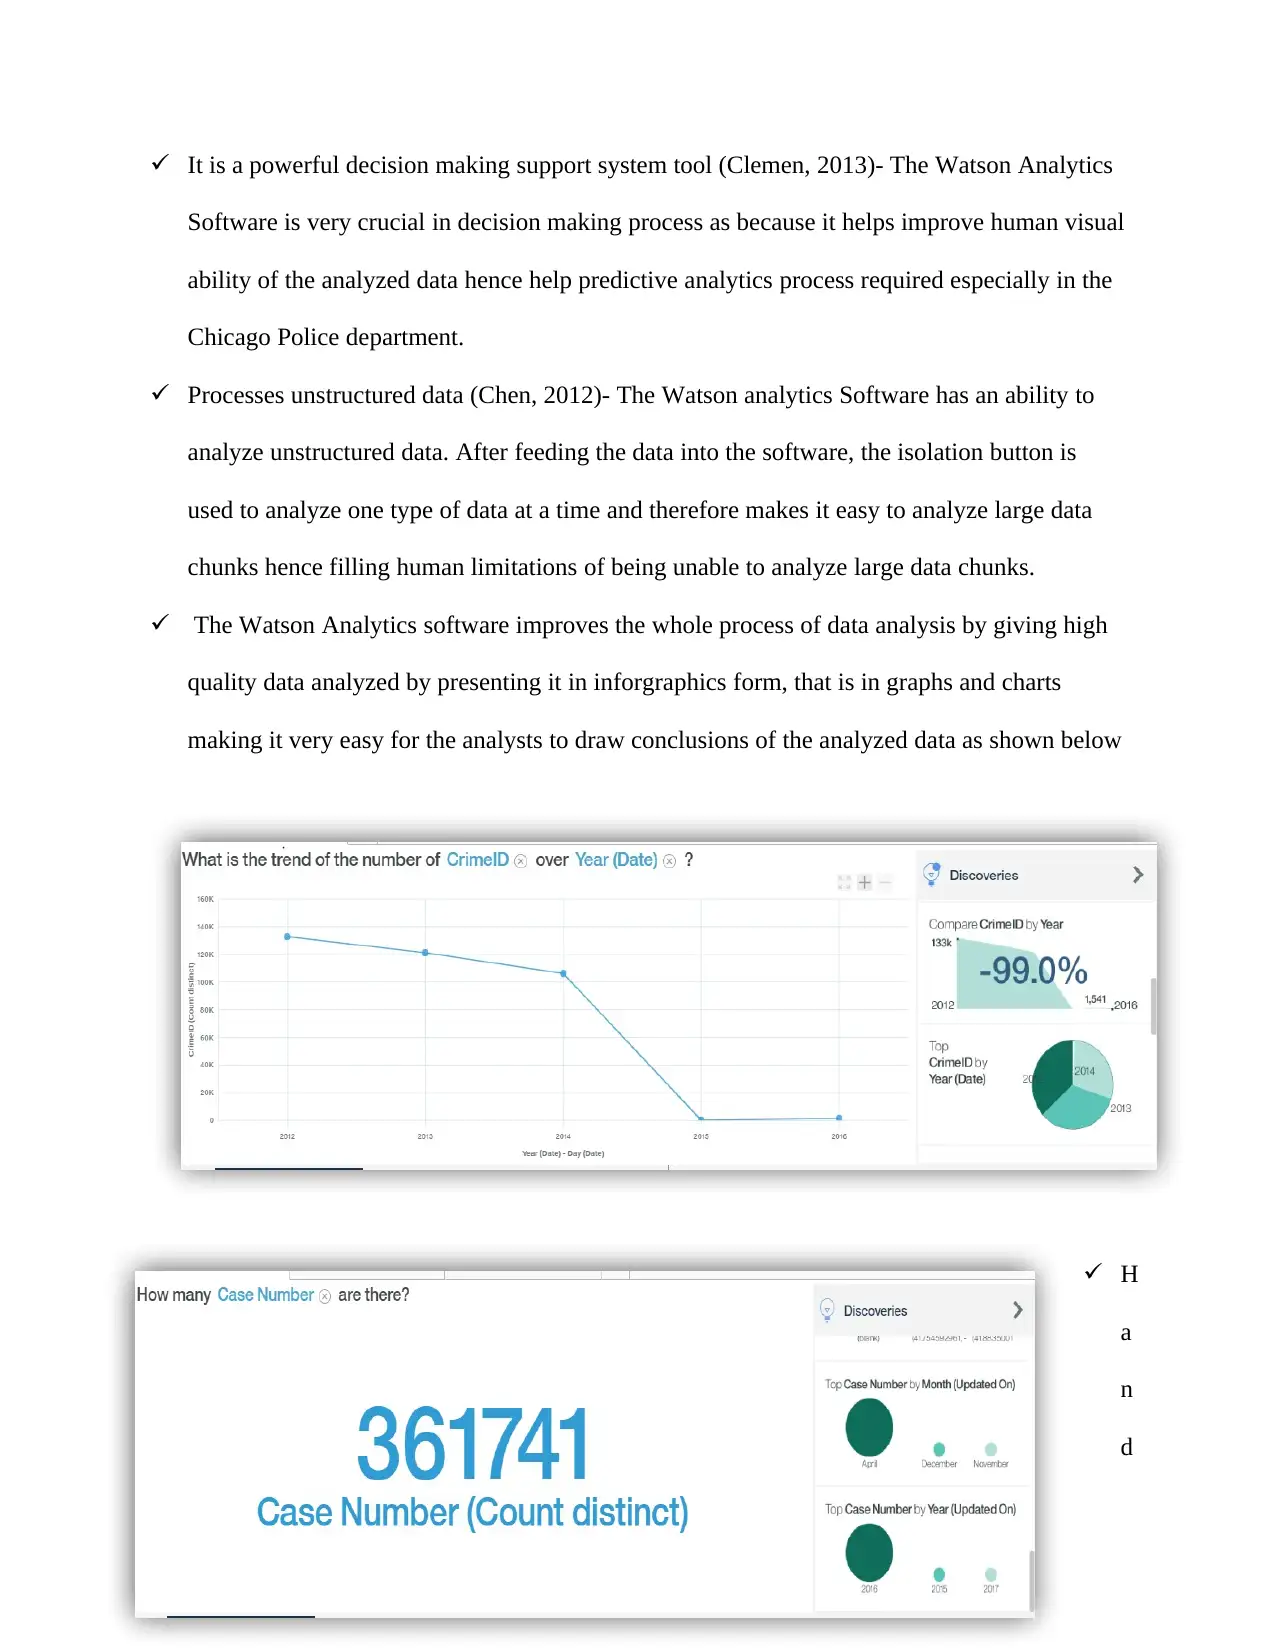
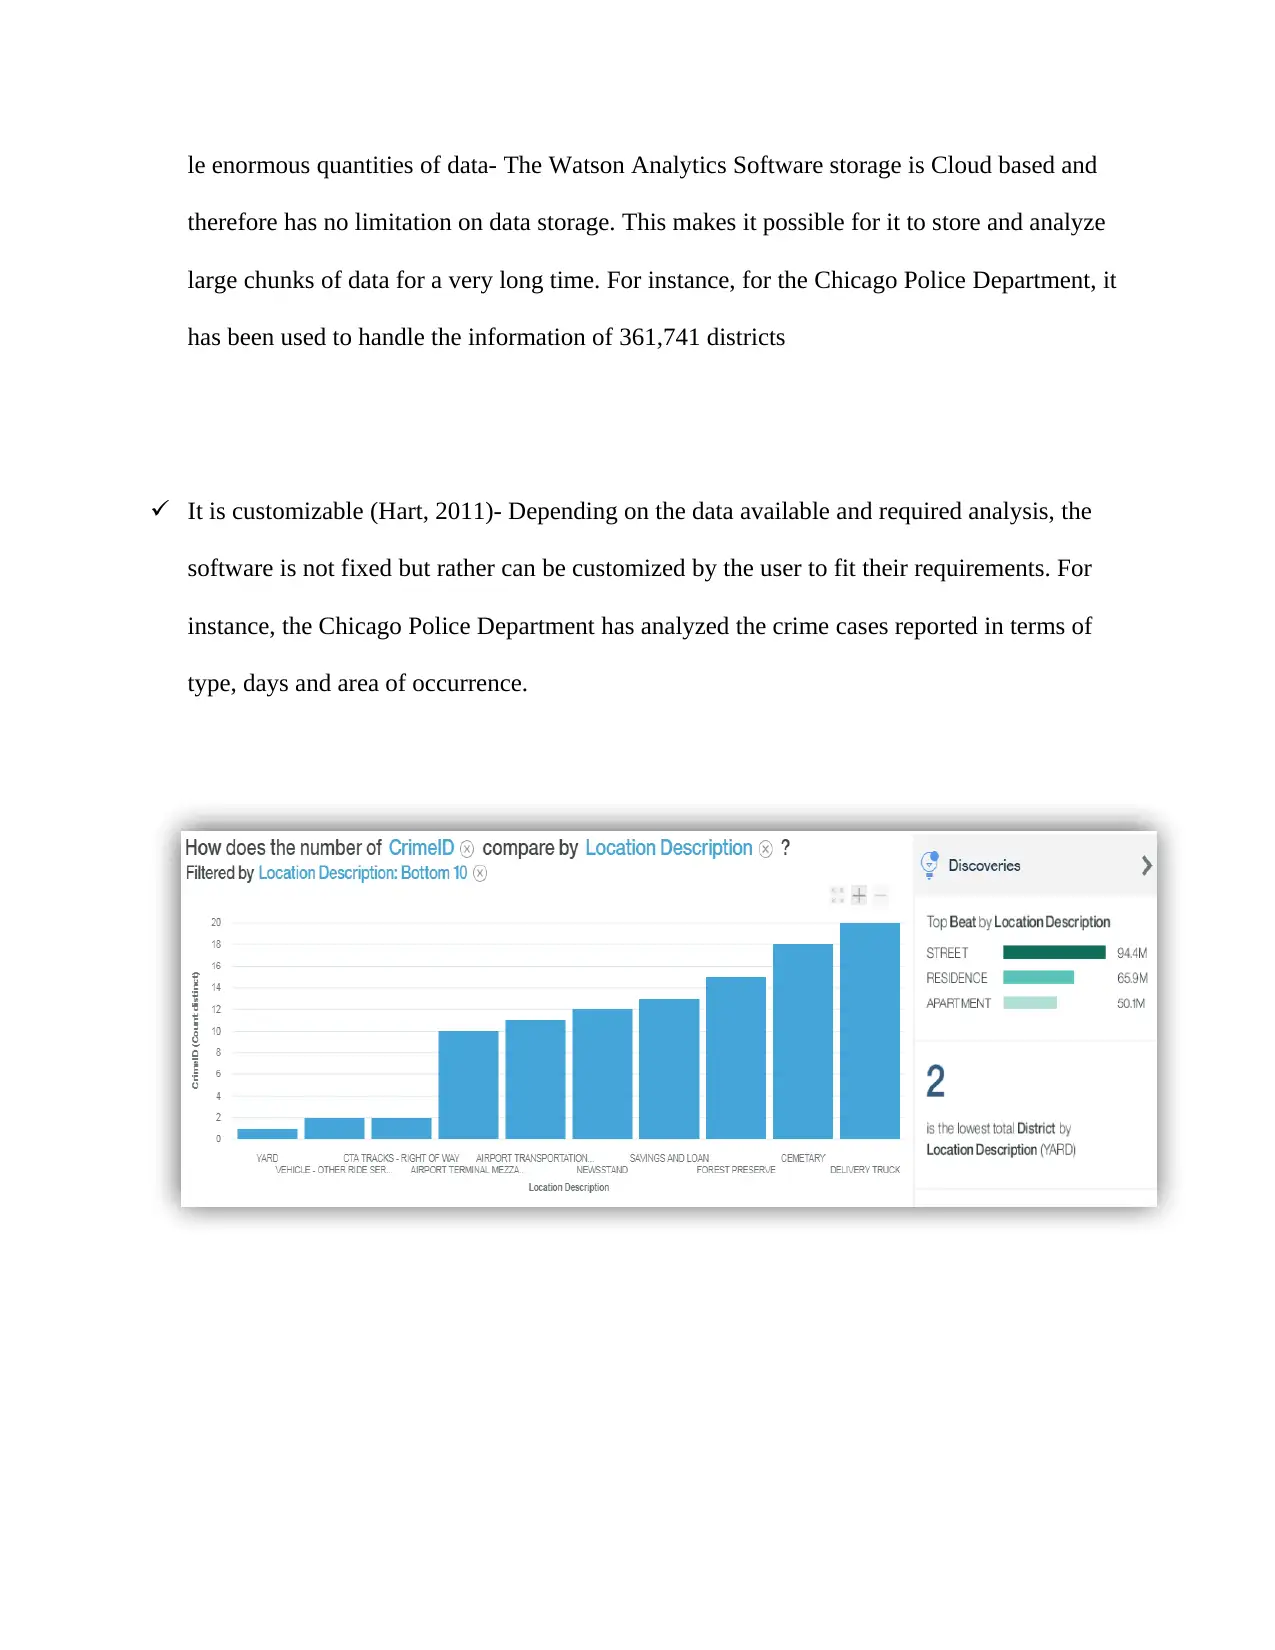
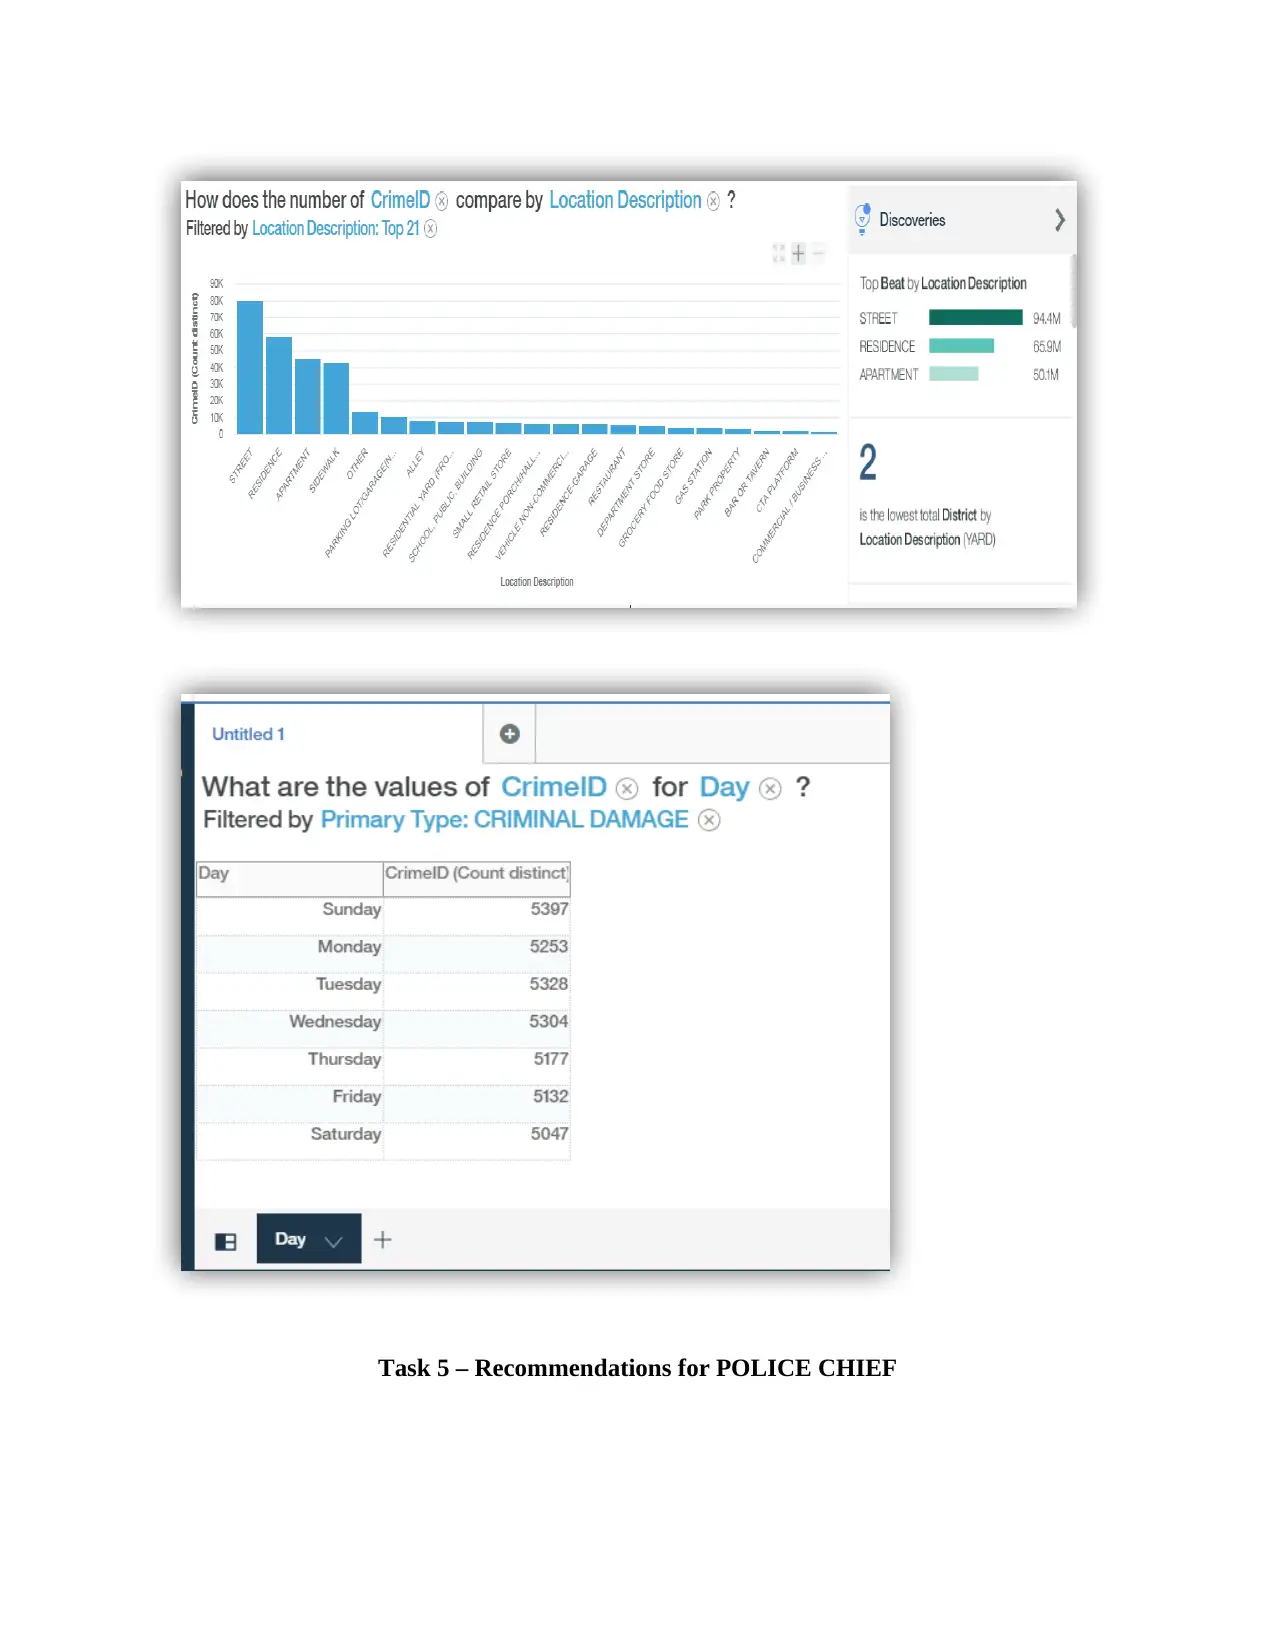
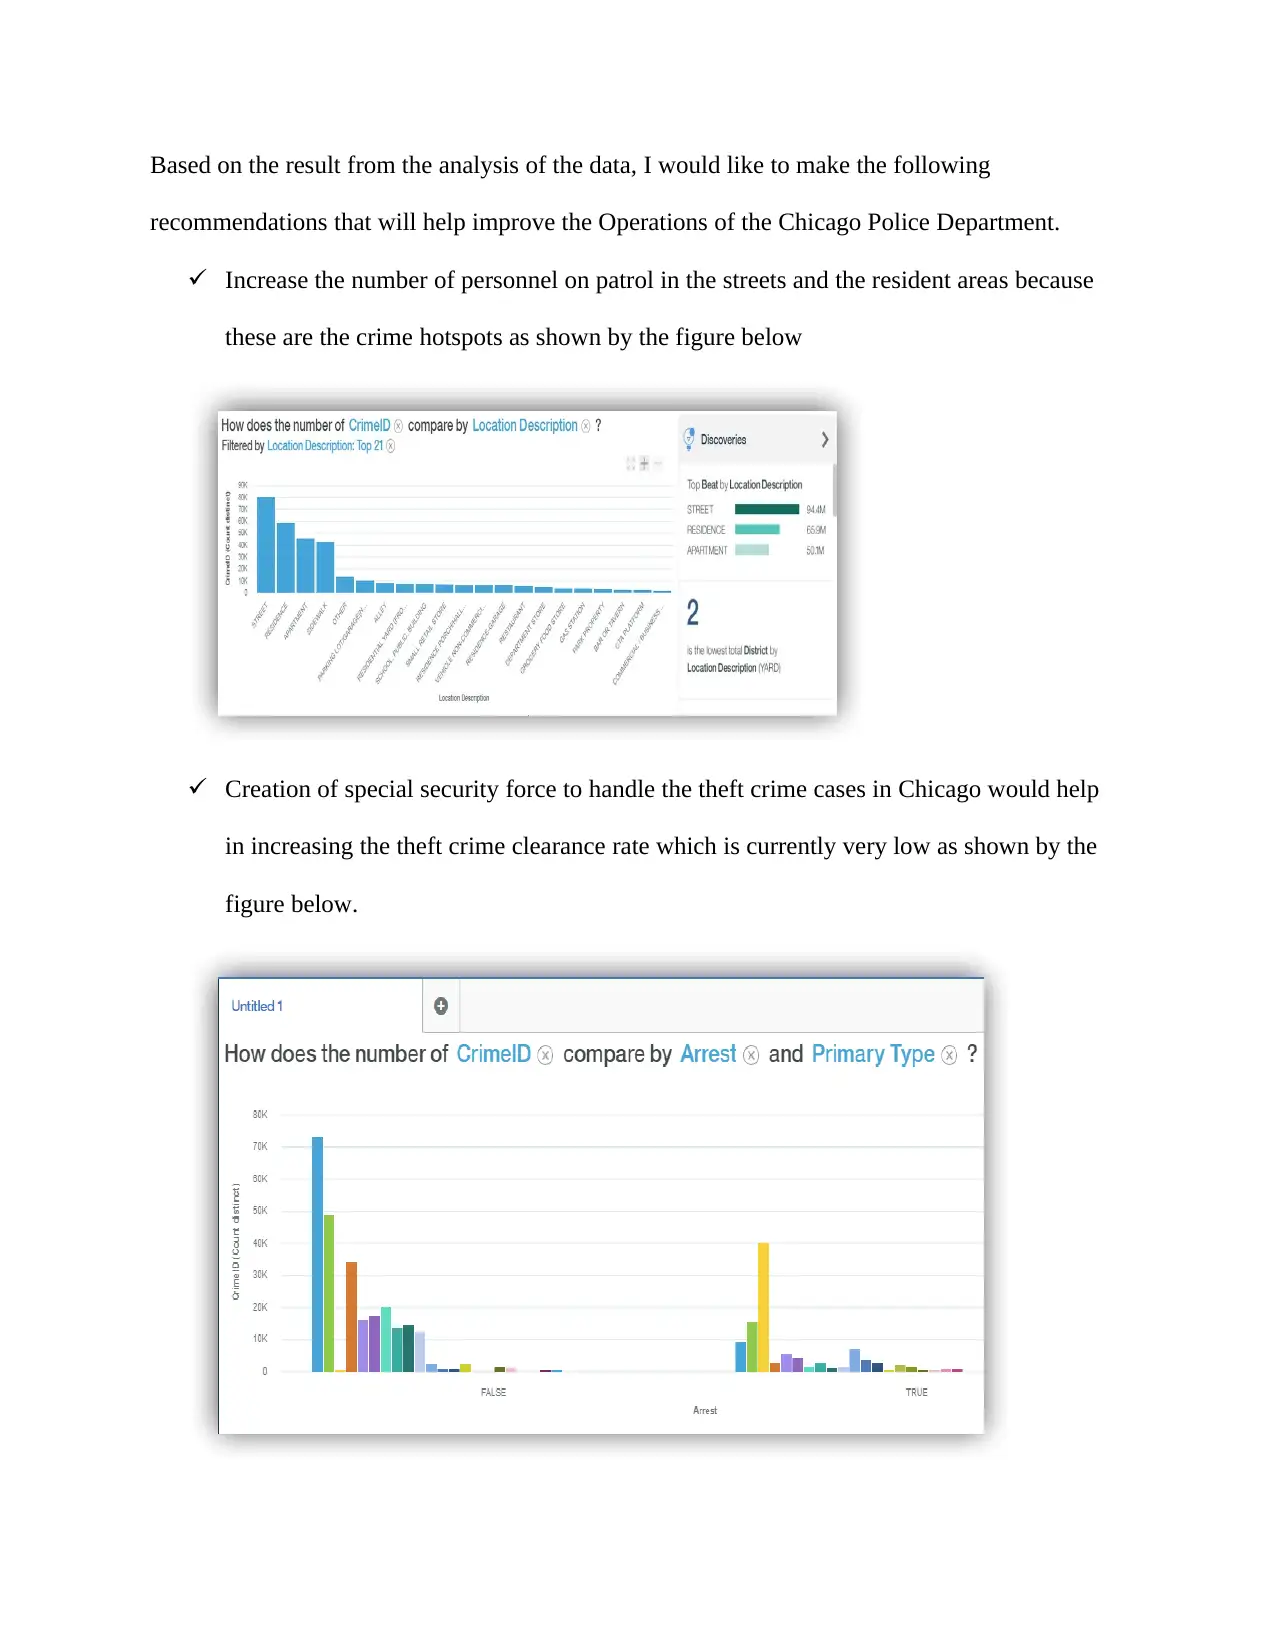
This report analyzes crime data from the Chicago Police Department for the year 2012 using Watson Analytics. The project aims to identify crime patterns, trends, and provide predictive insights to inform strategies for improving city security. The analysis covers various aspects of reported crimes, including time, location, type, and clearance rates. Key findings include the low safe city index, low crime clearance rates, and crime hotspots in residential areas. Recommendations are provided to the Police Chief, such as increasing patrols in crime hotspots, creating special security forces for theft, and collaborating with other agencies to reduce narcotics crimes. The report concludes with a reflection on the benefits of using Watson Analytics and the challenges encountered during the project. References to relevant research and resources are also included.
1 out of 14
Related Documents


Your All-in-One AI-Powered Toolkit for Academic Success.
+13062052269
info@desklib.com
Available 24*7 on WhatsApp / Email
![[object Object]](/_next/static/media/star-bottom.7253800d.svg)
Copyright © 2020–2026 A2Z Services. All Rights Reserved. Developed and managed by ZUCOL.