Extra Credit Assignment: Crime Map Data Analysis and Implications

Verified

Added on  2022/10/12

|6
|1283
|68
Homework Assignment
AI Summary
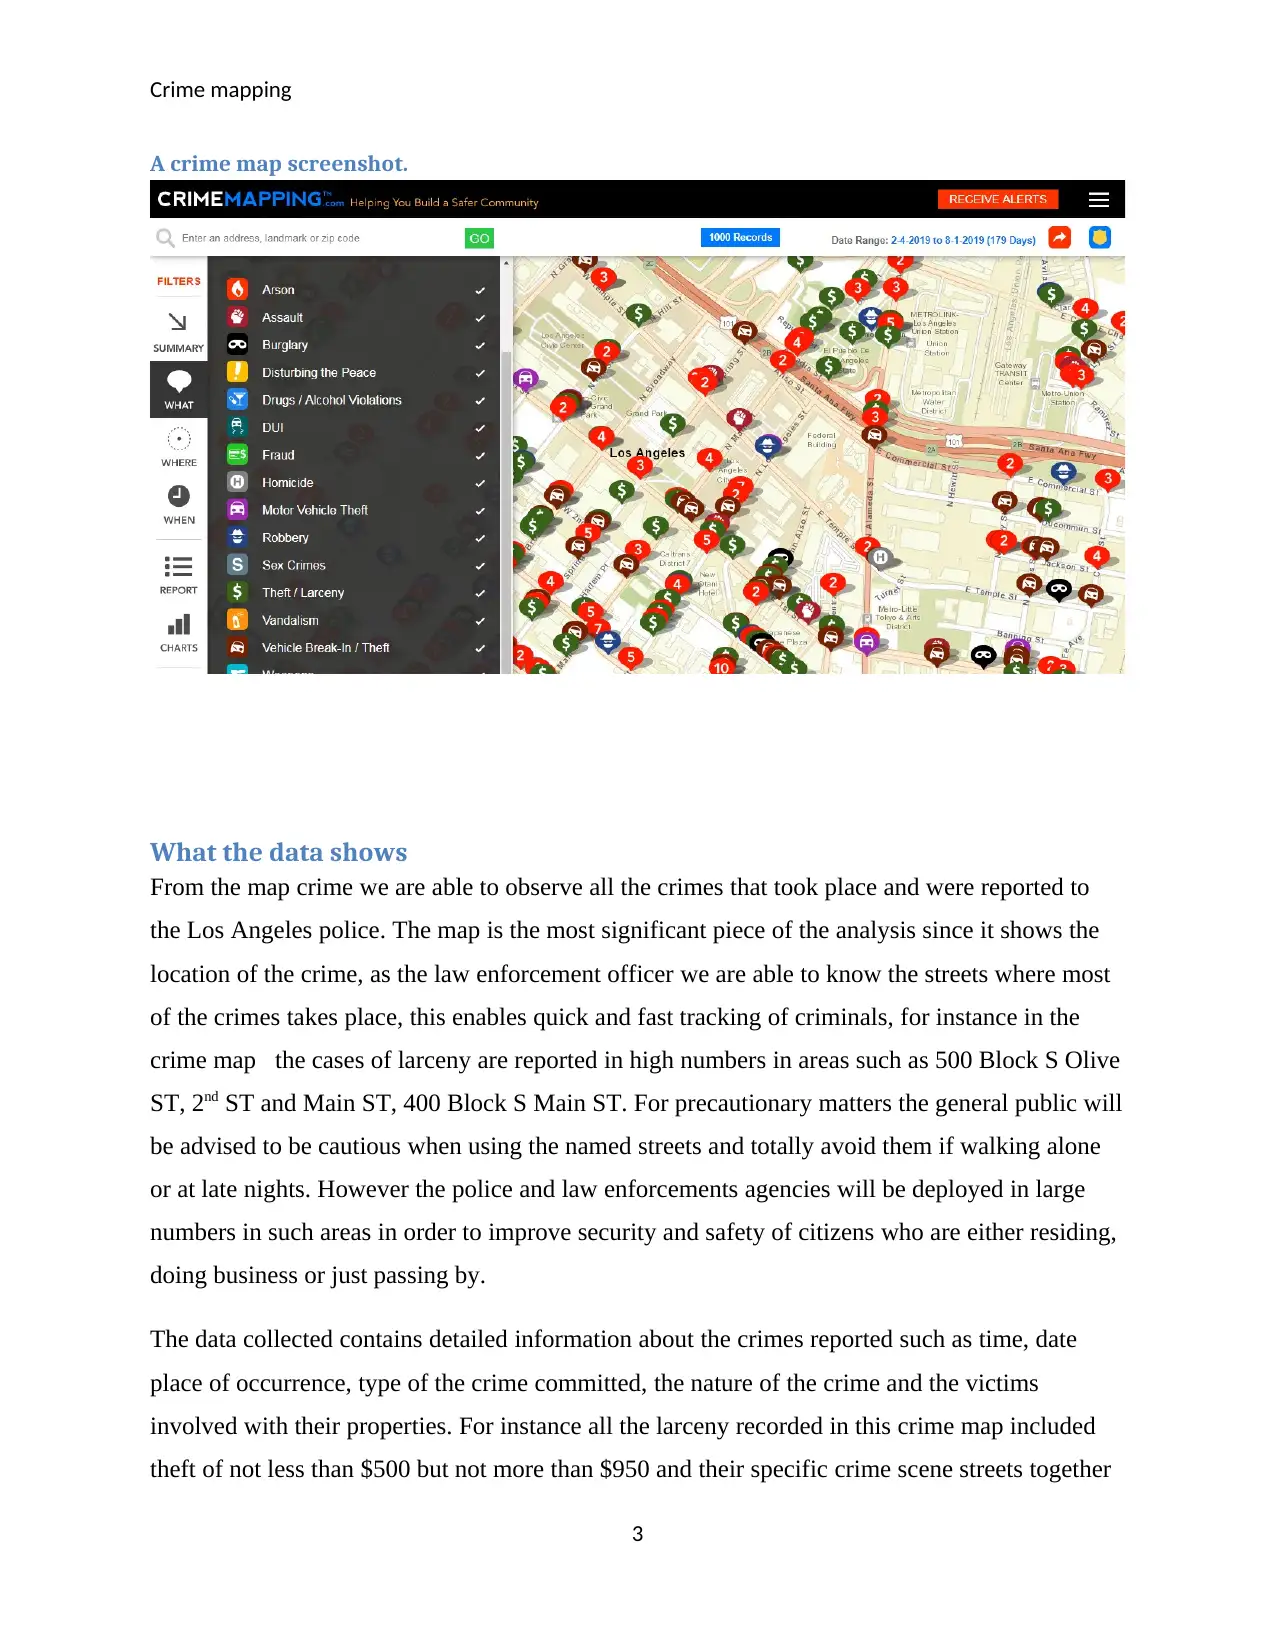
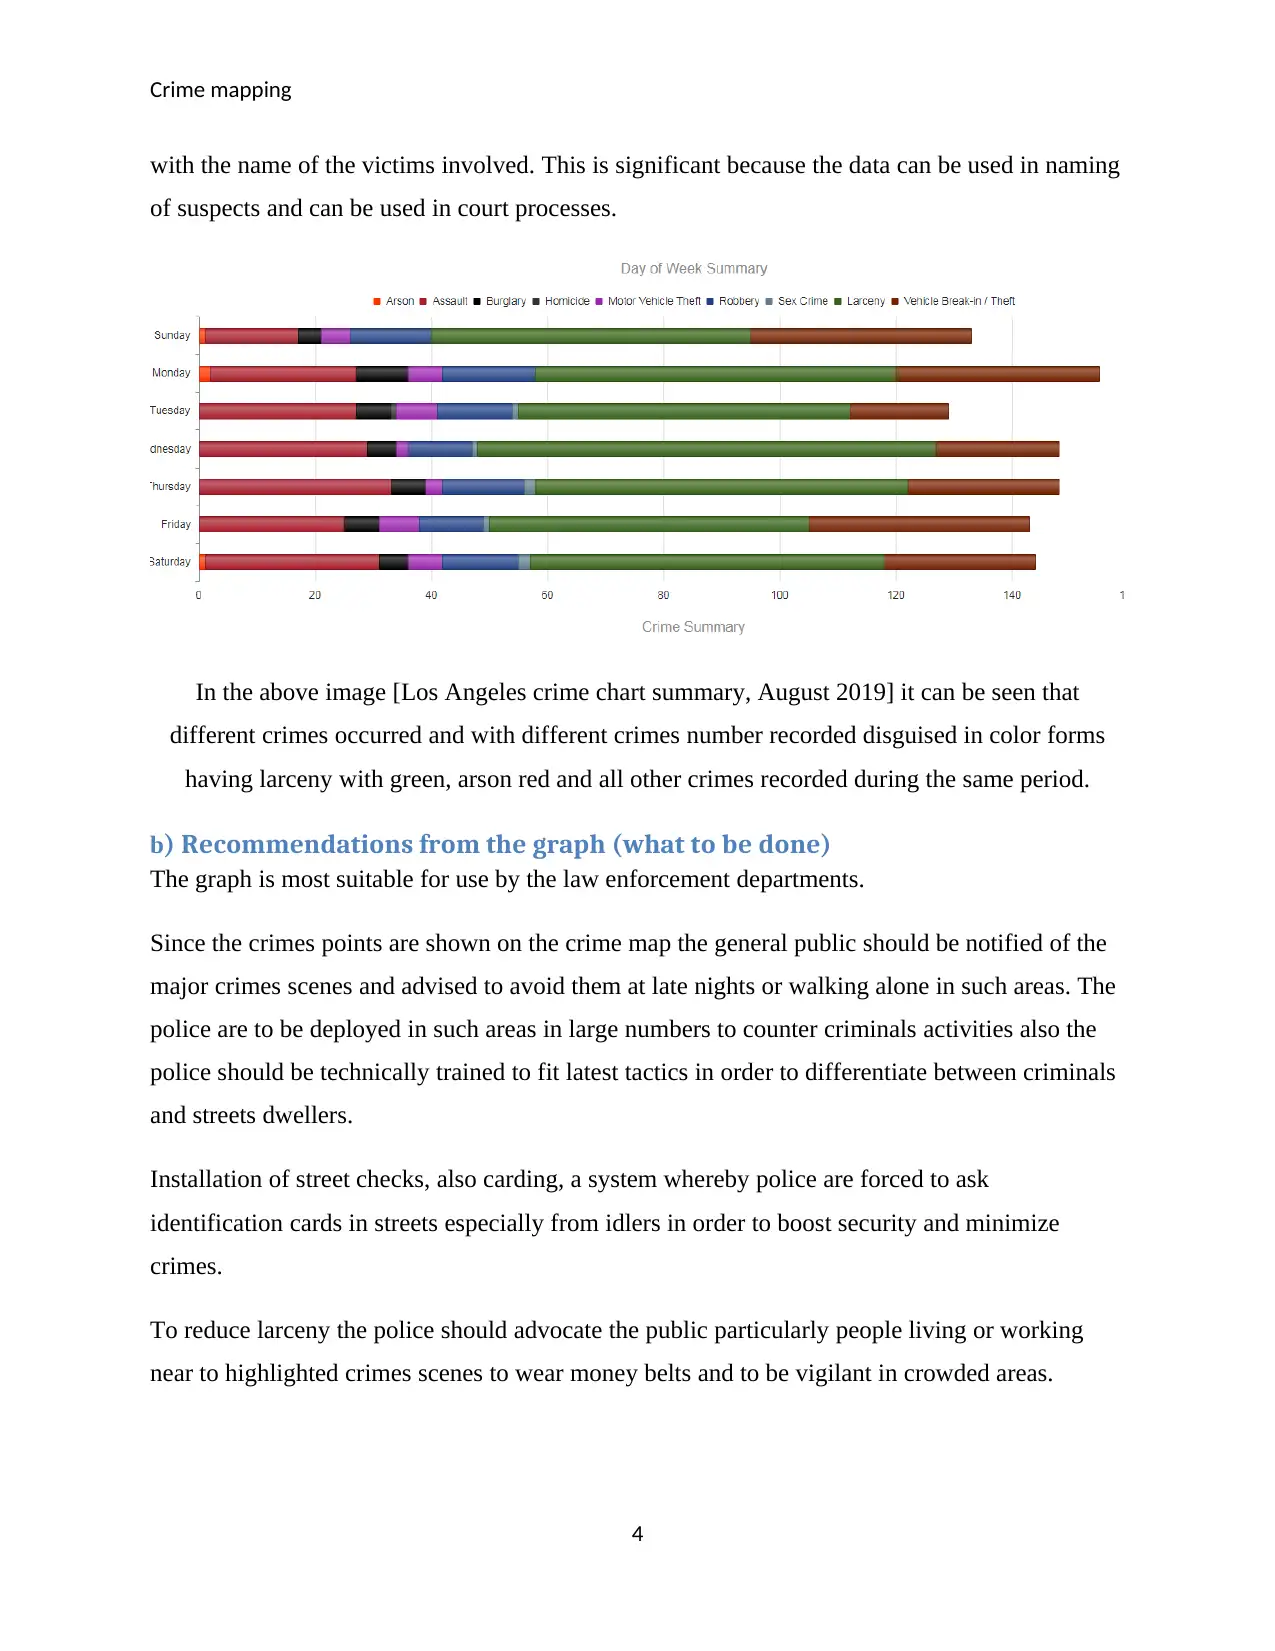
This assignment analyzes a crime map of Los Angeles, focusing on data from February to August 2019. The student examines crime data, including larceny and arson, identifying crime hotspots and insecure streets. The analysis includes recommendations for law enforcement, such as increased police presence, public awareness campaigns, and the installation of security measures. The assignment also explores the types of information required to complement the crime map, including crime details, suspect information, and the potential for misuse of geospatial data. The student emphasizes the importance of data-driven decision-making in criminal justice, highlighting the need for accurate, up-to-date information to inform police tactics and policy changes. The assignment concludes with a list of references and the images of the crime map.
Document Page
Crime mapping
Table of Contents
Introduction.............................................................................................................................................2
Data.........................................................................................................................................................2
A crime map screenshot......................................................................................................................3
What the data shows...............................................................................................................................3
b) Recommendations from the graph (what to be done)........................................................................4
Information required...............................................................................................................................5
Ways in which this crime data can be misused.......................................................................................5
List of reference...........................................................................................................................................6
1
tabler-icon-diamond-filled.svg

Paraphrase This Document

Need a fresh take? Get an instant paraphrase of this document with our AI Paraphraser
Document Page
Crime mapping
Introduction
Criminal justice is a process by which governmental departments for justice aims at serving
justice to criminals for crimes committed mostly by desired form of punishment such as paying
fines, corporal punishment or imprisonment. For effective and efficient service delivery by such
government department, law enforcement officers are usually trained to use different methods
when pursuing criminals such as using statistical methods to collect and record crimes data
which when analyzed will lead to a prediction of crimes. The most commonly used statistical
method is crime map when dealing with location of crimes.
Crime mapping is a technique used by law enforcement officers to map, visualize and analyze
crimes patterns in a particular location aimed at safeguarding the neighborhoods by highlighting
the crime hotspots and black spots and also predicting suspected individual or crime incidents to
be taken for further analysis and police probing. Crime mapping adoption by law enforcement
agencies began in the 90’s however; the system was first used and implemented two hundred
years ago in the early 19th century. The use of technology in crimes has led to the influx of profit
–motivated tech companies which provide crimes information to the general public about safety
of their neighborhoods and nearby blocks.
Data
The following data was published by the TriTech Software Systems (TriTech software system,
2019) on crime cases reported to the Los Angeles police on the period dated 4th February 2019 to
1st August 2019 on their crime map.
Larceny was the most reported crime for the six months period having an average of 55, 62,57,
79,64, 55,61 crimes recorded on Sunday, Monday, Tuesday, Wednesday, Thursday, Friday and
on Saturday respectively.
Arson was the least reported crime for six months having recorded on Sunday, Monday and
Saturday having 1,2,1 crimes recorded respectively.
The most insecure streets were 500 Block S Olive ST, 2nd ST and Main ST, 400 Block S Main
ST while areas nearing the New Otani Hotel, Gateway Transit Center and Central Library were
major crime hotspots.
2
Document Page
Crime mapping
A crime map screenshot.
What the data shows
From the map crime we are able to observe all the crimes that took place and were reported to
the Los Angeles police. The map is the most significant piece of the analysis since it shows the
location of the crime, as the law enforcement officer we are able to know the streets where most
of the crimes takes place, this enables quick and fast tracking of criminals, for instance in the
crime map the cases of larceny are reported in high numbers in areas such as 500 Block S Olive
ST, 2nd ST and Main ST, 400 Block S Main ST. For precautionary matters the general public will
be advised to be cautious when using the named streets and totally avoid them if walking alone
or at late nights. However the police and law enforcements agencies will be deployed in large
numbers in such areas in order to improve security and safety of citizens who are either residing,
doing business or just passing by.
The data collected contains detailed information about the crimes reported such as time, date
place of occurrence, type of the crime committed, the nature of the crime and the victims
involved with their properties. For instance all the larceny recorded in this crime map included
theft of not less than $500 but not more than $950 and their specific crime scene streets together
3
Document Page
Crime mapping
with the name of the victims involved. This is significant because the data can be used in naming
of suspects and can be used in court processes.
In the above image [Los Angeles crime chart summary, August 2019] it can be seen that
different crimes occurred and with different crimes number recorded disguised in color forms
having larceny with green, arson red and all other crimes recorded during the same period.
b) Recommendations from the graph (what to be done)
The graph is most suitable for use by the law enforcement departments.
Since the crimes points are shown on the crime map the general public should be notified of the
major crimes scenes and advised to avoid them at late nights or walking alone in such areas. The
police are to be deployed in such areas in large numbers to counter criminals activities also the
police should be technically trained to fit latest tactics in order to differentiate between criminals
and streets dwellers.
Installation of street checks, also carding, a system whereby police are forced to ask
identification cards in streets especially from idlers in order to boost security and minimize
crimes.
To reduce larceny the police should advocate the public particularly people living or working
near to highlighted crimes scenes to wear money belts and to be vigilant in crowded areas.
4
tabler-icon-diamond-filled.svg

Paraphrase This Document

Need a fresh take? Get an instant paraphrase of this document with our AI Paraphraser
Document Page
Crime mapping
The police should install more security items such CCTV’S and other face recognition devices in
crimes hotspots to monitor criminals and raise an alarm should suspected criminals be seen at the
secluded areas.
Information required
Apart from collecting geographical information about crimes, the law enforcement unit should
also collect information pertaining the crimes nature, time and date, details of the crime, number
of criminals suspected to have been involved in the planning and execution of the criminal
operation and what the criminals took or asked during the crime. All these information about
crimes and suspected criminals are necessary in order for the law enforcement unit to develop a
predictive model to curb crimes, arrest and trail of suspects and to fully exercise police operation
and justice on criminals.
Ways in which this crime data can be misused
a) With the use of geospatial data, tech-elite and cyber criminals are enabled to access
crimes data and tactically predict the measure the police force and law enforcement units
will take, thus successfully evading the police.
b) In cases of unreported offences in some areas, the police force might be forced to think
that zero crimes or lesser crimes are happening at the particular place thus not preparing
adequately to curb the criminals and also making poor crime management policies.
c) The crime data analyzed are collected usually from a prior selected time period for
instance say prior six months, a year, etc., the use of such crime data in decision making
and management policy creation does not often lead to reduced crimes because the
data used are old and the crimes and criminal patterns usually changes rapidly over time.
d) The release of crimes data to public often leads to suspicion and people residing in areas
reported to be having higher number of crimes are often suspected to be criminals and
usually stigmatized.
5
Document Page
Crime mapping
List of reference
TriTech software system, 2019 August 2, Los Angeles crimes map. Retrieved August, 2, 2019
from https://www.crimemapping.com/Share/0b8581072f214749935af5fc978c6acf
Los Angeles crime chart summary, [Image] 2019 August 2.Retrieved August, 2, 2019, from
https://www.crimemapping.com/map/ca/losangeles#
6
chevron_up_icon
1 out of 6
circle_padding
hide_on_mobile
zoom_out_icon
[object Object]