logo

Curve-fitting Project - Linear Model

6 Pages585 Words18 Views
   

Added on  2022-08-12

About This Document

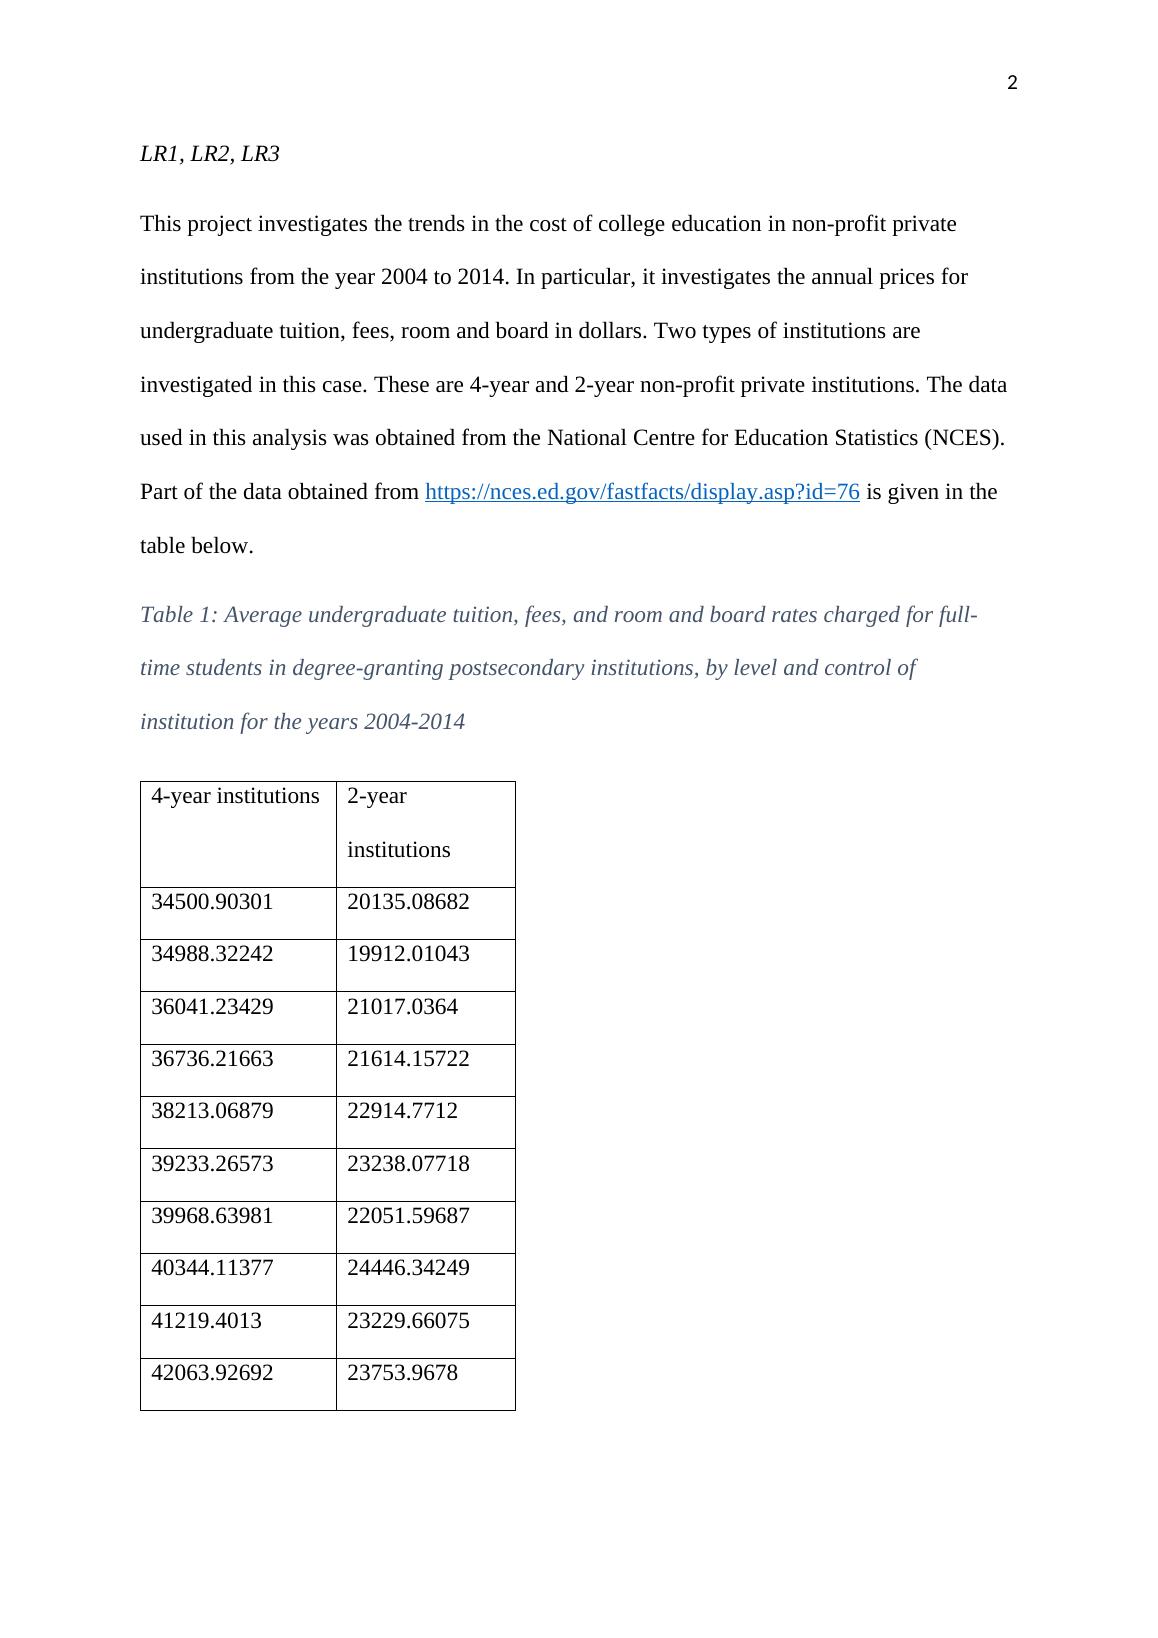
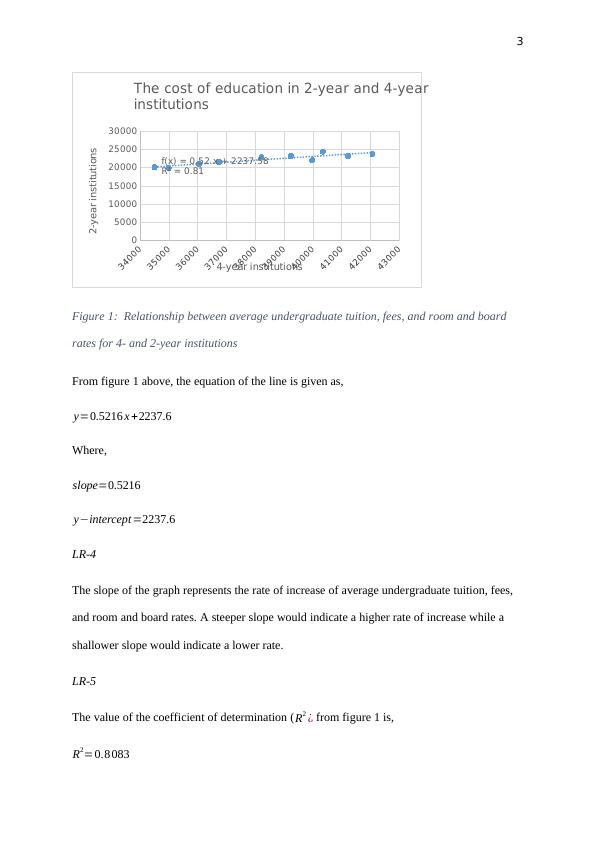
Curve-fitting Project - Linear Model (due at the end of Week 5) Instructions For this assignment, collect data exhibiting a relatively linear trend, find the line of best fit, plot the data and the line, interpret the slope, and use the linear equation to make a prediction. Also, find r2 (coefficient of determination) and r (correlation coefficient). Discuss your findings. Your topic may be that is related to sports, your work, a hobby, or something you find interesting. If you choose, you may use the suggestions described below. A Linear Model Example and Technology Tips are provided in separate documents. Tasks for Linear Regression Model (LR) (LR-1) Describe your topic, provide your data, and cite your source. Collect at least 8 data points. Label appropriately. 

Curve-fitting Project - Linear Model

   Added on 2022-08-12

ShareRelated Documents
1
Curve-fitting Project - Linear Model
Student’s Name
Institutional Affiliation
Date
Curve-fitting Project - Linear Model_1
2
LR1, LR2, LR3
This project investigates the trends in the cost of college education in non-profit private
institutions from the year 2004 to 2014. In particular, it investigates the annual prices for
undergraduate tuition, fees, room and board in dollars. Two types of institutions are
investigated in this case. These are 4-year and 2-year non-profit private institutions. The data
used in this analysis was obtained from the National Centre for Education Statistics (NCES).
Part of the data obtained from https://nces.ed.gov/fastfacts/display.asp?id=76 is given in the
table below.
Table 1: Average undergraduate tuition, fees, and room and board rates charged for full-
time students in degree-granting postsecondary institutions, by level and control of institution
for the years 2004-2014
4-year institutions 2-year
institutions
34500.90301 20135.08682
34988.32242 19912.01043
36041.23429 21017.0364
36736.21663 21614.15722
38213.06879 22914.7712
39233.26573 23238.07718
39968.63981 22051.59687
40344.11377 24446.34249
41219.4013 23229.66075
42063.92692 23753.9678
Curve-fitting Project - Linear Model_2
3
0
5000
10000
15000
20000
25000
30000
f(x) = 0.52 x + 2237.58
R² = 0.81
The cost of education in 2-year and 4-year
institutions
4-year institutions
2-year institutions
Figure 1: Relationship between average undergraduate tuition, fees, and room and board
rates for 4- and 2-year institutions
From figure 1 above, the equation of the line is given as,
y=0.5216 x +2237.6
Where,
slope=0.5216
yintercept =2237.6
LR-4
The slope of the graph represents the rate of increase of average undergraduate tuition, fees,
and room and board rates. A steeper slope would indicate a higher rate of increase while a
shallower slope would indicate a lower rate.
LR-5
The value of the coefficient of determination ( R2 ¿ from figure 1 is,
R2=0.8 083
Curve-fitting Project - Linear Model_3

End of preview

Want to access all the pages? Upload your documents or become a member.

Related Documents
The Linear Model Student Name
|7
|689
|11

Linear Regression Model for Predicting Housing Prices in the United States
|11
|1068
|434

I will use the national center for education statistics website
|4
|195
|105

Statistics: Analysis of Australian Exports, Umbrella Sales and Time Series
|9
|519
|438

Relationship between Retention Rate and Graduation Rate in Online Colleges in the US
|9
|1914
|248

Data Analysis: Private Capital Expenditure and Average Yield vs Rainfall
|6
|663
|329