Ask a question from expert
Customer Attribute and Profit Report Analysis for Nike
29 Pages3050 Words109 Views
Added on 2021-05-27
Customer Attribute and Profit Report Analysis for Nike
Added on 2021-05-27
BookmarkShareRelated Documents
1Customer Attribute and Profit ReportAnalysis for NikeStudent Name:Student ID:Unit Name:Unit ID:Date Due:Professor Name:Word Limit:
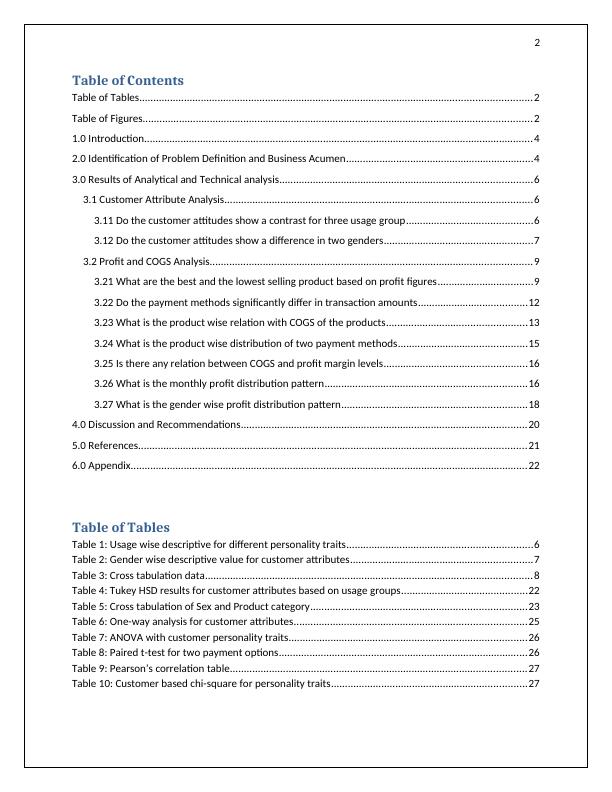
2Table of ContentsTable of Tables............................................................................................................................................2Table of Figures...........................................................................................................................................21.0 Introduction...........................................................................................................................................42.0 Identification of Problem Definition and Business Acumen...................................................................43.0 Results of Analytical and Technical analysis..........................................................................................63.1 Customer Attribute Analysis..............................................................................................................63.11 Do the customer attitudes show a contrast for three usage group.............................................63.12 Do the customer attitudes show a difference in two genders.....................................................73.2 Profit and COGS Analysis...................................................................................................................93.21 What are the best and the lowest selling product based on profit figures..................................93.22 Do the payment methods significantly differ in transaction amounts.......................................123.23 What is the product wise relation with COGS of the products..................................................133.24 What is the product wise distribution of two payment methods..............................................153.25 Is there any relation between COGS and profit margin levels...................................................163.26 What is the monthly profit distribution pattern........................................................................163.27 What is the gender wise profit distribution pattern..................................................................184.0 Discussion and Recommendations......................................................................................................205.0 References...........................................................................................................................................216.0 Appendix..............................................................................................................................................22Table of TablesTable 1: Usage wise descriptive for different personality traits..................................................................6Table 2: Gender wise descriptive value for customer attributes.................................................................7Table 3: Cross tabulation data.....................................................................................................................8Table 4: Tukey HSD results for customer attributes based on usage groups.............................................22Table 5: Cross tabulation of Sex and Product category.............................................................................23Table 6: One-way analysis for customer attributes...................................................................................25Table 7: ANOVA with customer personality traits.....................................................................................26Table 8: Paired t-test for two payment options.........................................................................................26Table 9: Pearson’s correlation table..........................................................................................................27Table 10: Customer based chi-square for personality traits......................................................................27
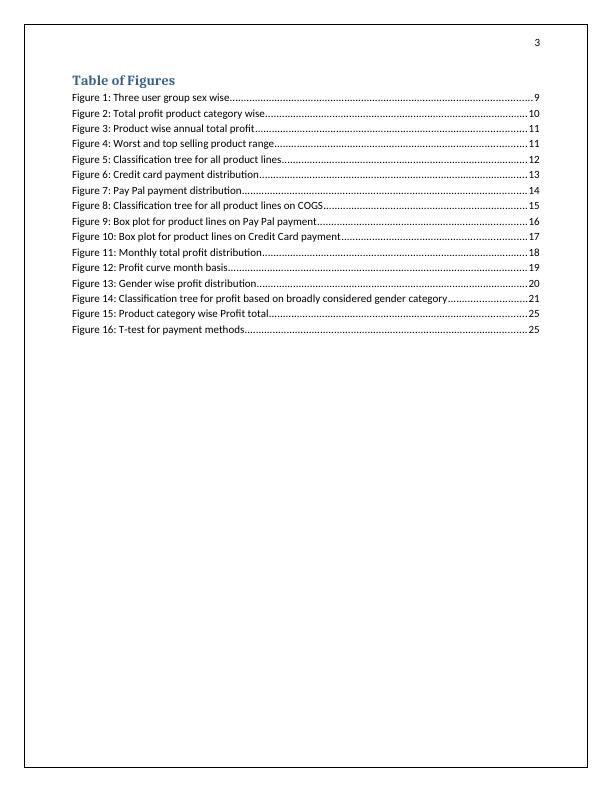
3Table of FiguresFigure 1: Three user group sex wise............................................................................................................9Figure 2: Total profit product category wise..............................................................................................10Figure 3: Product wise annual total profit.................................................................................................11Figure 4: Worst and top selling product range..........................................................................................11Figure 5: Classification tree for all product lines........................................................................................12Figure 6: Credit card payment distribution................................................................................................13Figure 7: Pay Pal payment distribution......................................................................................................14Figure 8: Classification tree for all product lines on COGS.........................................................................15Figure 9: Box plot for product lines on Pay Pal payment...........................................................................16Figure 10: Box plot for product lines on Credit Card payment..................................................................17Figure 11: Monthly total profit distribution...............................................................................................18Figure 12: Profit curve month basis...........................................................................................................19Figure 13: Gender wise profit distribution.................................................................................................20Figure 14: Classification tree for profit based on broadly considered gender category............................21Figure 15: Product category wise Profit total............................................................................................25Figure 16: T-test for payment methods.....................................................................................................25
41.0 Introduction ‘Nike’ is a worldwide brand name for sports clothing and it believes in the saying by BillBowerman, that, “if you have a body, you are an athlete”. The company adheres by their missionof providing innovative sportswear to all athletes around the world. The motto of sustainabilityand high quality modernization has created an unbelievable brand value for the customers.Dedicated research team, ecologists have built a model which is guiding Nike to an exponentialgrowth in product ranges along with profit margins. The pro-environmental approach has added tothe brand name and encouraged continuous growth at every corner of the globe. Variety inproduct line, all weather sports accessories has attracted customers from all the age group. Theinvestors and stakeholders are interested in new investment in the company. The coremanagement of the company has undertaken a pilot project to study recent trends in customersatisfaction and profit analysis. The pilot study was conducted in two phases, first for customeranalysis and then for company profit analysis based on selected product ranges (Fornell, Rust &Dekimpe, 2010).2.0 Identification of Problem Definition and Business Acumen The first phase of the work involved customer study based on feedback data of the customers.Satisfaction level, awareness about various product lines, product preference, purchase intent andreliability of the customers were recorded. Customers were divided into three categories based ontheir selection of product ranges. The gender study was also done for the heavy, medium and lightusage category of customers. Focus was assigned to two conclusive queries related to thecollected data. The analysis oriented questions were as follows,
5Do the customer attitudes show a contrast for three usage group?Do the customer attitudes show a difference for two genders?The usage group and gender category were two ordinal variables. Comparison of five customerpersonality traits, which were ordinal in nature, was done for gender and usage group. Theappropriate choice of descriptive method for comparison was considered as Cross- Tabulation.The inferential conclusion was drawn from Chi-square test.The second phase was a profit study, which involved sales figure of one year with nine differentproduct lines. Margin of cost of products (COGS) and total profit, along with payment modeswere studied. As the bottom line of every industry is profit, the management decided to focus onthe profit figures, associated with product categories. For decisive conclusion, seven researchquestions were structured as below,What are the best and the lowest selling product based on profit figures?Do the payment methods significantly differ in transaction amounts?What is the product wise relation with COGS of the products?What is the product wise distribution of two payment methods?Is there any relation between COGS and profit margin levels?What is the monthly profit distribution pattern?What is the gender wise profit distribution pattern?The descriptive measures for each research question was found based on nature of the data, andappropriate inferential statistical measure was taken to establish the claims of descriptive values.The chi-square test, t-test, analysis of variance, one way analysis, Pearson’s correlation were usedfor the purpose of the study (Bergman, B. & Klefsjö, 2010).
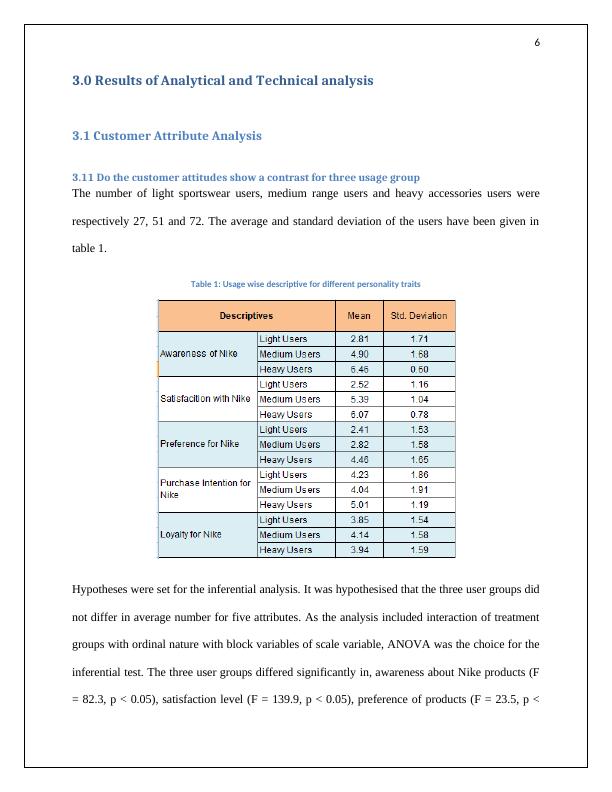
63.0 Results of Analytical and Technical analysis3.1 Customer Attribute Analysis3.11 Do the customer attitudes show a contrast for three usage groupThe number of light sportswear users, medium range users and heavy accessories users wererespectively 27, 51 and 72. The average and standard deviation of the users have been given intable 1. Table 1: Usage wise descriptive for different personality traitsHypotheses were set for the inferential analysis. It was hypothesised that the three user groups didnot differ in average number for five attributes. As the analysis included interaction of treatmentgroups with ordinal nature with block variables of scale variable, ANOVA was the choice for theinferential test. The three user groups differed significantly in, awareness about Nike products (F= 82.3, p < 0.05), satisfaction level (F = 139.9, p < 0.05), preference of products (F = 23.5, p <
End of preview
Want to access all the pages? Upload your documents or become a member.
Related Documents
Profit Analysis with Customer Attribute Studylg...
|31
|4227
|37
Profit Analysis with Customer Satisfaction for Nikelg...
|29
|4014
|250
Profit Analysis of Retail Business – The Brick and Mortar Case Scenariolg...
|19
|3230
|302
Athlete Panda: Business Research Reportlg...
|21
|2679
|133