Comprehensive Customer Service Analysis and Recommendation Report

Verified

Added on  2023/04/05

|14
|786
|489
Report
AI Summary
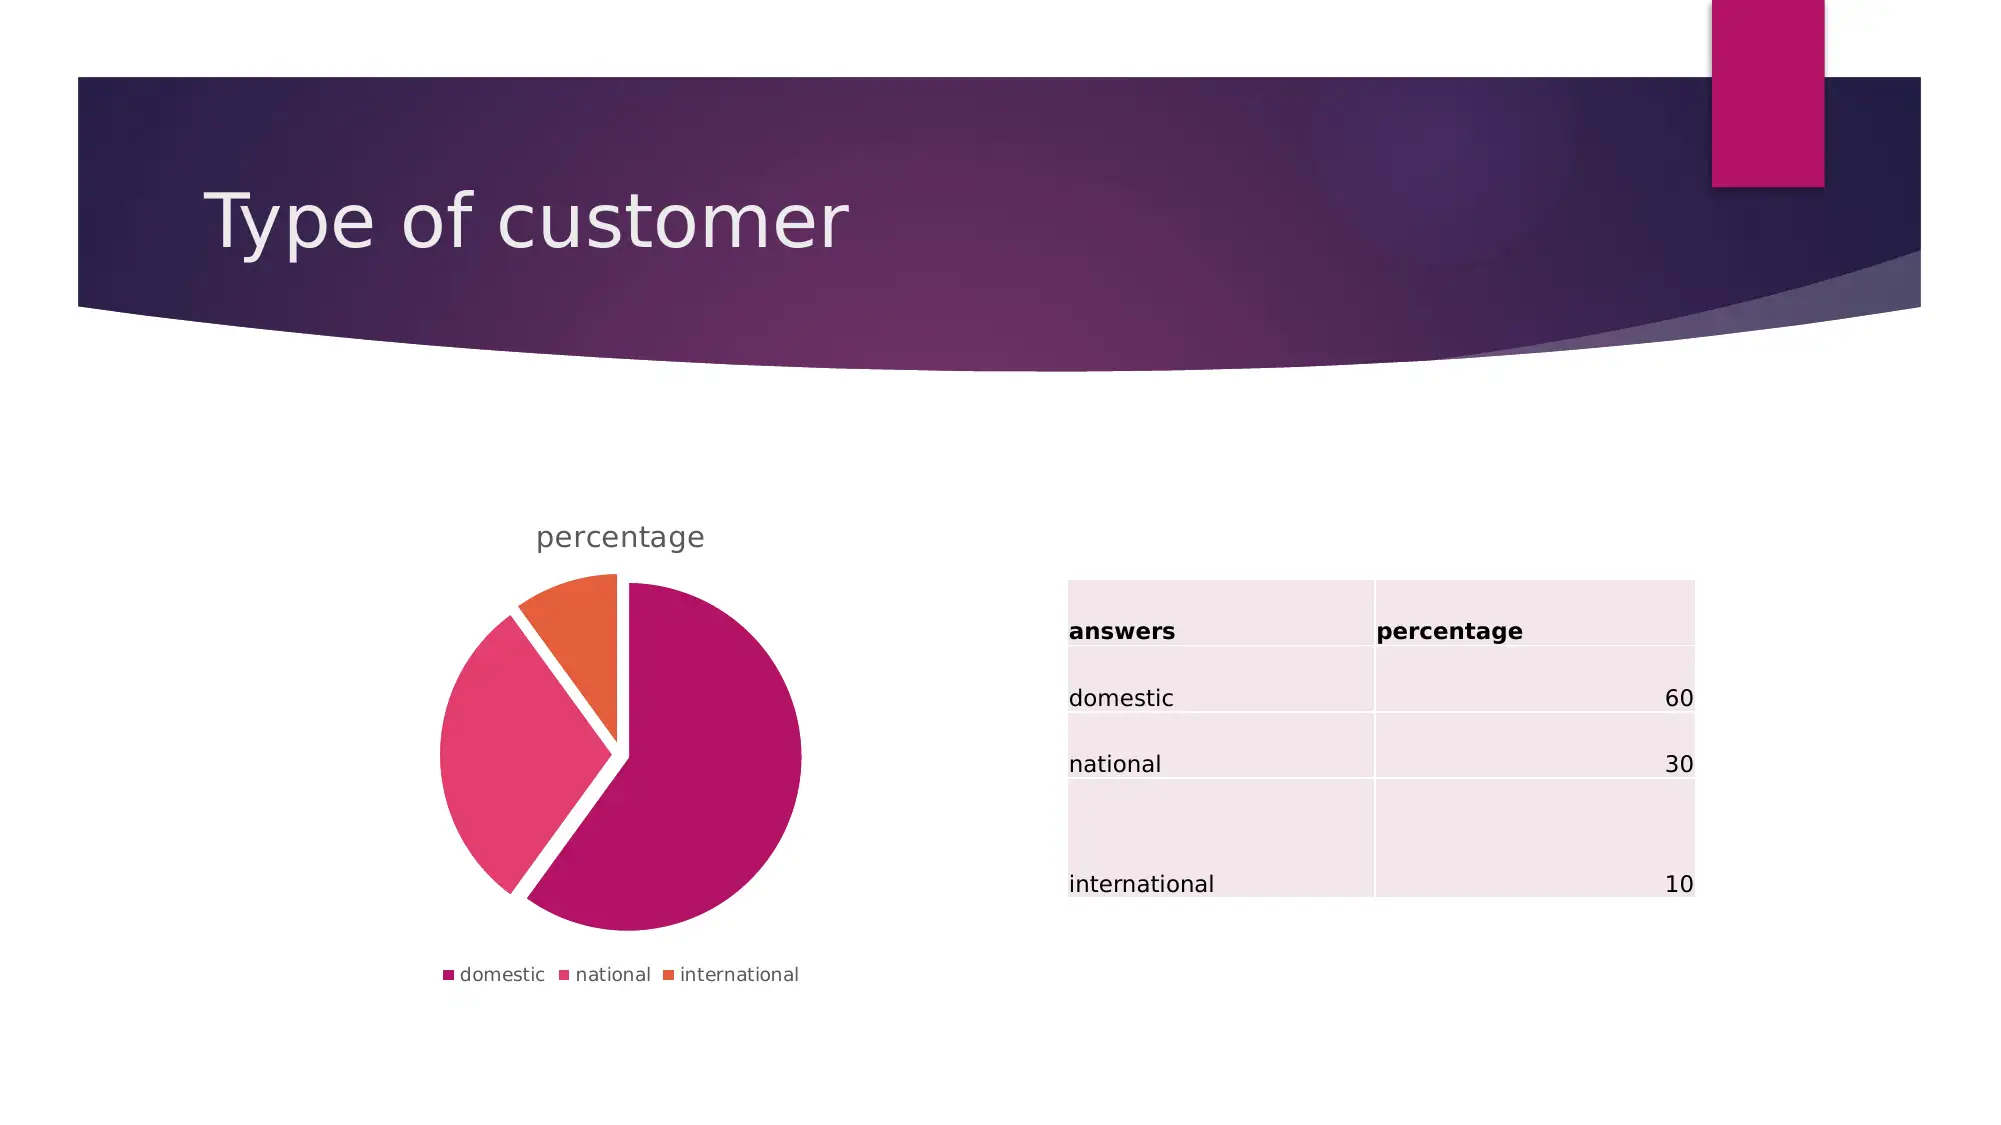
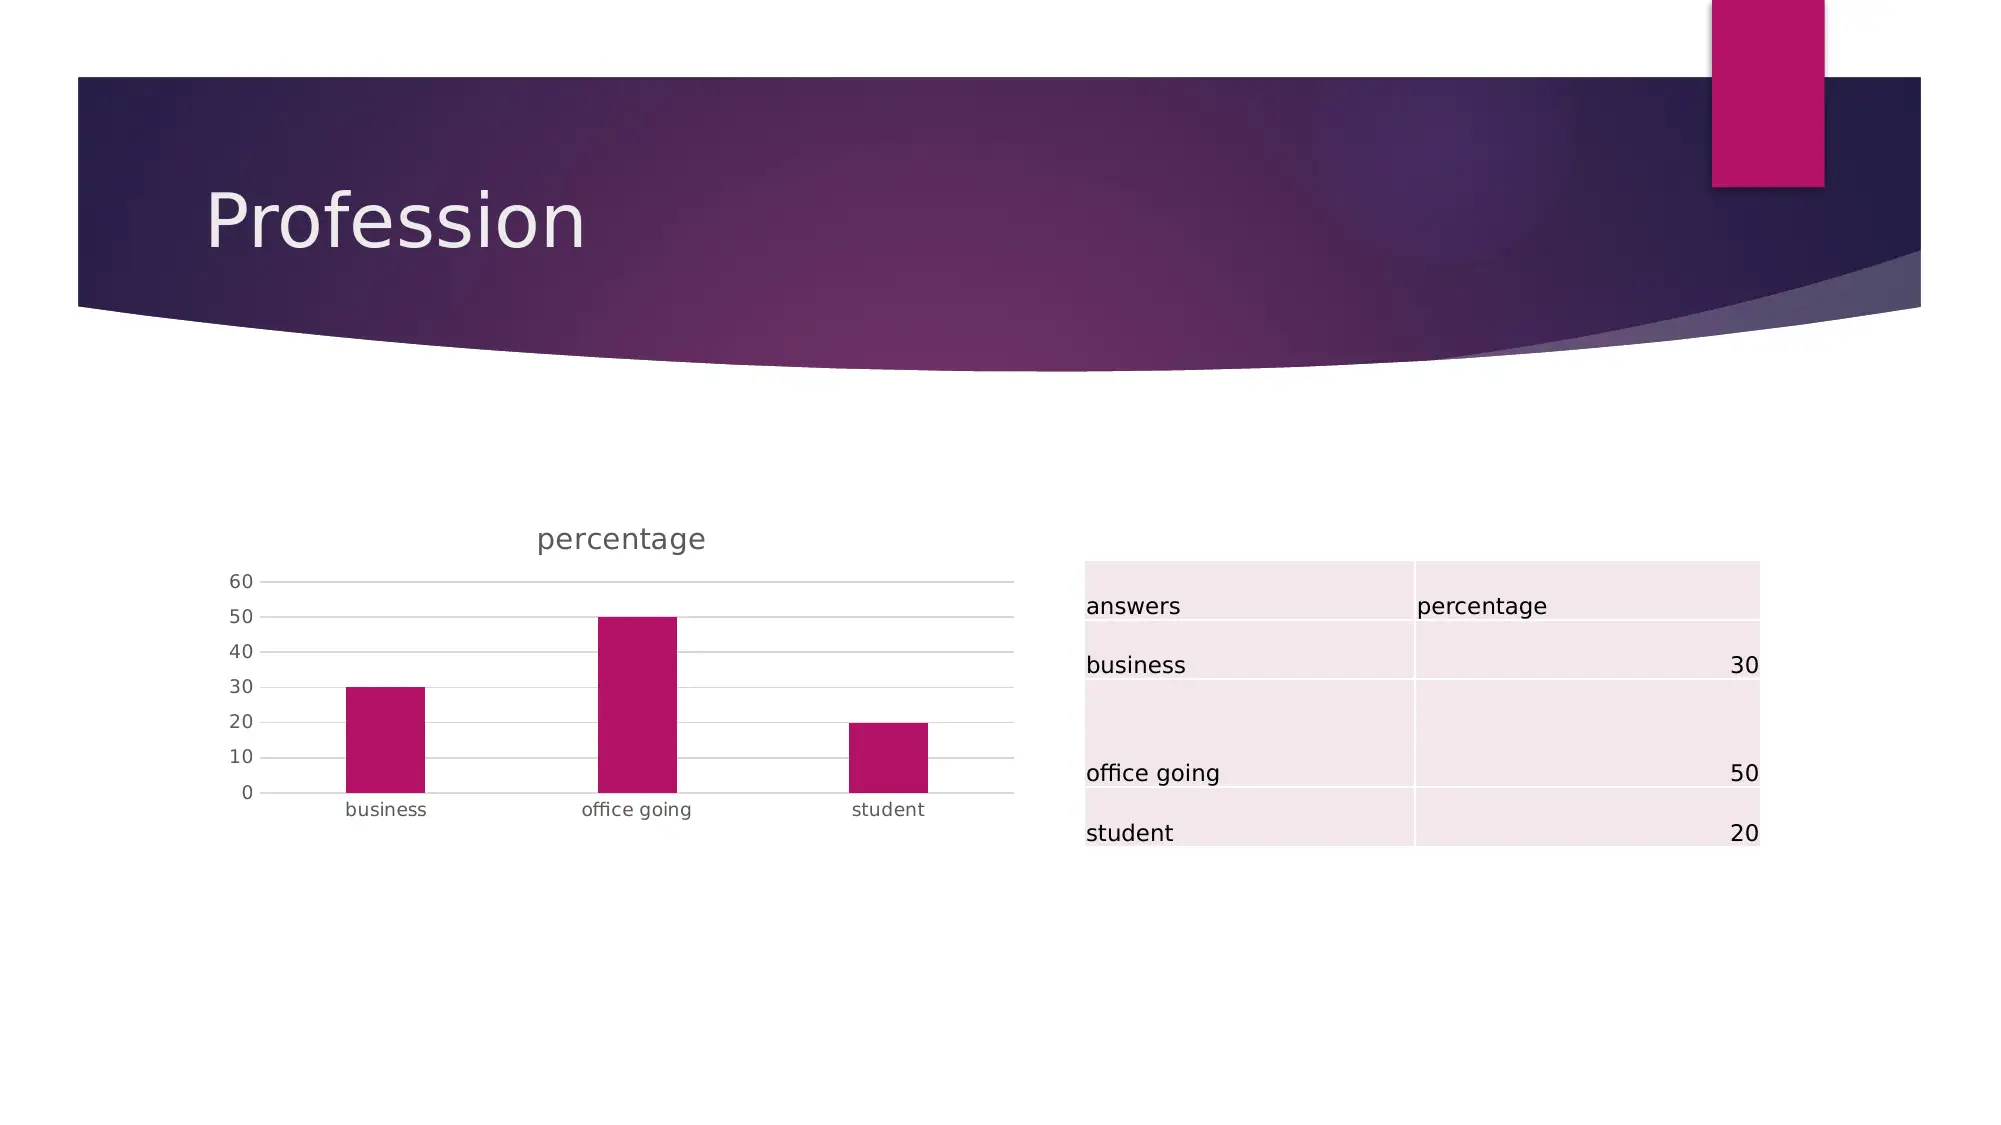
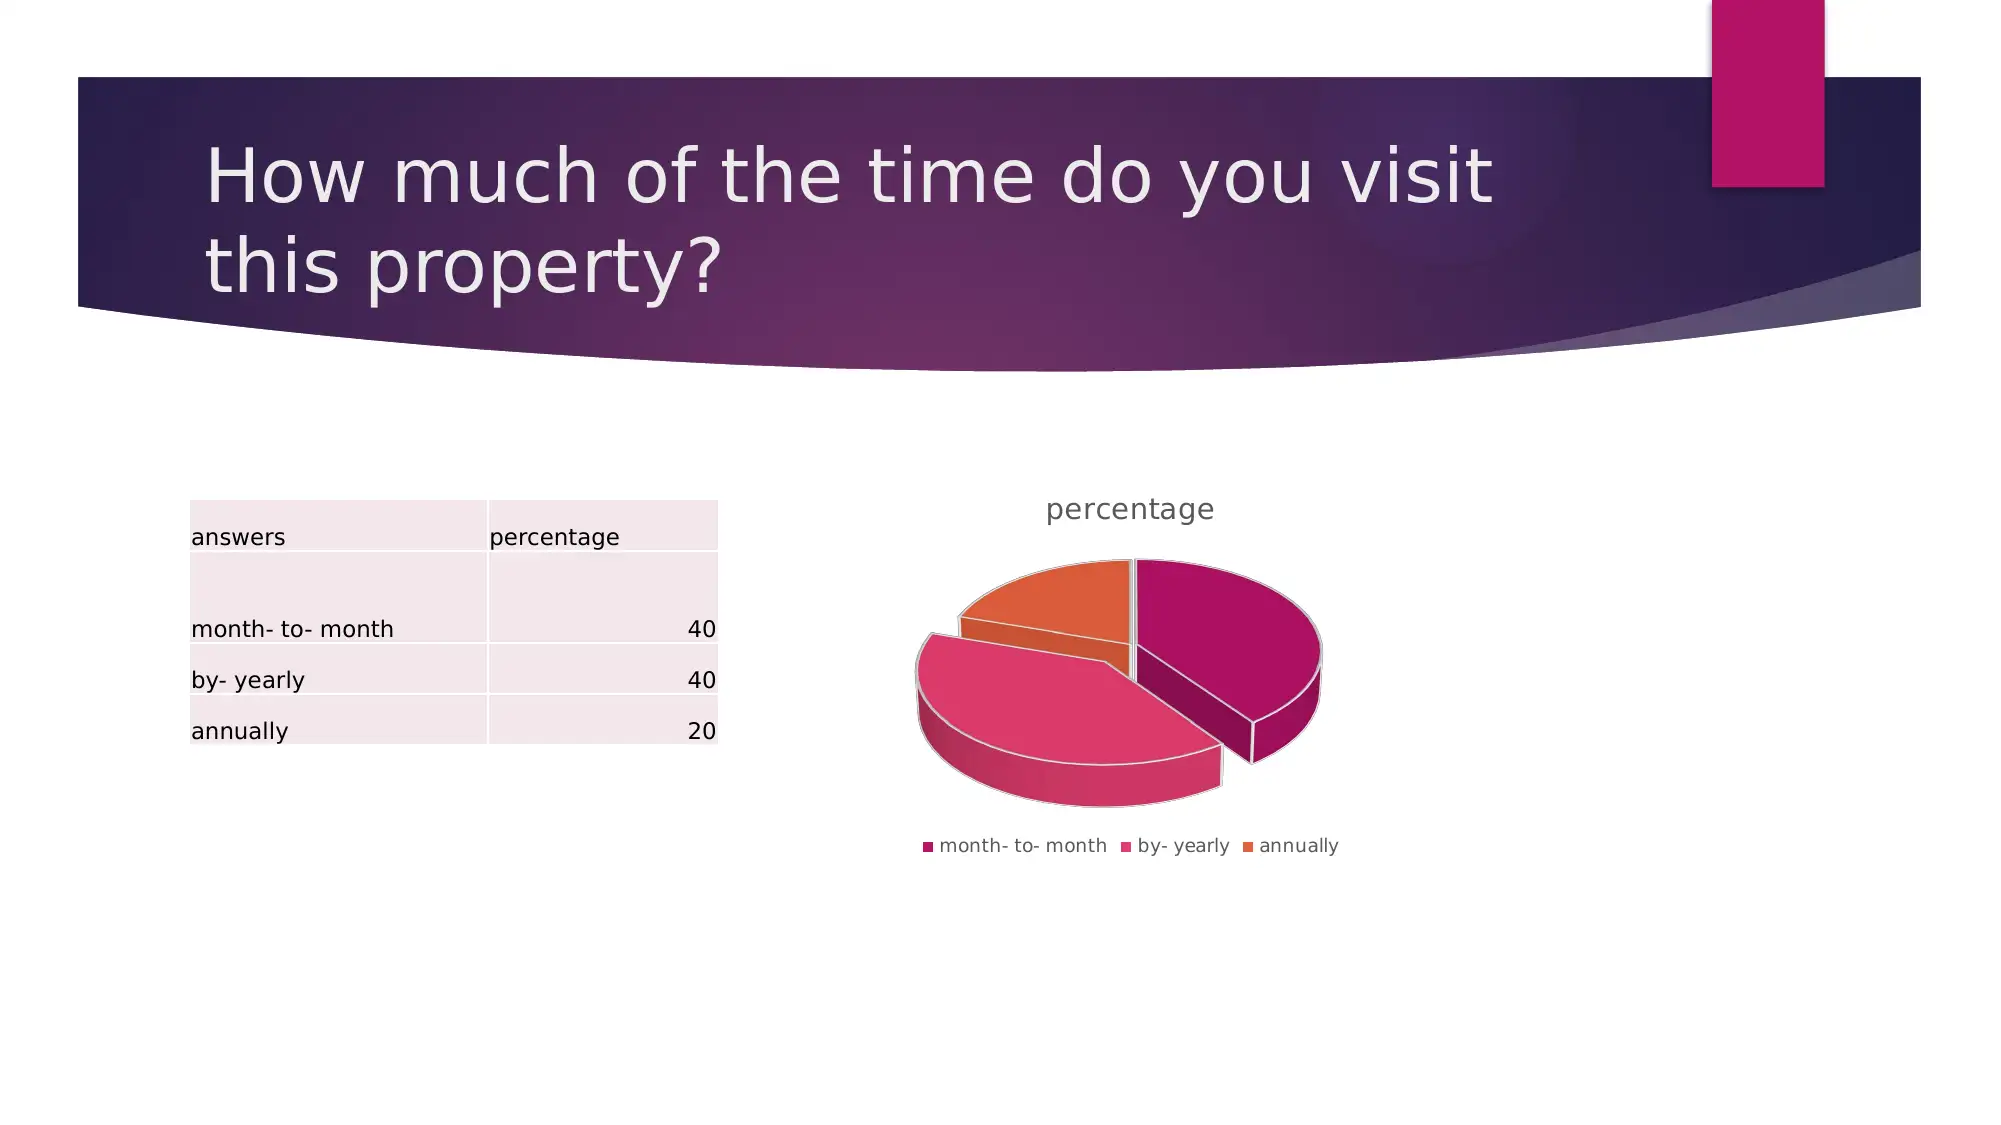
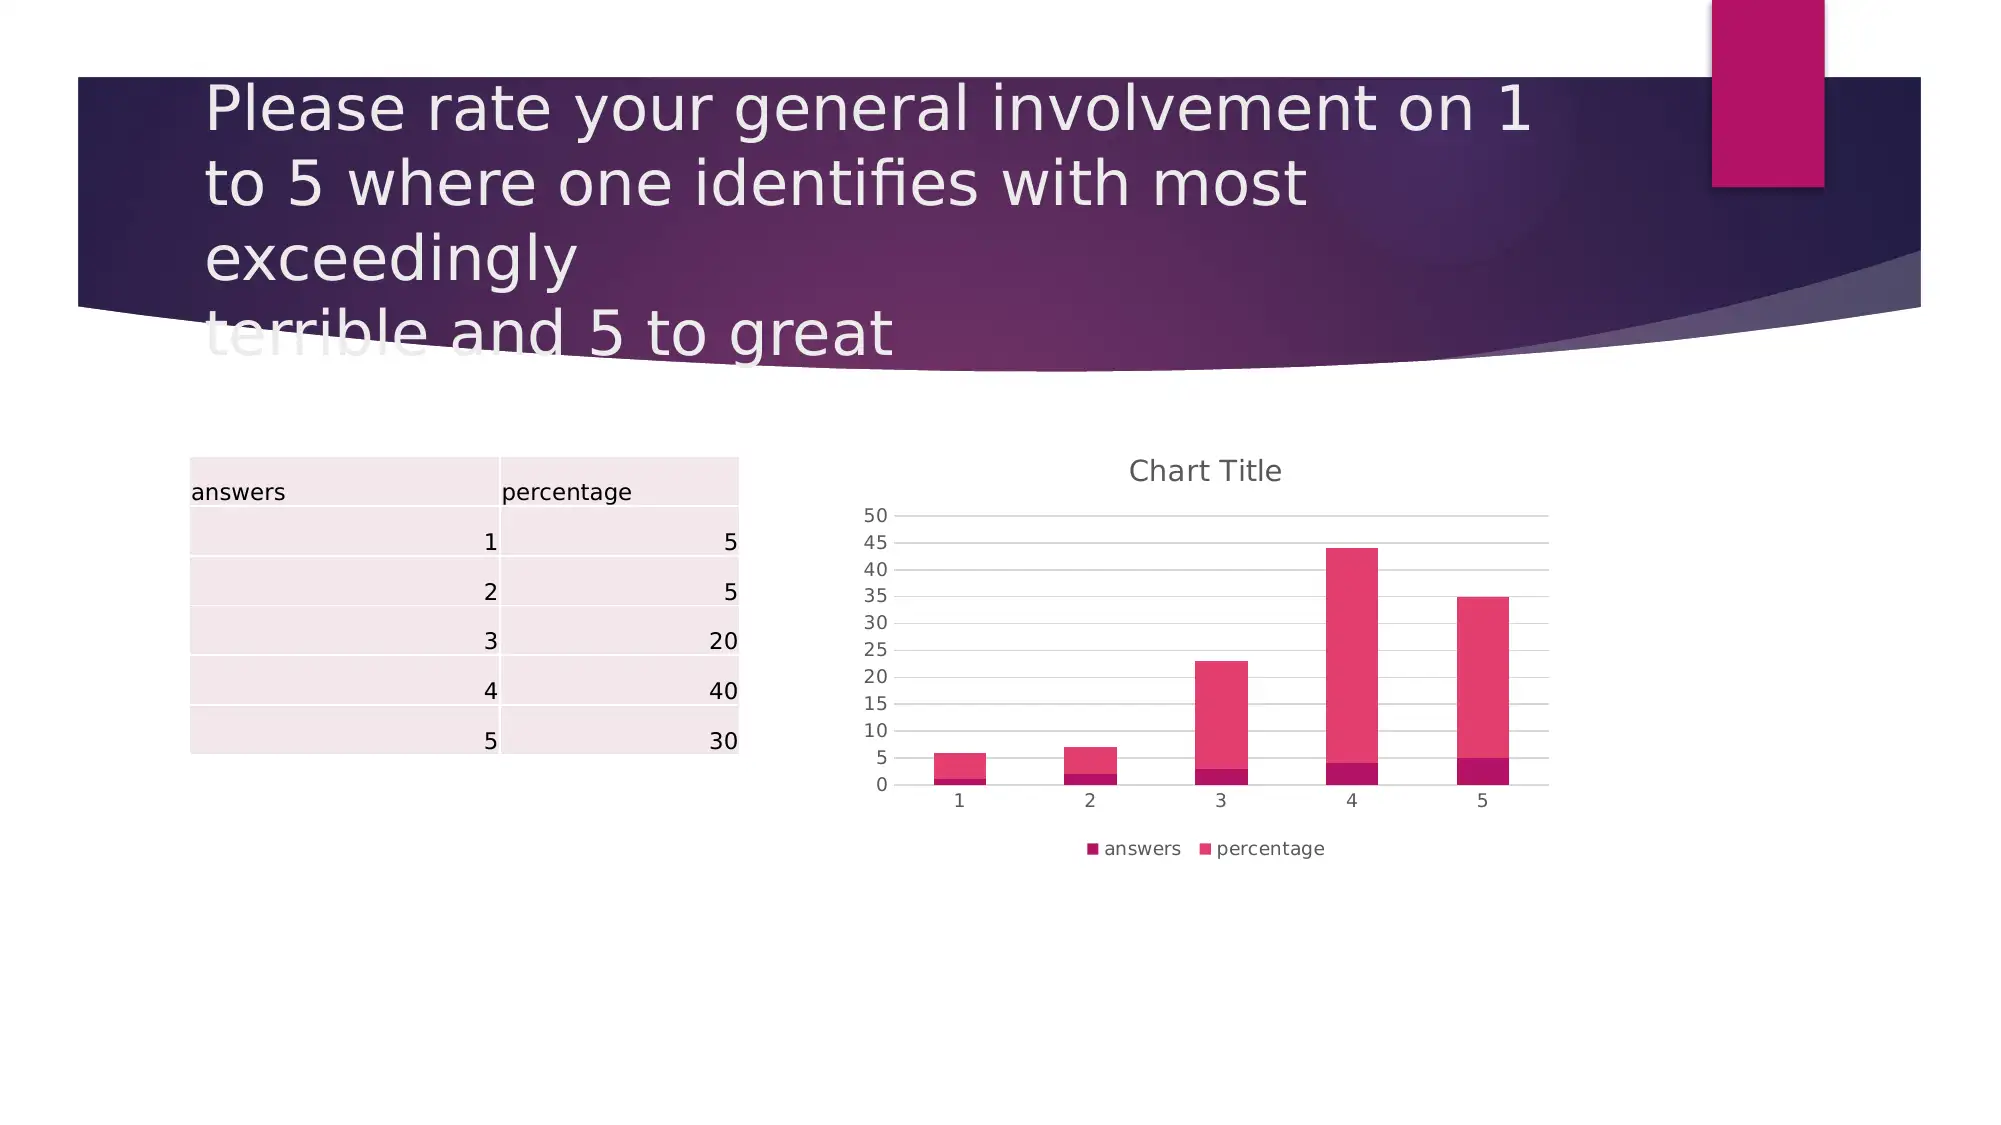
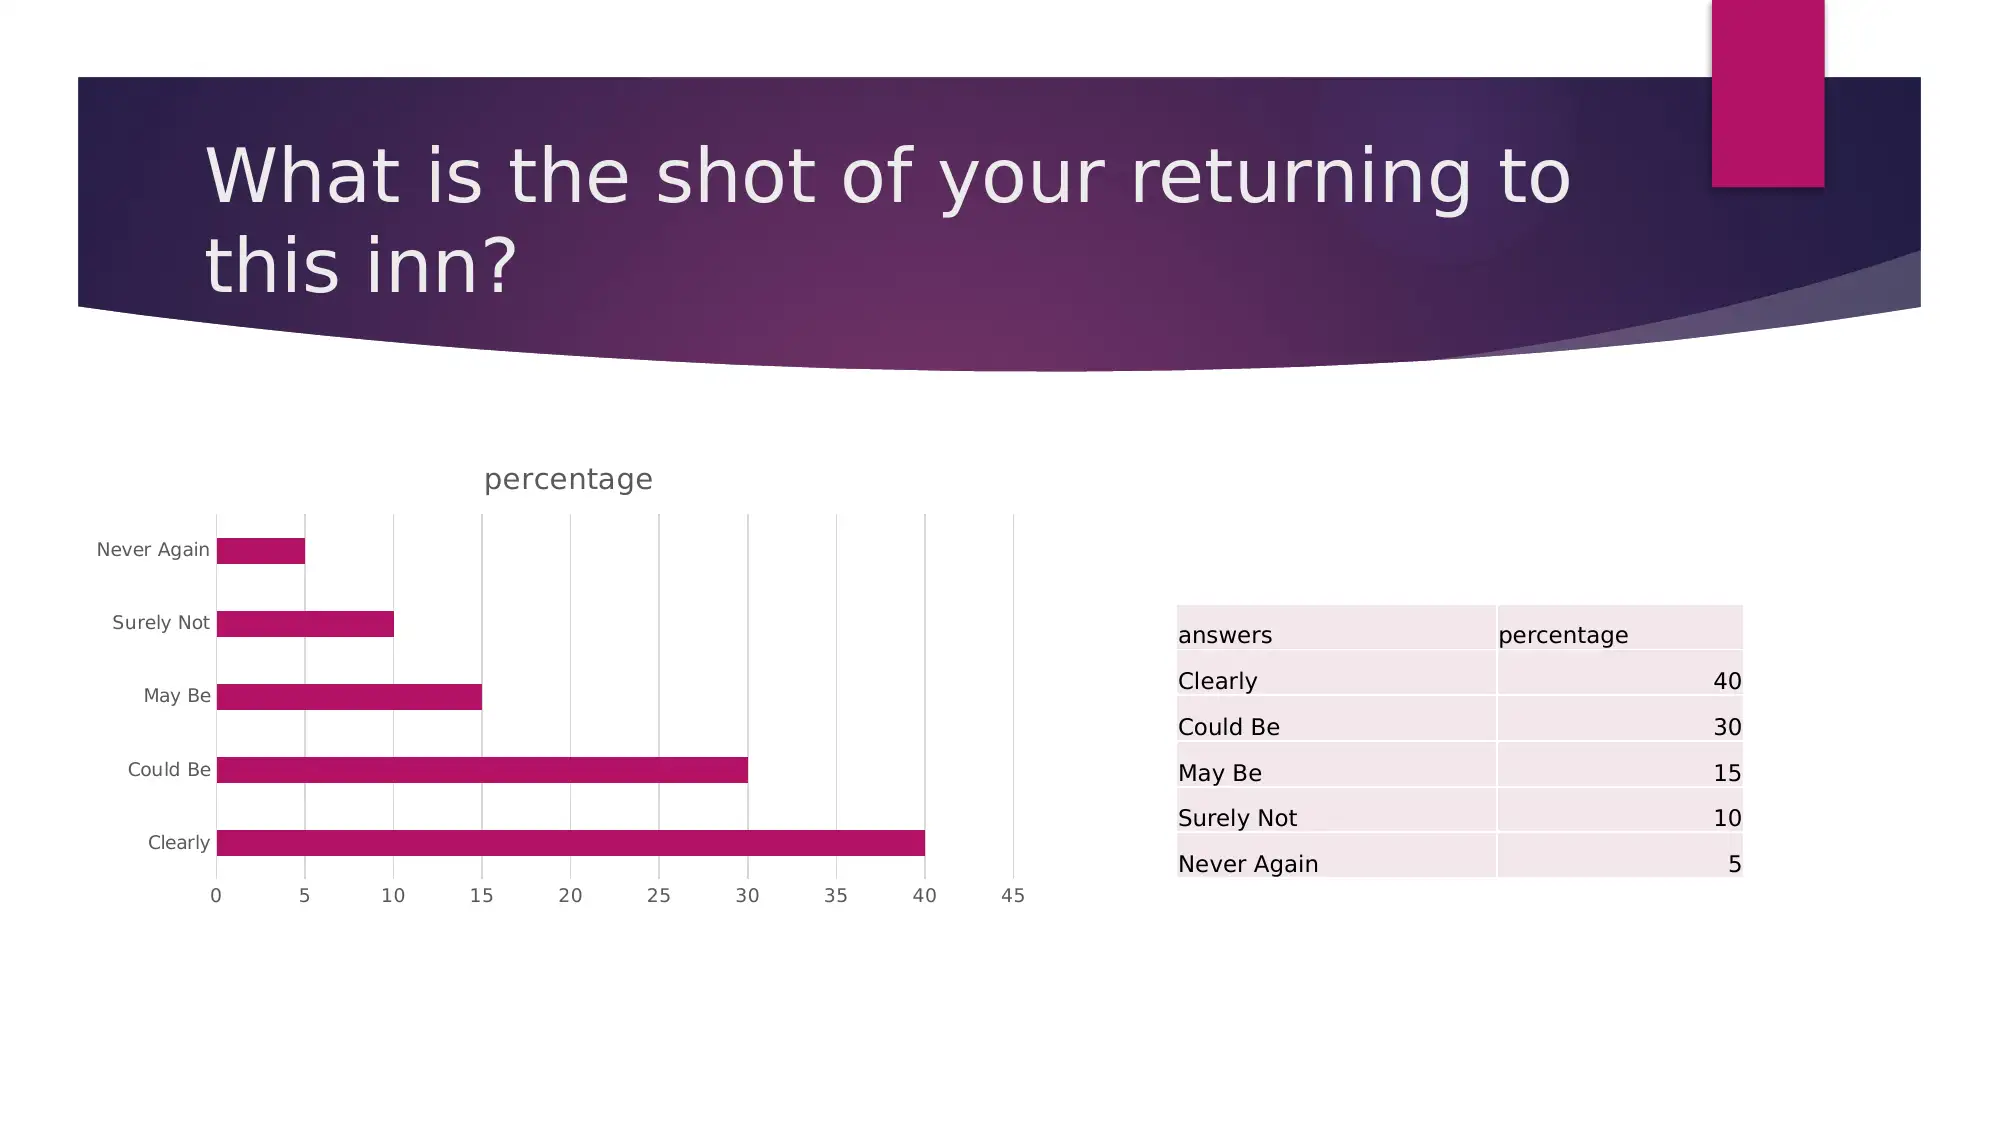
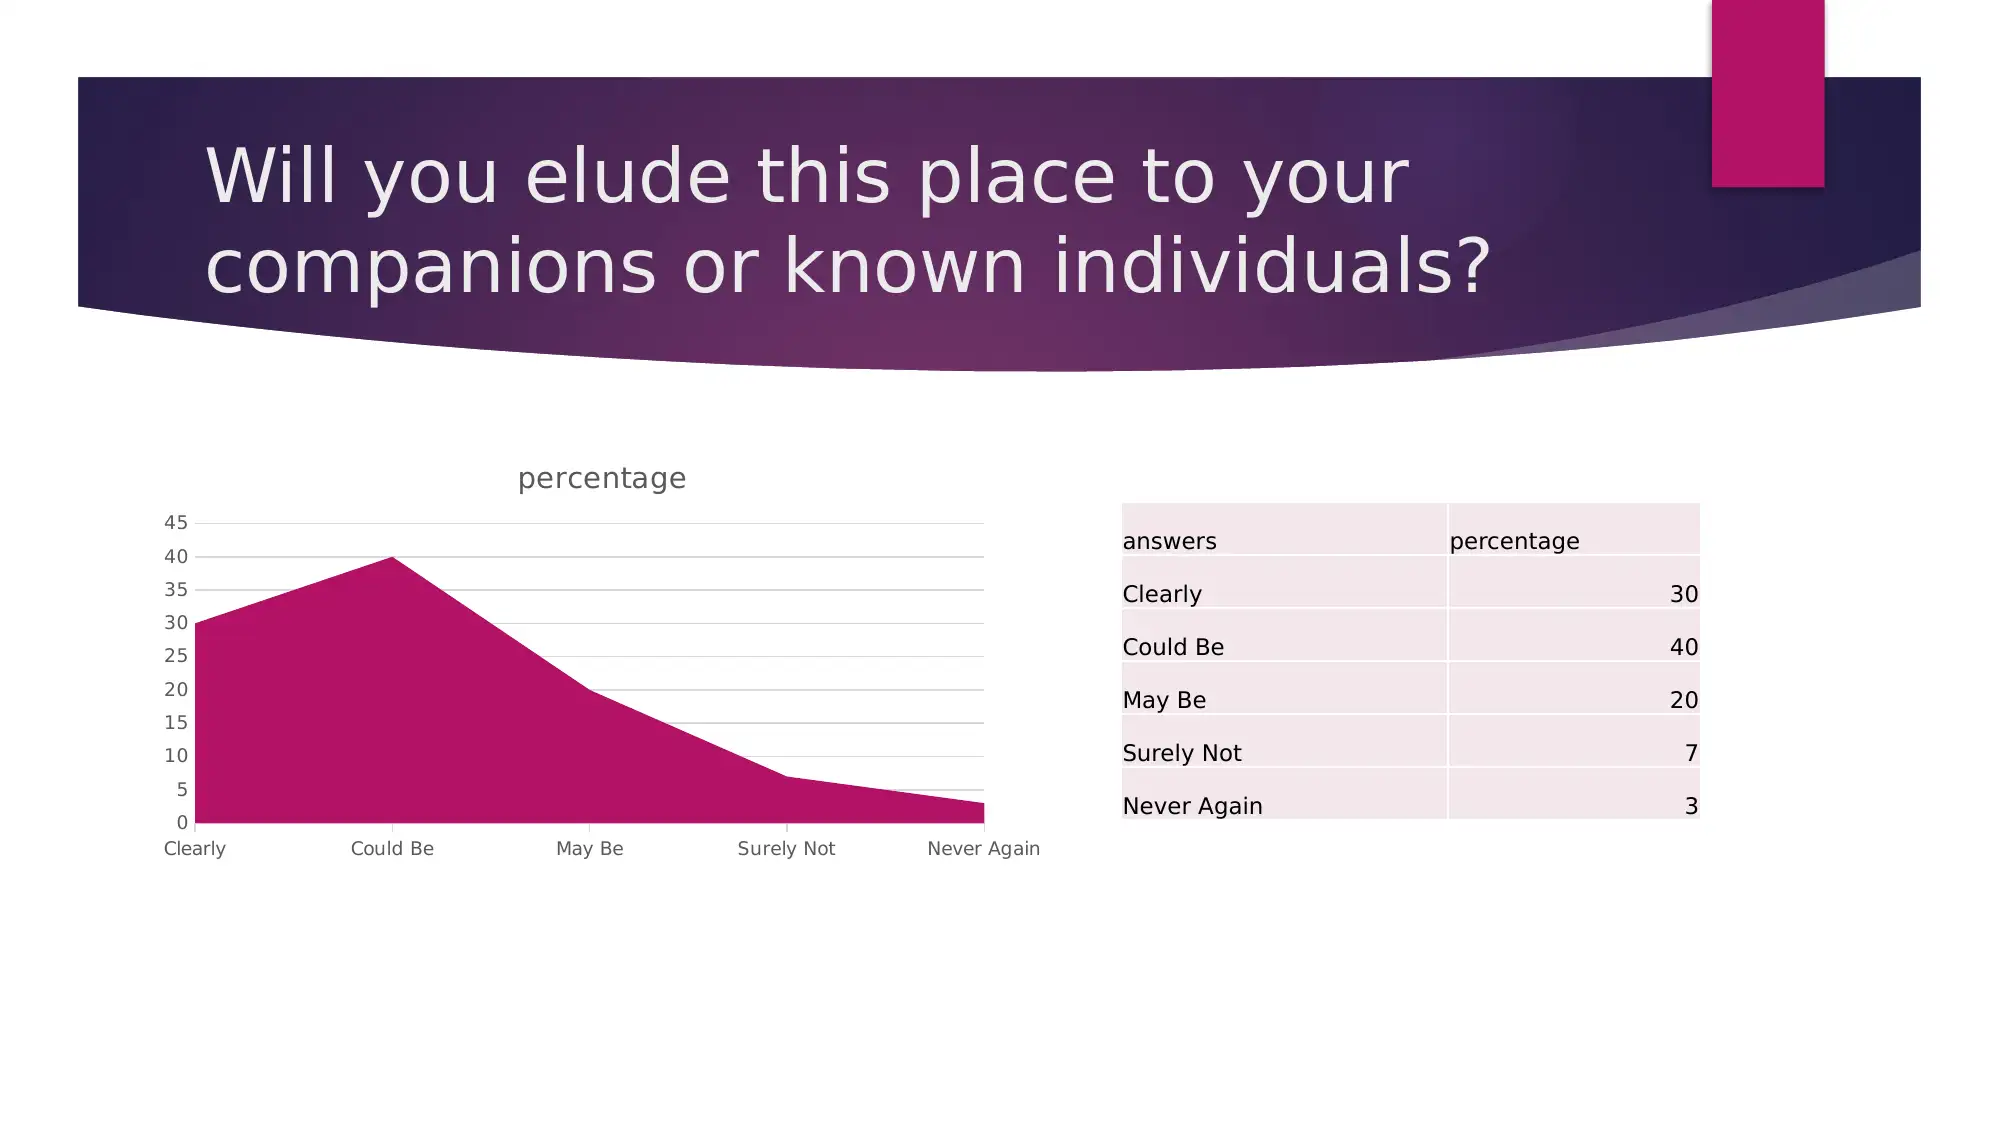
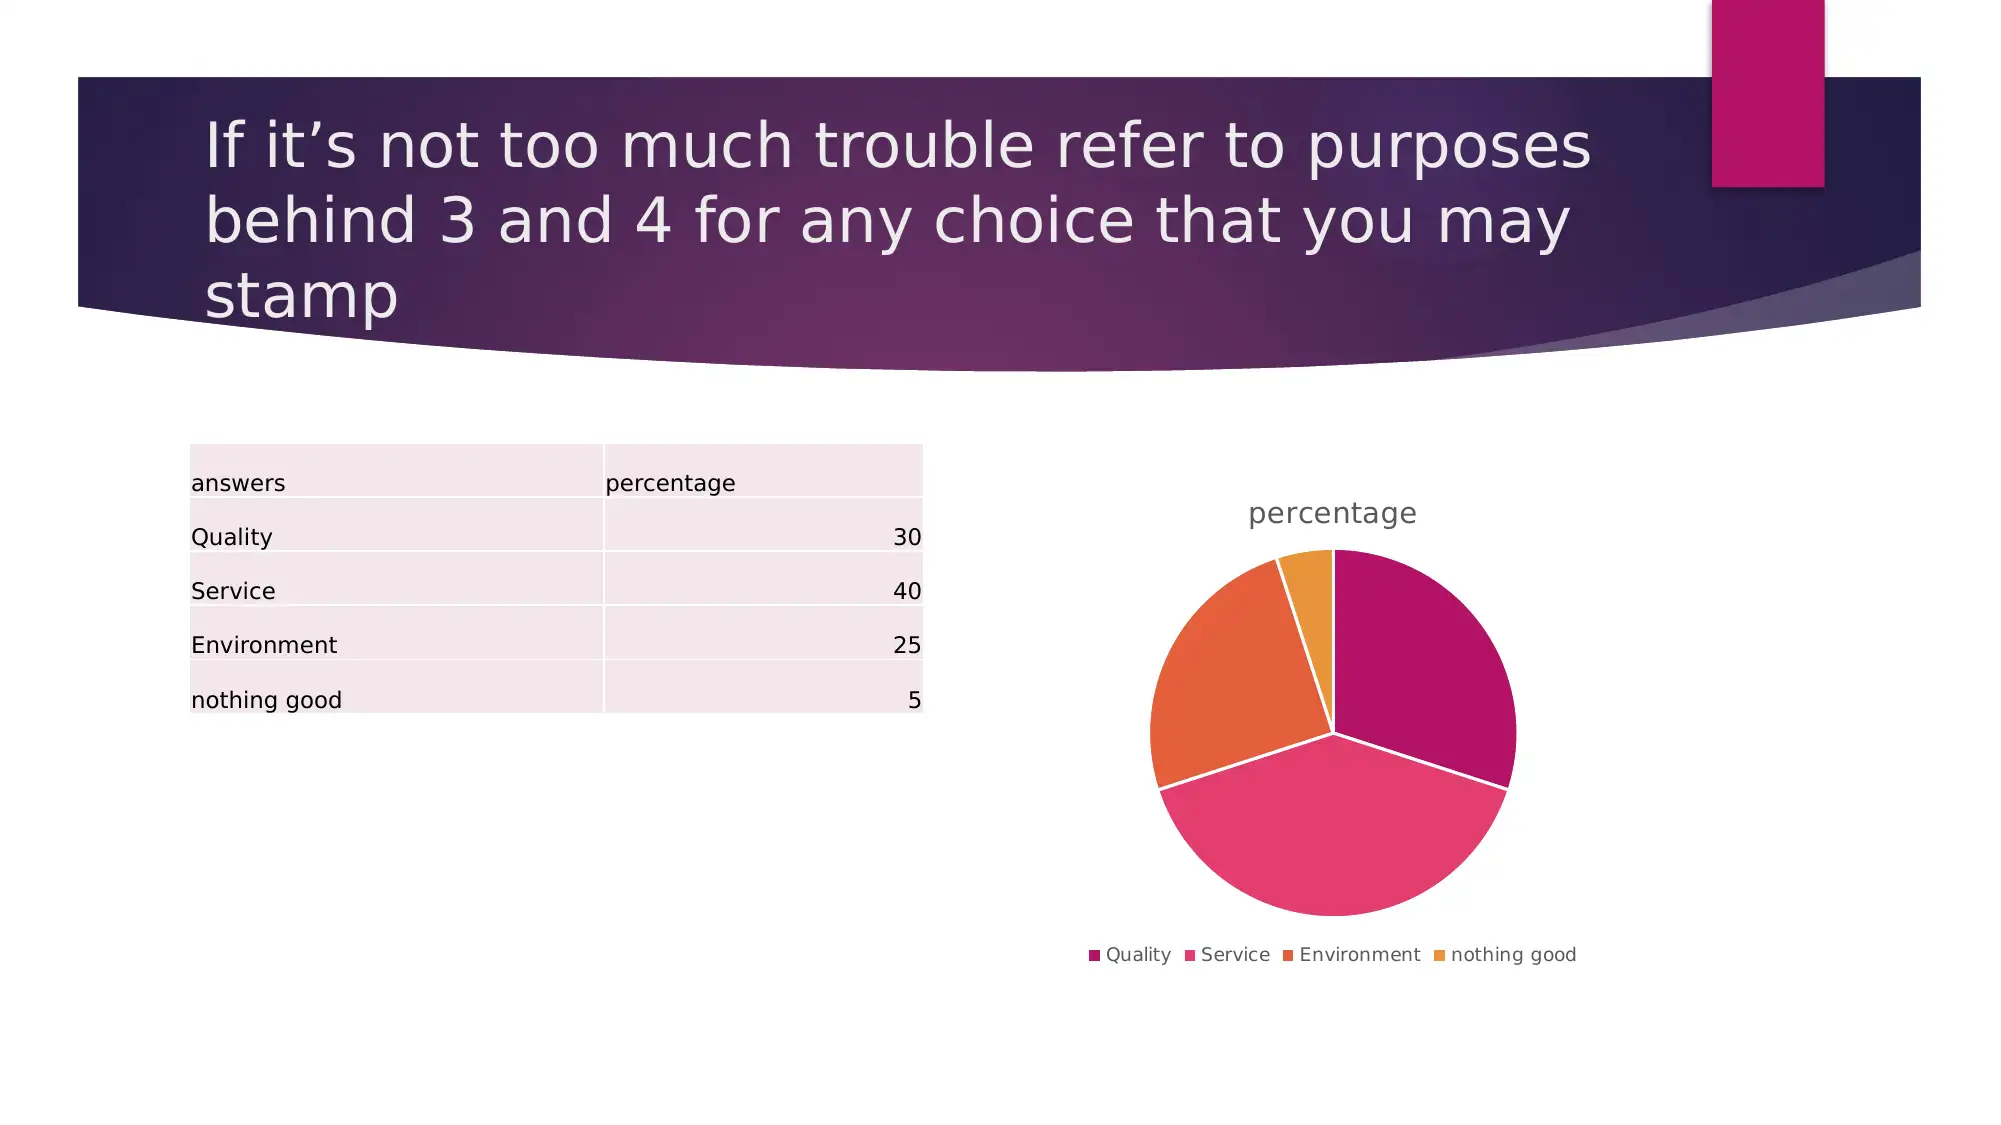
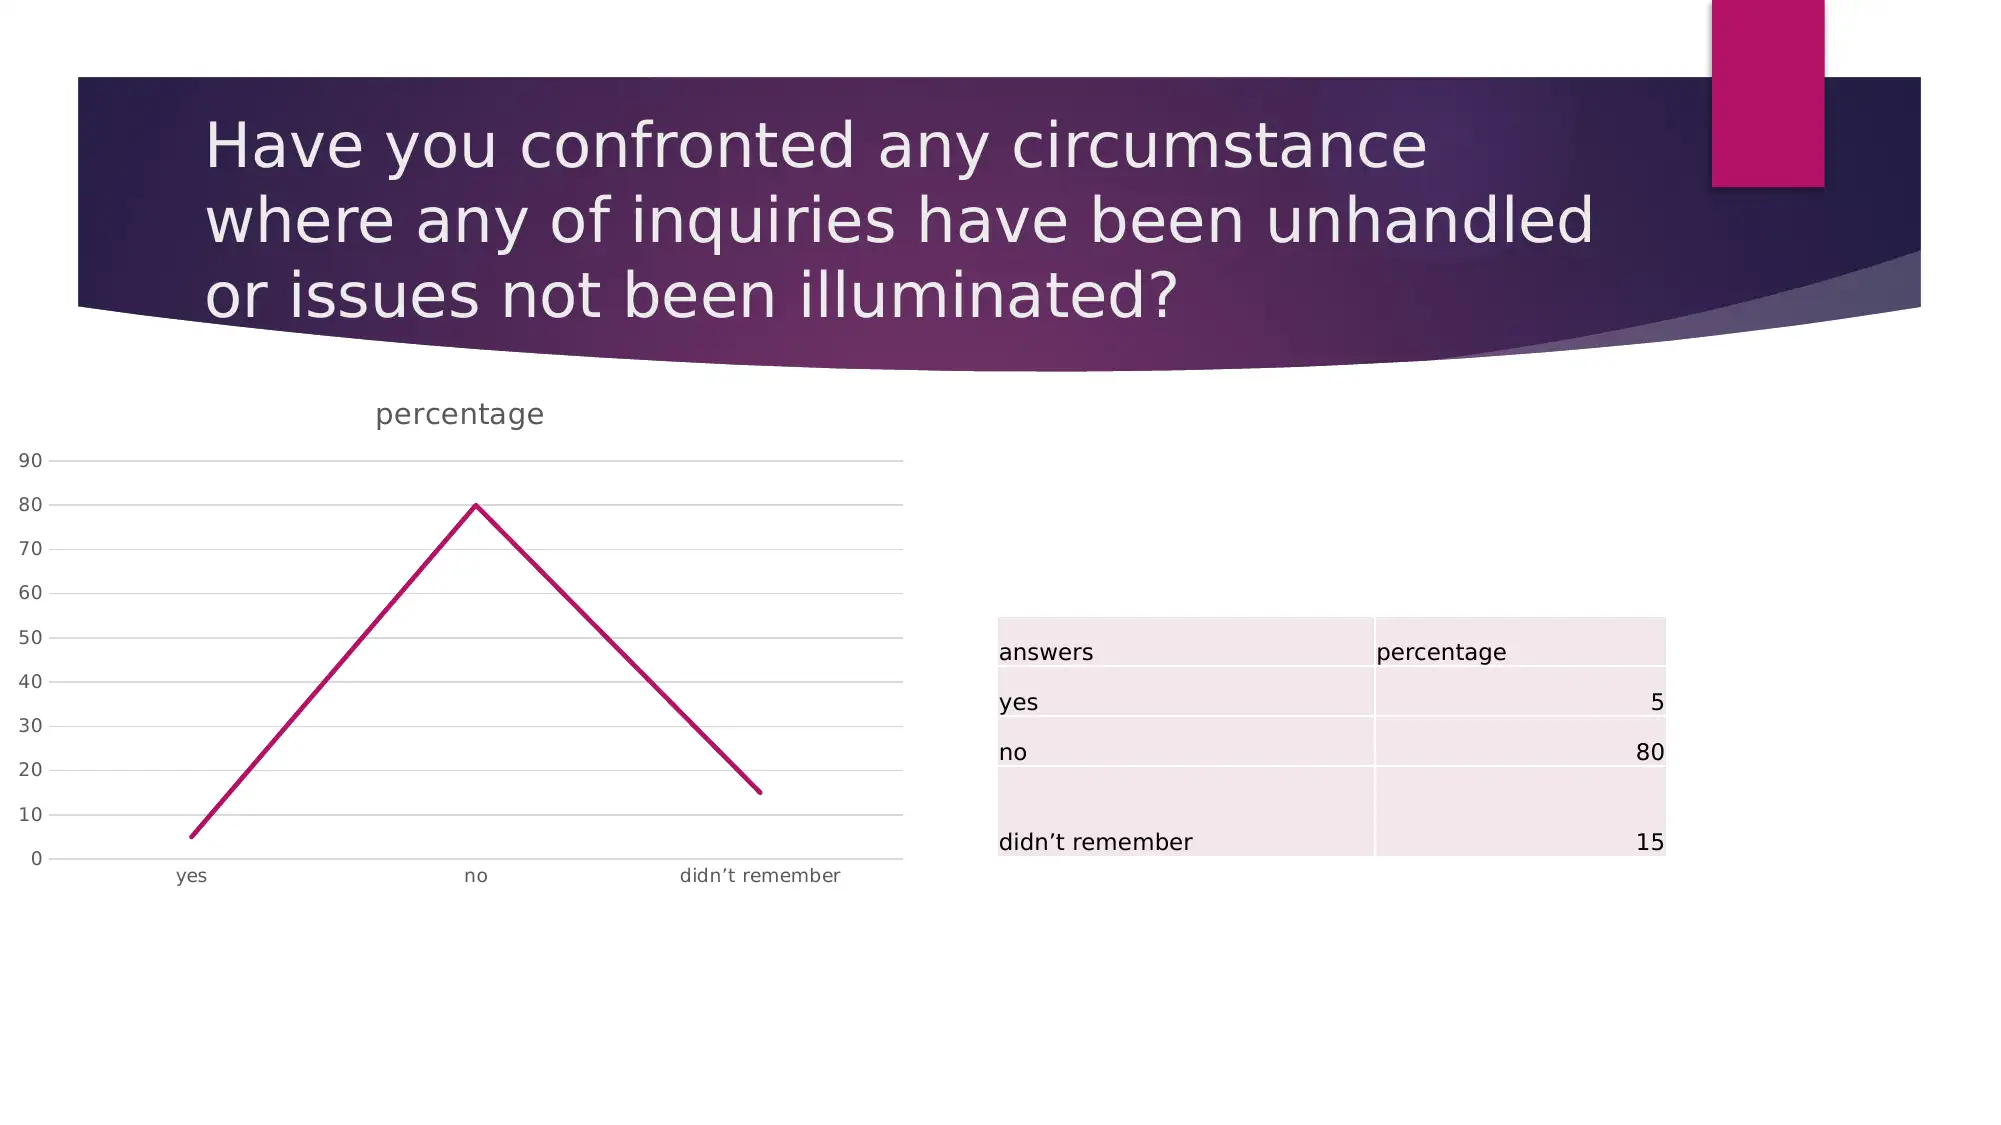
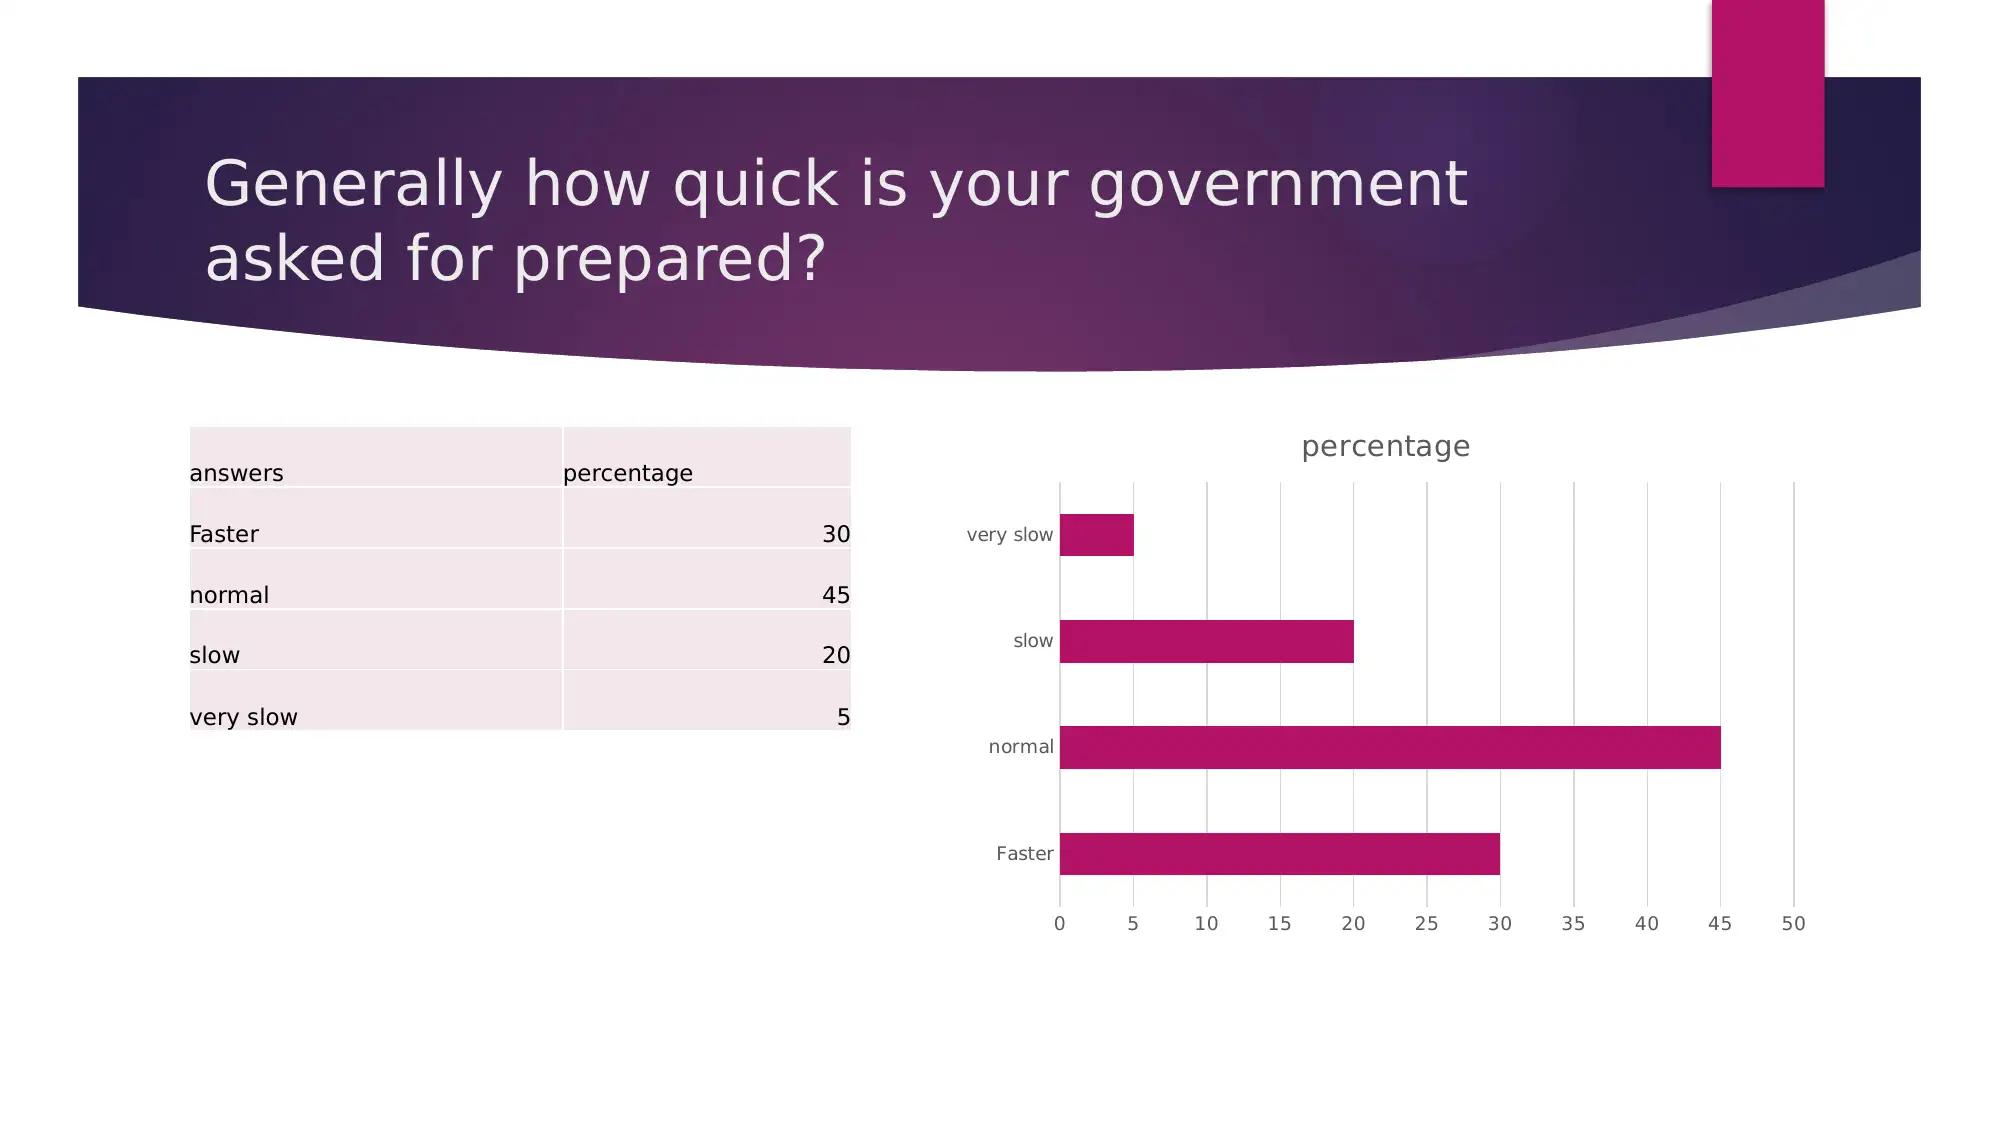
This report presents an analysis of customer service data collected through surveys and feedback. The data encompasses various aspects of customer interaction, including customer demographics (domestic, national, and international), profession, and frequency of property visits. Key findings reveal customer involvement levels, satisfaction ratings (1-5 scale), and likelihood of returning to the establishment. The report also explores customer intentions to recommend the property, reasons behind specific ratings, and feedback regarding service speed and staff effectiveness. Furthermore, it includes an analysis of the maximum wait times for service and the handling of customer issues. The data is presented using percentages and charts, providing a comprehensive overview of customer perceptions and experiences. The report concludes with recommendations based on the customer feedback and data analysis, to improve overall customer service and satisfaction. References from various academic journals support the analysis.
Document Page
Customer Service
Name:
Lecturer’s name:
Student ID:
tabler-icon-diamond-filled.svg

Paraphrase This Document

Need a fresh take? Get an instant paraphrase of this document with our AI Paraphraser
Document Page
Type of customer
percentage
domestic national international
answers percentage
domestic 60
national 30
international 10
Document Page
Profession
answers percentage
business 30
office going 50
student 20
business office going student
0
10
20
30
40
50
60
percentage
Document Page
How much of the time do you visit
this property?
answers percentage
month- to- month 40
by- yearly 40
annually 20
percentage
month- to- month by- yearly annually
tabler-icon-diamond-filled.svg

Paraphrase This Document

Need a fresh take? Get an instant paraphrase of this document with our AI Paraphraser
Document Page
Please rate your general involvement on 1
to 5 where one identifies with most
exceedingly
terrible and 5 to great
answers percentage
1 5
2 5
3 20
4 40
5 30
1 2 3 4 5
0
5
10
15
20
25
30
35
40
45
50
Chart Title
answers percentage
Document Page
What is the shot of your returning to
this inn?
answers percentage
Clearly 40
Could Be 30
May Be 15
Surely Not 10
Never Again 5
Clearly
Could Be
May Be
Surely Not
Never Again
0 5 10 15 20 25 30 35 40 45
percentage
Document Page
Will you elude this place to your
companions or known individuals?
answers percentage
Clearly 30
Could Be 40
May Be 20
Surely Not 7
Never Again 3
Clearly Could Be May Be Surely Not Never Again
0
5
10
15
20
25
30
35
40
45
percentage
tabler-icon-diamond-filled.svg

Paraphrase This Document

Need a fresh take? Get an instant paraphrase of this document with our AI Paraphraser
Document Page
If it’s not too much trouble refer to purposes
behind 3 and 4 for any choice that you may
stamp
answers percentage
Quality 30
Service 40
Environment 25
nothing good 5
percentage
Quality Service Environment nothing good
Document Page
Remarks and Recommendation from
customers
Document Page
What is the most extreme that you have sat
tight for an administration in this inn?
tabler-icon-diamond-filled.svg

Paraphrase This Document

Need a fresh take? Get an instant paraphrase of this document with our AI Paraphraser
Document Page
Have you confronted any circumstance
where any of inquiries have been unhandled
or issues not been illuminated?
answers percentage
yes 5
no 80
didn’t remember 15
yes no didn’t remember
0
10
20
30
40
50
60
70
80
90
percentage
Document Page
Generally how quick is your government
asked for prepared?
answers percentage
Faster 30
normal 45
slow 20
very slow 5
Faster
normal
slow
very slow
0 5 10 15 20 25 30 35 40 45 50
percentage
chevron_up_icon
1 out of 14
circle_padding
hide_on_mobile
zoom_out_icon
[object Object]