CVP and Financial Statement Analysis of Ytrew Limited and Competitor
VerifiedAdded on 2023/01/06
|11
|1449
|39
Report
AI Summary
This report presents a comprehensive financial analysis of Ytrew Limited, comparing its performance to a competitor using financial ratios and a break-even analysis. Part A delves into the financial statements, assessing liquidity, capital structure, and operating profit. Key ratios like the current ratio, quick ratio, debt ratio, and return on equity are calculated and compared. The analysis reveals that while both firms have strong liquidity positions, Ytrew Limited's operating profit lags behind its competitor. Part B focuses on the break-even point and cost-volume-profit (CVP) analysis, exploring the impact of changes in selling price, variable costs, and production methods on profitability. The report recommends that Ytrew Limited consider changes in production methods to improve its long-term profitability based on projected profit increases with the new methods. The conclusion emphasizes the importance of financial statement analysis for effective business decision-making, highlighting the use of ratios in assessing a company's position within a competitive market.
CVP AND FINANCIAL STATEMENT
ANALYSIS
ANALYSIS
Paraphrase This Document
Need a fresh take? Get an instant paraphrase of this document with our AI Paraphraser
EXECUTIVE SUMMARY
Current report is divided into two part. Part A highlight the Financial statement analysis of Ytrew
Limited and its competitor. On the basis of the same after that repost highlights the comparison
between both the company on the basis of operating profit, Liquidity and Return on Equity. In the
PART B of the report highlights the break even point for the company and on the basis of the same
Cost volume profit chart of the company. In the end report recommend whether desire changes in
production and machinery need to be made by the organization or not.
Table of Contents
PART A.................................................................................................................................................4
PART B.................................................................................................................................................6
CONCLUSION....................................................................................................................................8
APPENDIX.........................................................................................................................................11
⊘ This is a preview!⊘
Do you want full access?
Subscribe today to unlock all pages.
Trusted by 1+ million students worldwide
PART A
a)
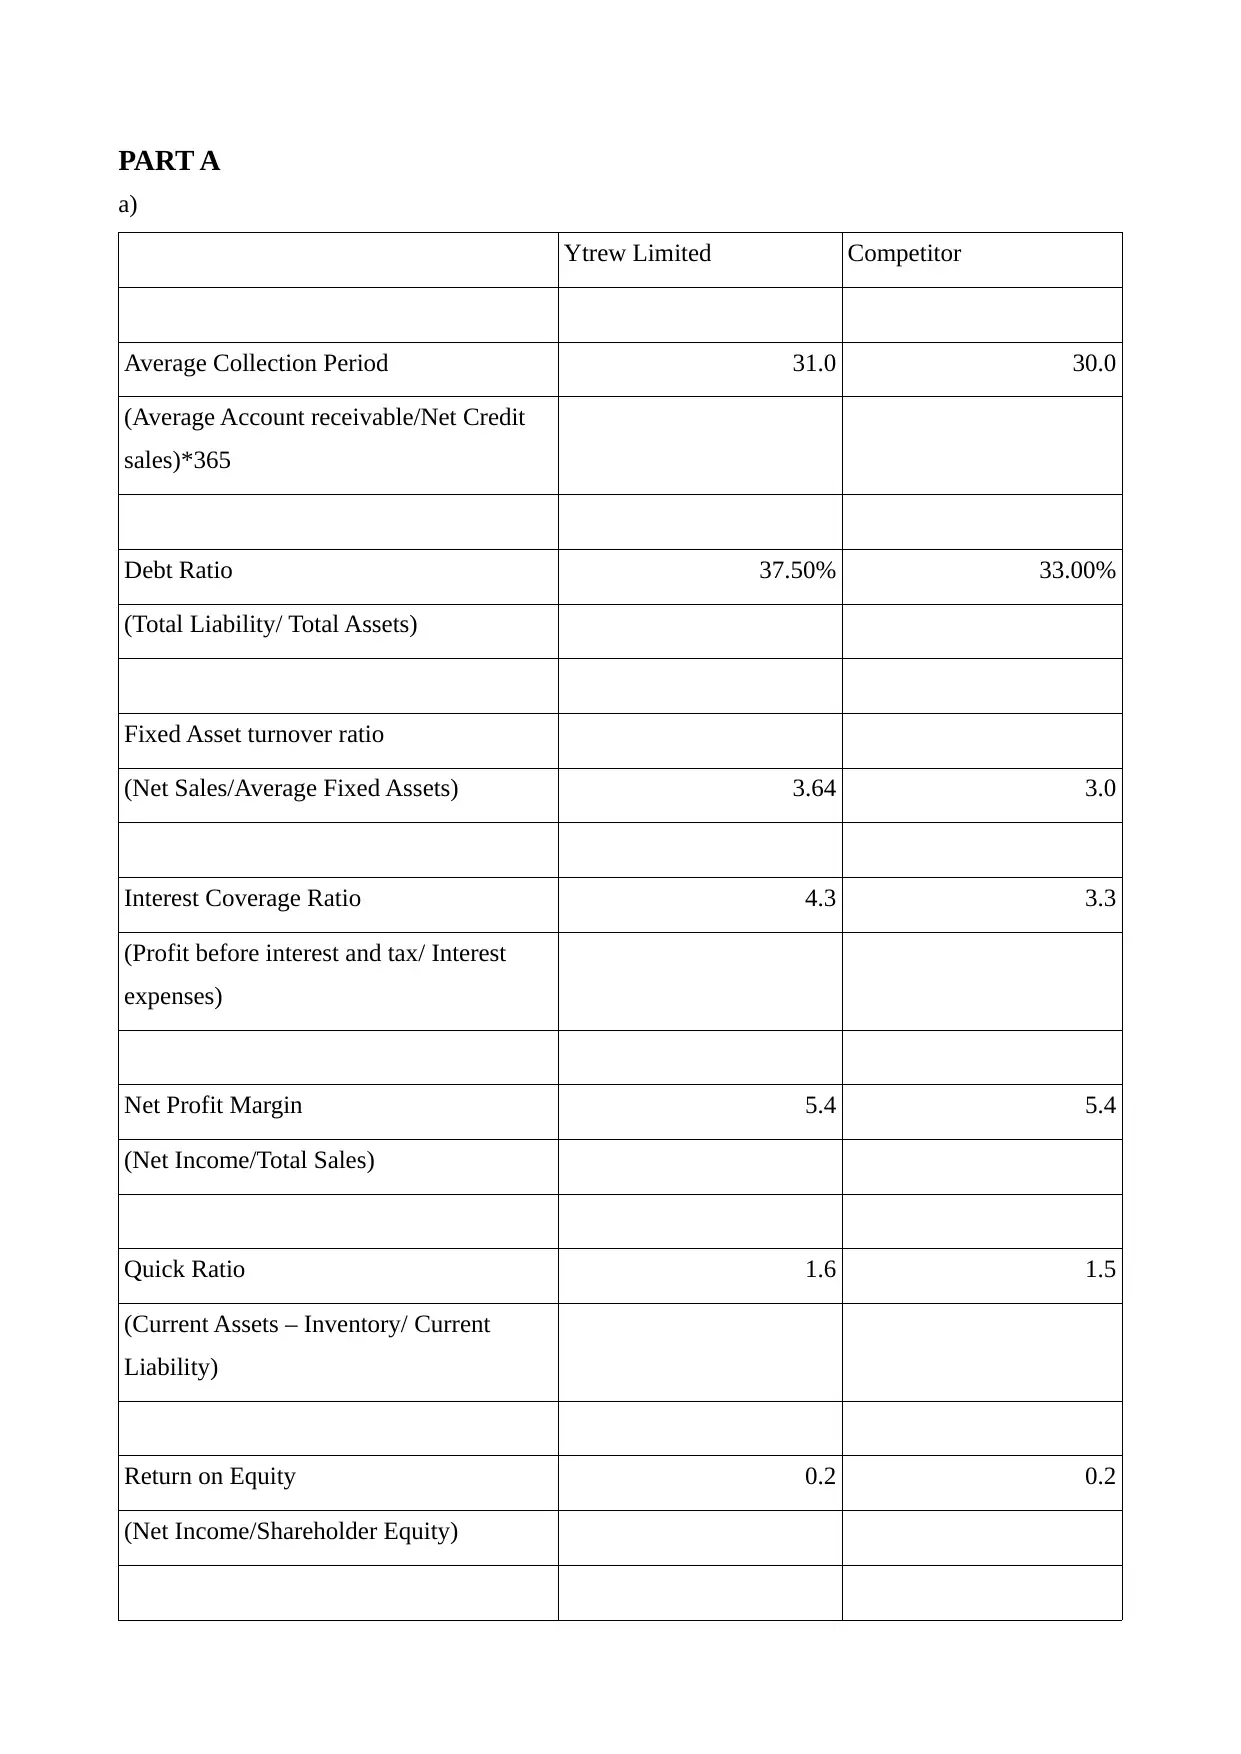
Ytrew Limited Competitor
Average Collection Period 31.0 30.0
(Average Account receivable/Net Credit
sales)*365
Debt Ratio 37.50% 33.00%
(Total Liability/ Total Assets)
Fixed Asset turnover ratio
(Net Sales/Average Fixed Assets) 3.64 3.0
Interest Coverage Ratio 4.3 3.3
(Profit before interest and tax/ Interest
expenses)
Net Profit Margin 5.4 5.4
(Net Income/Total Sales)
Quick Ratio 1.6 1.5
(Current Assets – Inventory/ Current
Liability)
Return on Equity 0.2 0.2
(Net Income/Shareholder Equity)
a)
Ytrew Limited Competitor
Average Collection Period 31.0 30.0
(Average Account receivable/Net Credit
sales)*365
Debt Ratio 37.50% 33.00%
(Total Liability/ Total Assets)
Fixed Asset turnover ratio
(Net Sales/Average Fixed Assets) 3.64 3.0
Interest Coverage Ratio 4.3 3.3
(Profit before interest and tax/ Interest
expenses)
Net Profit Margin 5.4 5.4
(Net Income/Total Sales)
Quick Ratio 1.6 1.5
(Current Assets – Inventory/ Current
Liability)
Return on Equity 0.2 0.2
(Net Income/Shareholder Equity)
Paraphrase This Document
Need a fresh take? Get an instant paraphrase of this document with our AI Paraphraser
Current Ratio 2.1 2.0
(Current Assets/Current Liability)
Equity Multiplier 1.6 1.5
(Total Assets /Shareholder Equity)
Gross Profit Margin 0.2 0.2
(Gross Profit/ Revenue)
Inventory Turnover ratio 26.0 27.0
(Cogs/ Average Inventory)
Operating Profit margin 10.00% 11.00%
(Operating profit/ sales)
Return on Assets 25.00% 24.20%
(Operating Income/ Total Assets)
Total Assets Turnover 2.5 2.2
(Net Income/Average total assets)
b)
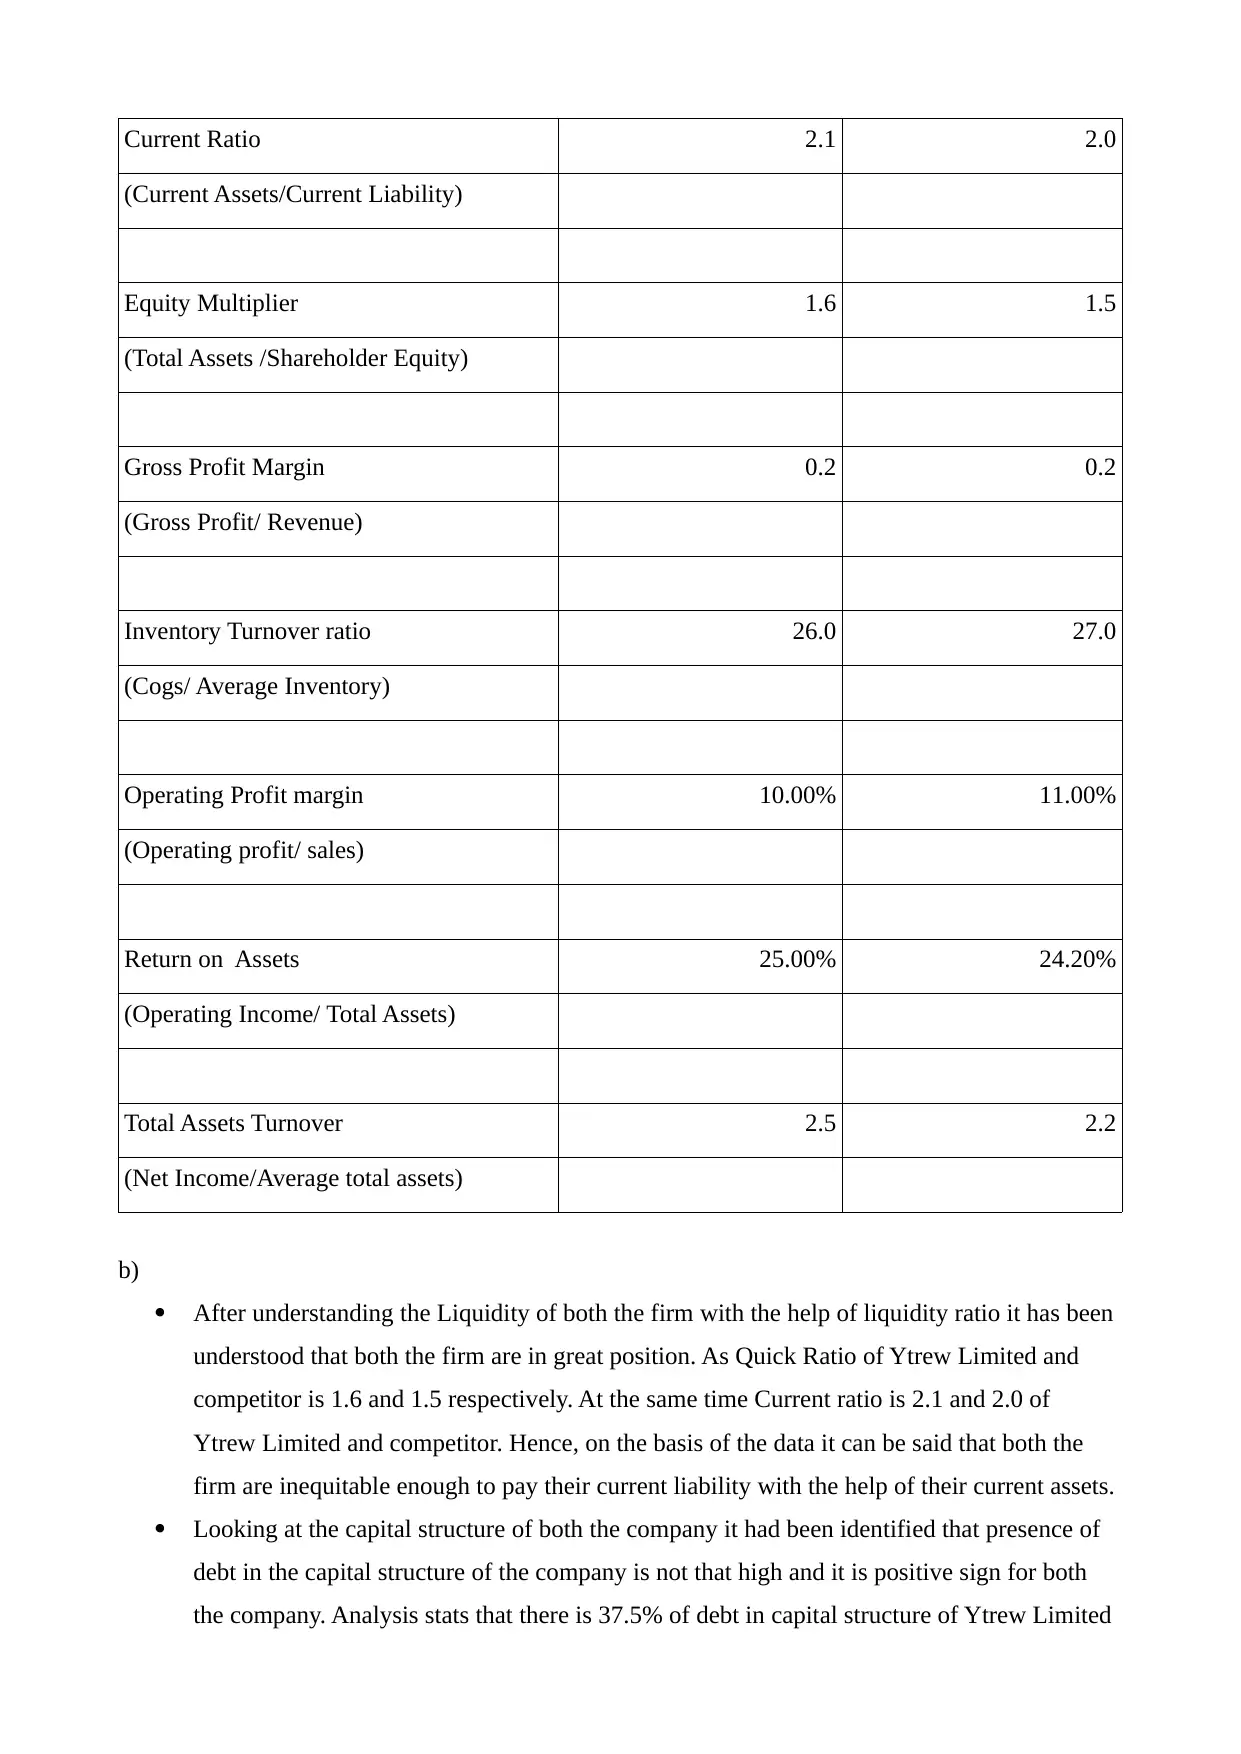
After understanding the Liquidity of both the firm with the help of liquidity ratio it has been
understood that both the firm are in great position. As Quick Ratio of Ytrew Limited and
competitor is 1.6 and 1.5 respectively. At the same time Current ratio is 2.1 and 2.0 of
Ytrew Limited and competitor. Hence, on the basis of the data it can be said that both the
firm are inequitable enough to pay their current liability with the help of their current assets.
Looking at the capital structure of both the company it had been identified that presence of
debt in the capital structure of the company is not that high and it is positive sign for both
the company. Analysis stats that there is 37.5% of debt in capital structure of Ytrew Limited
(Current Assets/Current Liability)
Equity Multiplier 1.6 1.5
(Total Assets /Shareholder Equity)
Gross Profit Margin 0.2 0.2
(Gross Profit/ Revenue)
Inventory Turnover ratio 26.0 27.0
(Cogs/ Average Inventory)
Operating Profit margin 10.00% 11.00%
(Operating profit/ sales)
Return on Assets 25.00% 24.20%
(Operating Income/ Total Assets)
Total Assets Turnover 2.5 2.2
(Net Income/Average total assets)
b)
After understanding the Liquidity of both the firm with the help of liquidity ratio it has been
understood that both the firm are in great position. As Quick Ratio of Ytrew Limited and
competitor is 1.6 and 1.5 respectively. At the same time Current ratio is 2.1 and 2.0 of
Ytrew Limited and competitor. Hence, on the basis of the data it can be said that both the
firm are inequitable enough to pay their current liability with the help of their current assets.
Looking at the capital structure of both the company it had been identified that presence of
debt in the capital structure of the company is not that high and it is positive sign for both
the company. Analysis stats that there is 37.5% of debt in capital structure of Ytrew Limited
and 33% in the capital structure of competitor.
c)
Above presented data and Income statement of both the company had helped in
understanding the operating profit possition of competitor is way better than Ytrew Limited
in general. As operating profit of Ytrew Limited is 268500, at the same time operating profit
of competitor is 2858988. Reason behind difference in the both is the amount of sales done
by both the organization. As total sales or revenue of Ytrew is just 2685000 as compare to
that of competitor whose sales is 25990800.
Further analysing the data has helped in understanding that cost of good production is same
for both the firm as ratio of Net sales and Cost of Good sold for both the firm is
1.282051282. Looking at ratio between Net sales and operating expenses it has been
identified that Ytrew Limited is having better position. As indirect expenses incurred by
Ytrew limited on every unit sold is just 8.34 whereas its competitor is incurring $9.1
indirect expenses on every unit sold. Hence, it has been recommended to management of
Ytrew Limited that they have to concentrate more on improving the sales of company to
enhance the operating profit of the company.
d)
Particular Ytrew Limited Competitor
Net Profit Margin 5.4 5.4
Asset Turnover Ratio 2.5 2.2
Financial Leverage 1.6 1.5
Return on Equity 21.5 17.6
Looking at the Du point Decomposition of return of equity of both the company, it had been
understood that Ytrew Limited is having better Return on equity as compare to Competitor. As
Return on Equity of Ytrew Limited is 21.5 whereas return on equity of competitor is 17.6 only. One
of the biggest reason which has been identified for the same is that Ytrew Limited is using their
assets more effectively in regard to generating the sales when compare to Competitor in the market.
As Asset turnover ratio of Ytrew Limited is 2.5 whereas competitor Asset Turnover ratio is just 2.2.
PART B
a)
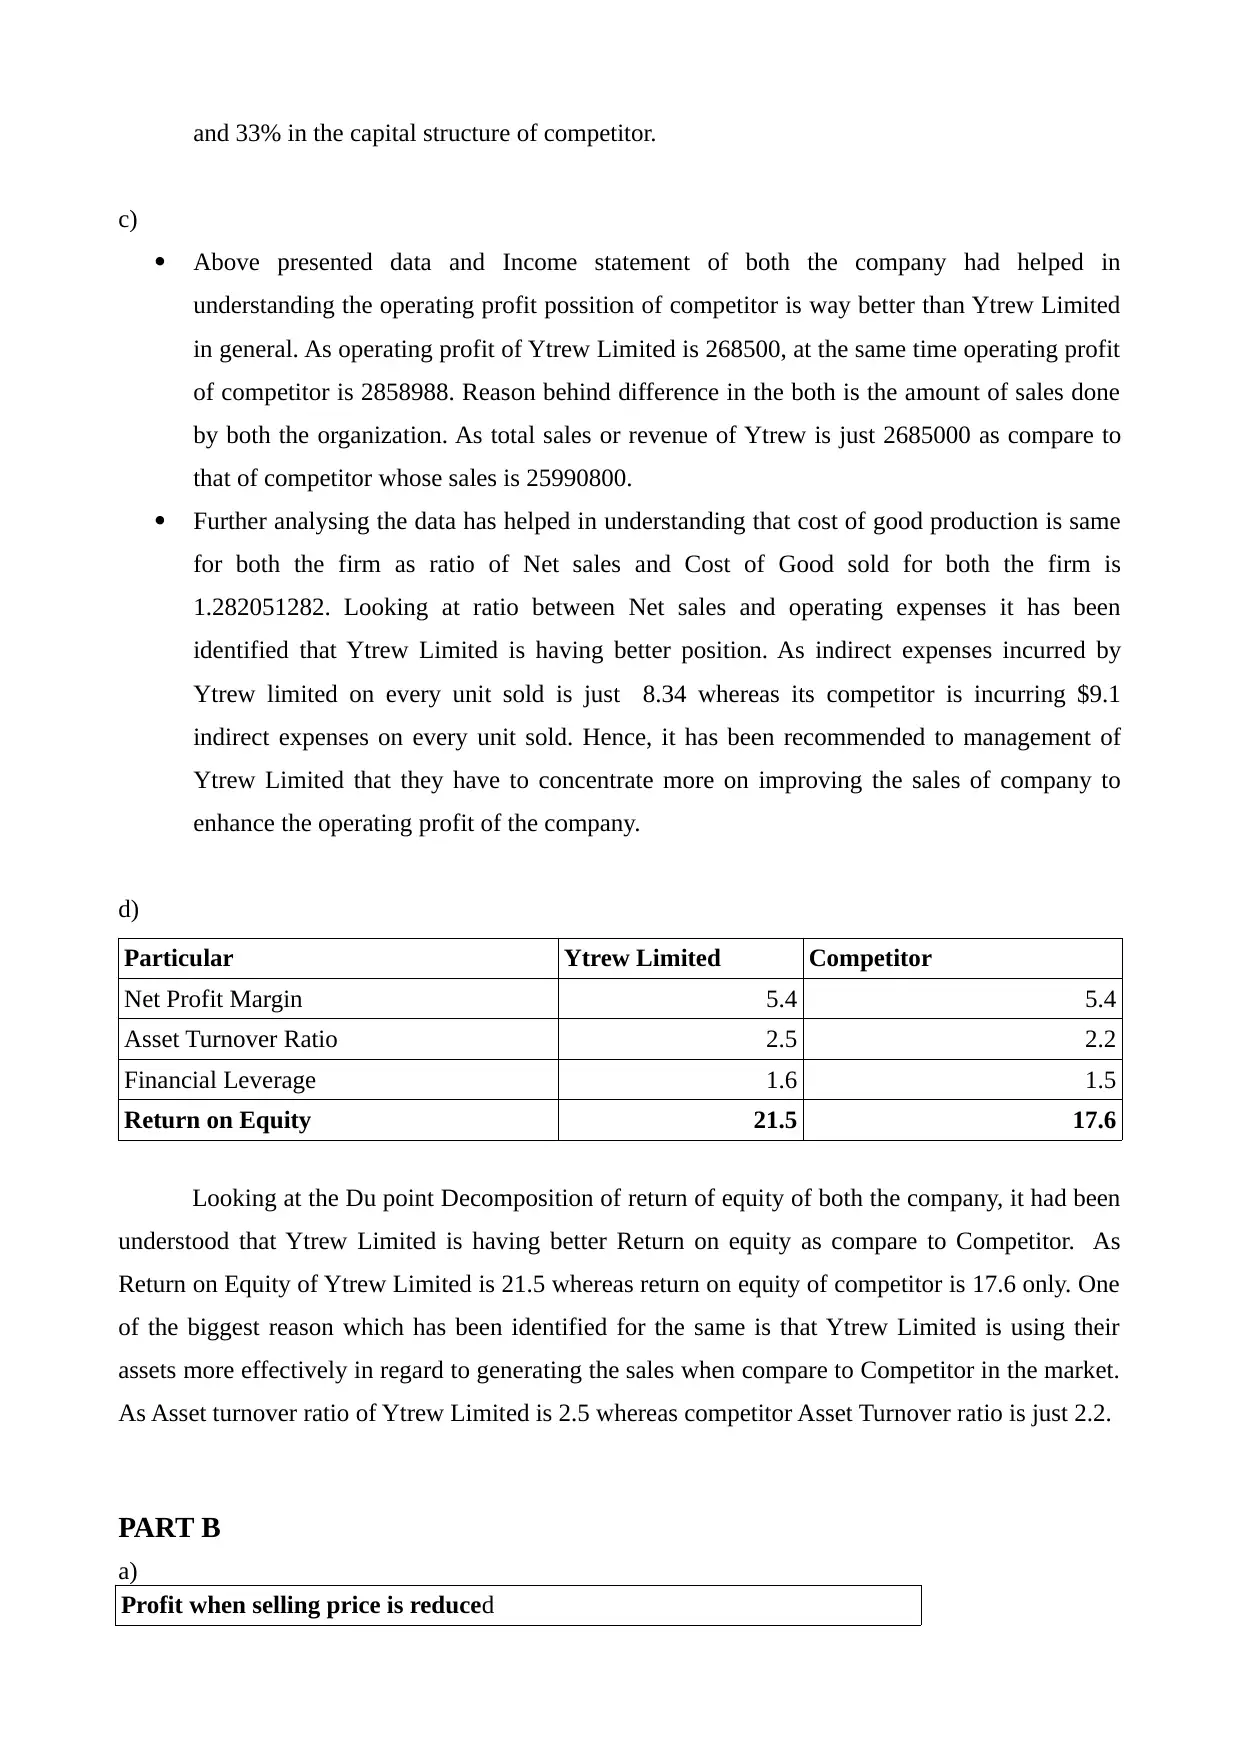
Profit when selling price is reduced
c)
Above presented data and Income statement of both the company had helped in
understanding the operating profit possition of competitor is way better than Ytrew Limited
in general. As operating profit of Ytrew Limited is 268500, at the same time operating profit
of competitor is 2858988. Reason behind difference in the both is the amount of sales done
by both the organization. As total sales or revenue of Ytrew is just 2685000 as compare to
that of competitor whose sales is 25990800.
Further analysing the data has helped in understanding that cost of good production is same
for both the firm as ratio of Net sales and Cost of Good sold for both the firm is
1.282051282. Looking at ratio between Net sales and operating expenses it has been
identified that Ytrew Limited is having better position. As indirect expenses incurred by
Ytrew limited on every unit sold is just 8.34 whereas its competitor is incurring $9.1
indirect expenses on every unit sold. Hence, it has been recommended to management of
Ytrew Limited that they have to concentrate more on improving the sales of company to
enhance the operating profit of the company.
d)
Particular Ytrew Limited Competitor
Net Profit Margin 5.4 5.4
Asset Turnover Ratio 2.5 2.2
Financial Leverage 1.6 1.5
Return on Equity 21.5 17.6
Looking at the Du point Decomposition of return of equity of both the company, it had been
understood that Ytrew Limited is having better Return on equity as compare to Competitor. As
Return on Equity of Ytrew Limited is 21.5 whereas return on equity of competitor is 17.6 only. One
of the biggest reason which has been identified for the same is that Ytrew Limited is using their
assets more effectively in regard to generating the sales when compare to Competitor in the market.
As Asset turnover ratio of Ytrew Limited is 2.5 whereas competitor Asset Turnover ratio is just 2.2.
PART B
a)
Profit when selling price is reduced
⊘ This is a preview!⊘
Do you want full access?
Subscribe today to unlock all pages.
Trusted by 1+ million students worldwide
Particulars Amount in $
Sales (157500*9.7) 1527750
Variable expenses (157500*4.7) 740250
Contribution margin (157500*5) 787500
Fixed expenses 243000
Expected Profit 544500
Selling price per unit (1485000/150000 -0.2) 9.7
Variable cost per unit (705000/150000) 4.7
Contribution margin (SP per unit less VC per unit) 5
Total fixed cost 243000
Break even point (in units)
(Fixed cost /contribution per
unit) 48600
Profit when updating machinery and production methods
Particulars Amount in $
Sales (150000*9.9) 1485000
Variable expenses (150000*3.4) 510000
Contribution margin (150000*6.5) 975000
Fixed expenses (243000+68000) 311000
Expected Profit 664000
Selling price per unit (1485000/150000) 9.9
Variable cost per unit (705000/150000 -1.30) 3.4
Contribution margin (SP per unit less VC per unit) 6.5
Total fixed cost (243000+68000) 311000
Break even point (in units)
(Fixed cost /contribution per
unit) 47846
b)
Sales units 0 50000 100000 150000 200000
Expected Profit (no
change) -243000 17000 277000 537000 796999
Expected Profit
(machinery and
production methods) -311000 14000 339000 664000 989000
(Workings in appendix)
c)
Paraphrase This Document
Need a fresh take? Get an instant paraphrase of this document with our AI Paraphraser
0 11682 23365 35048 46730.758413.770096.7 81778 93461
0
100000
200000
300000
400000
500000
600000
700000
800000
900000
1000000
CVP under current operation
Sales value
Fixed cost
Total cost
d)
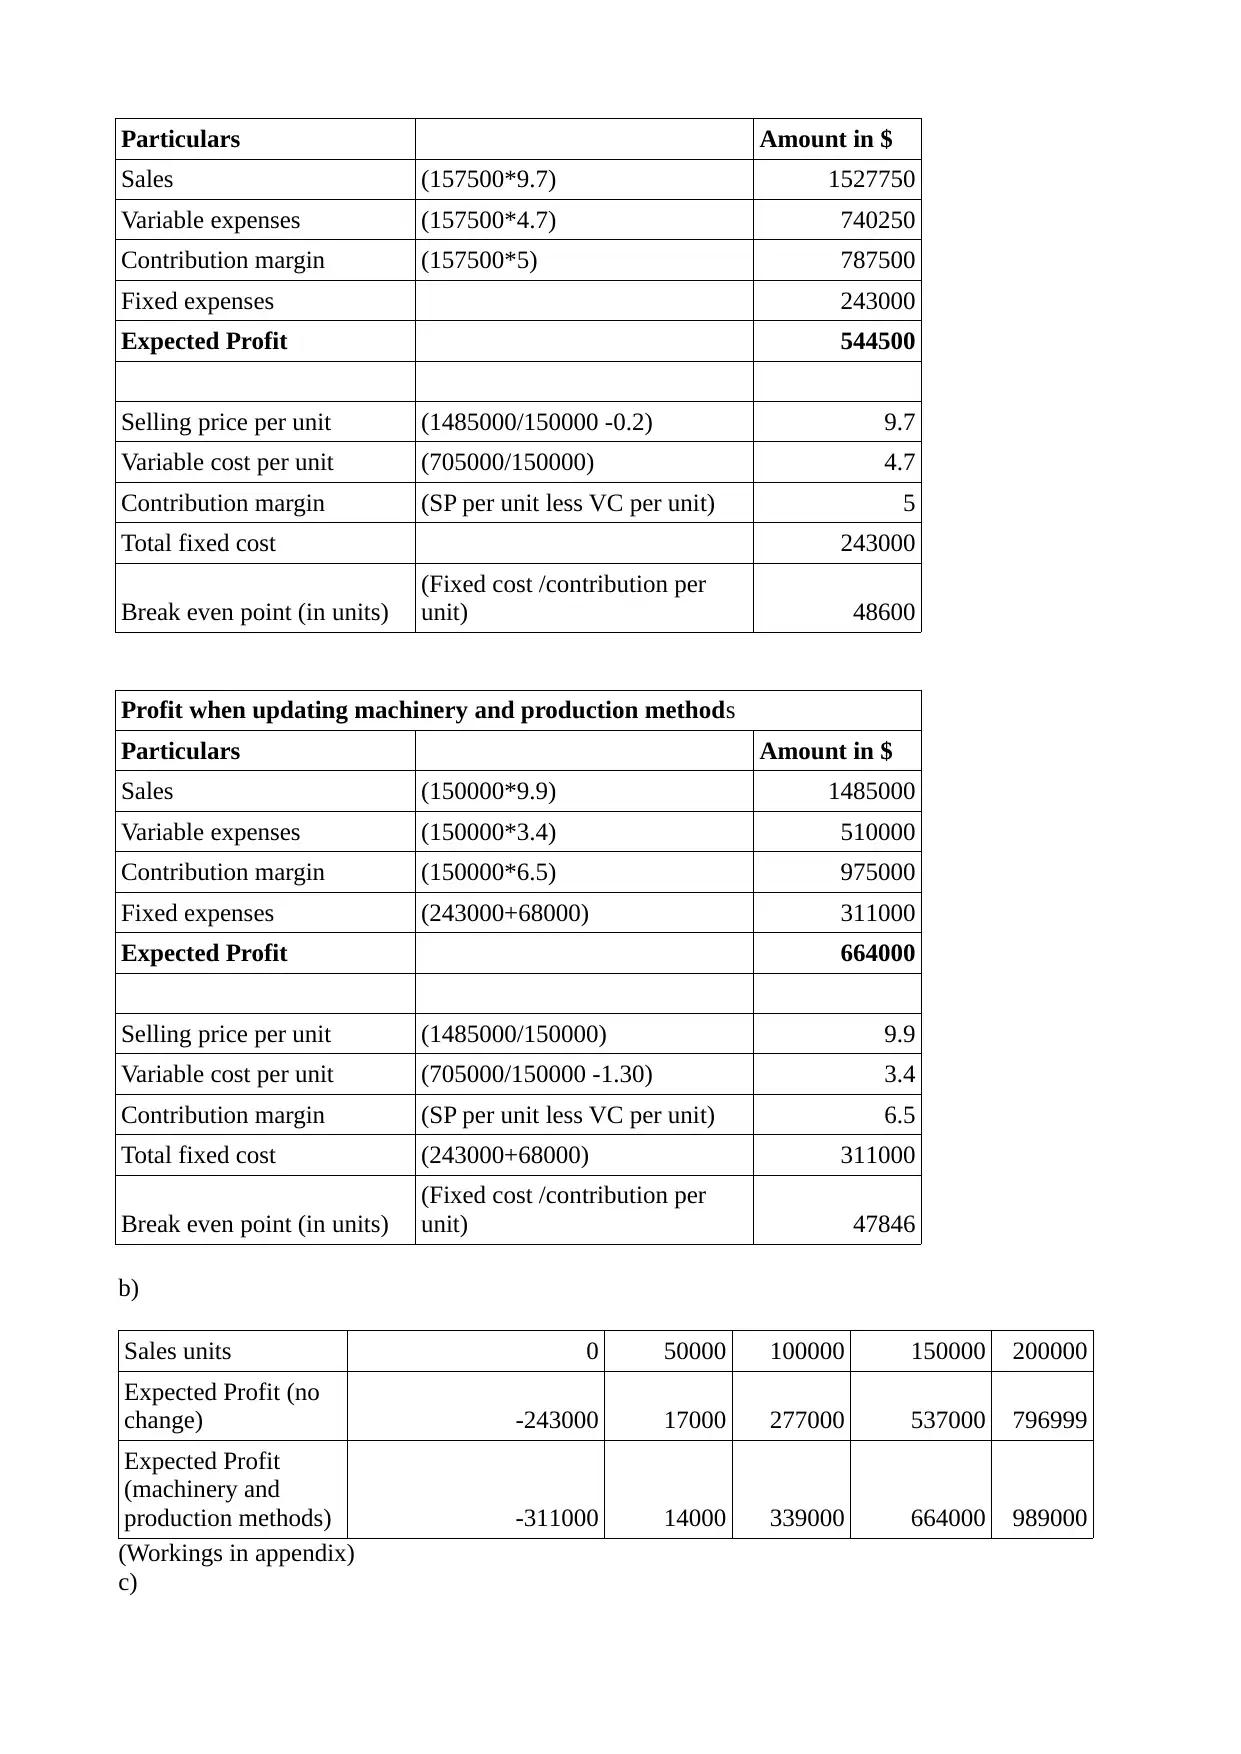
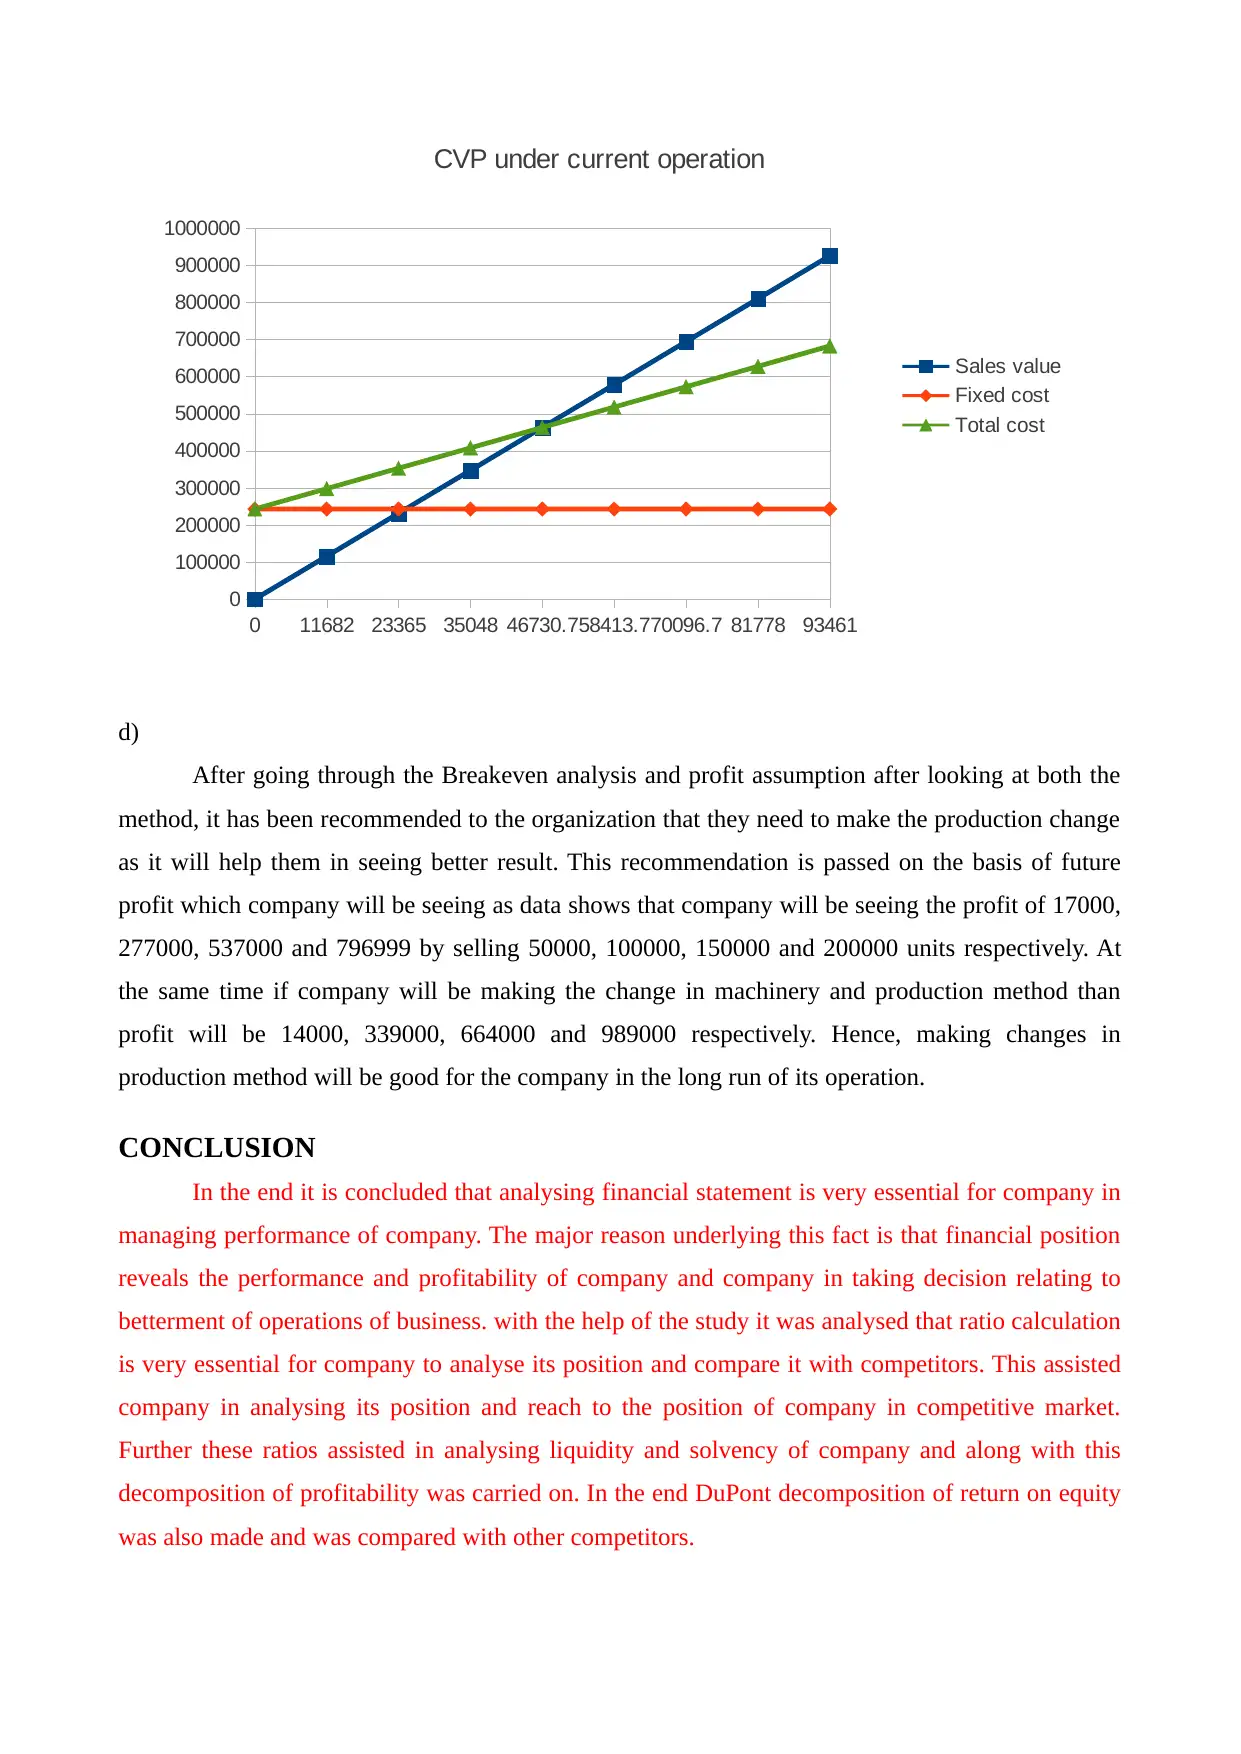
After going through the Breakeven analysis and profit assumption after looking at both the
method, it has been recommended to the organization that they need to make the production change
as it will help them in seeing better result. This recommendation is passed on the basis of future
profit which company will be seeing as data shows that company will be seeing the profit of 17000,
277000, 537000 and 796999 by selling 50000, 100000, 150000 and 200000 units respectively. At
the same time if company will be making the change in machinery and production method than
profit will be 14000, 339000, 664000 and 989000 respectively. Hence, making changes in
production method will be good for the company in the long run of its operation.
CONCLUSION
In the end it is concluded that analysing financial statement is very essential for company in
managing performance of company. The major reason underlying this fact is that financial position
reveals the performance and profitability of company and company in taking decision relating to
betterment of operations of business. with the help of the study it was analysed that ratio calculation
is very essential for company to analyse its position and compare it with competitors. This assisted
company in analysing its position and reach to the position of company in competitive market.
Further these ratios assisted in analysing liquidity and solvency of company and along with this
decomposition of profitability was carried on. In the end DuPont decomposition of return on equity
was also made and was compared with other competitors.
0
100000
200000
300000
400000
500000
600000
700000
800000
900000
1000000
CVP under current operation
Sales value
Fixed cost
Total cost
d)
After going through the Breakeven analysis and profit assumption after looking at both the
method, it has been recommended to the organization that they need to make the production change
as it will help them in seeing better result. This recommendation is passed on the basis of future
profit which company will be seeing as data shows that company will be seeing the profit of 17000,
277000, 537000 and 796999 by selling 50000, 100000, 150000 and 200000 units respectively. At
the same time if company will be making the change in machinery and production method than
profit will be 14000, 339000, 664000 and 989000 respectively. Hence, making changes in
production method will be good for the company in the long run of its operation.
CONCLUSION
In the end it is concluded that analysing financial statement is very essential for company in
managing performance of company. The major reason underlying this fact is that financial position
reveals the performance and profitability of company and company in taking decision relating to
betterment of operations of business. with the help of the study it was analysed that ratio calculation
is very essential for company to analyse its position and compare it with competitors. This assisted
company in analysing its position and reach to the position of company in competitive market.
Further these ratios assisted in analysing liquidity and solvency of company and along with this
decomposition of profitability was carried on. In the end DuPont decomposition of return on equity
was also made and was compared with other competitors.

⊘ This is a preview!⊘
Do you want full access?
Subscribe today to unlock all pages.
Trusted by 1+ million students worldwide

Paraphrase This Document
Need a fresh take? Get an instant paraphrase of this document with our AI Paraphraser
APPENDIX
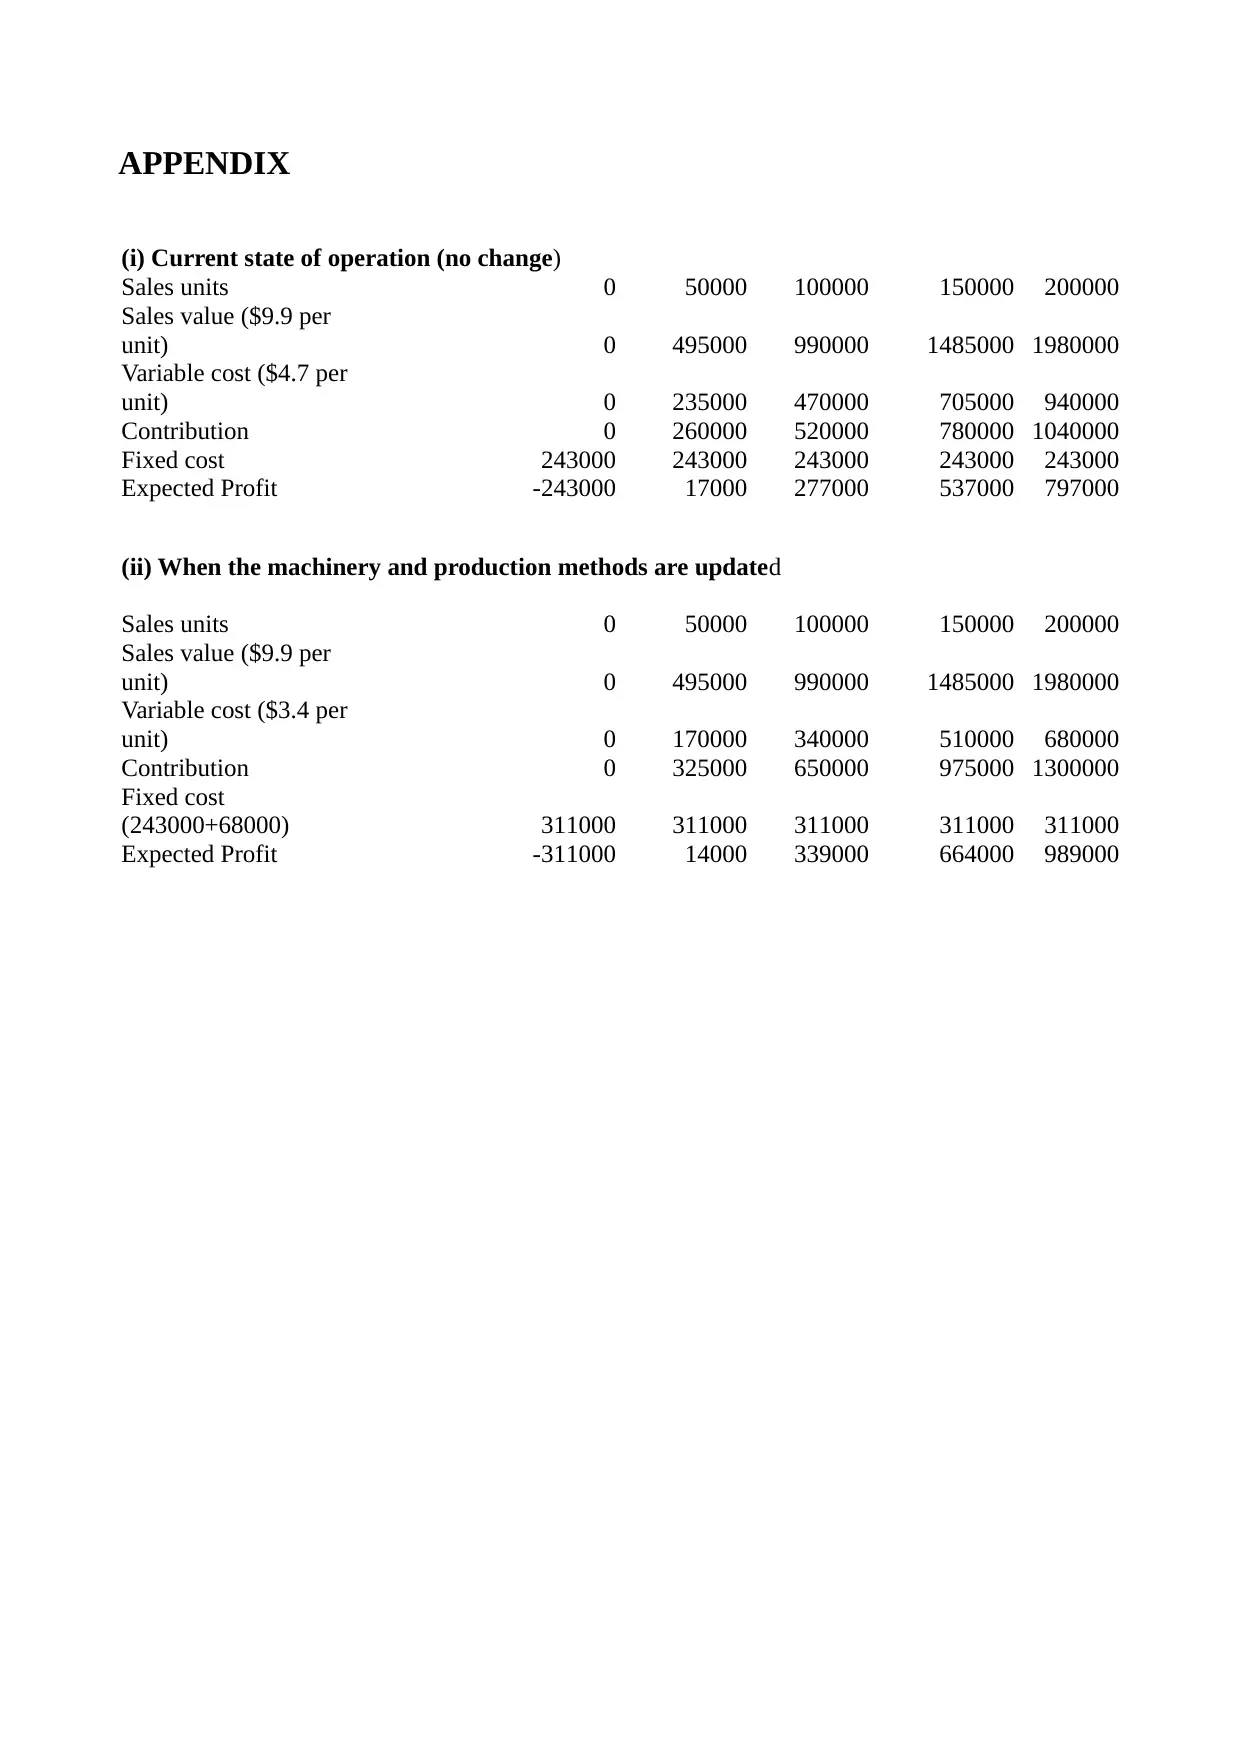
(i) Current state of operation (no change)
Sales units 0 50000 100000 150000 200000
Sales value ($9.9 per
unit) 0 495000 990000 1485000 1980000
Variable cost ($4.7 per
unit) 0 235000 470000 705000 940000
Contribution 0 260000 520000 780000 1040000
Fixed cost 243000 243000 243000 243000 243000
Expected Profit -243000 17000 277000 537000 797000
(ii) When the machinery and production methods are updated
Sales units 0 50000 100000 150000 200000
Sales value ($9.9 per
unit) 0 495000 990000 1485000 1980000
Variable cost ($3.4 per
unit) 0 170000 340000 510000 680000
Contribution 0 325000 650000 975000 1300000
Fixed cost
(243000+68000) 311000 311000 311000 311000 311000
Expected Profit -311000 14000 339000 664000 989000
1 out of 11