BMS7007 CW1 Lab Report: Investigating Diabetes Mellitus and GLP1
VerifiedAdded on 2023/04/04
|17
|3403
|166
Report
AI Summary
This lab report investigates the metabolic disorder Diabetes Mellitus, focusing on the role of Glucagon-Like Peptide-1 (GLP1) and its receptor (GLP1R). The report details experiments including cell culture, cell signaling assays (measuring cAMP response to adrenaline, propranolol, and forskolin), and toxicity assays (determining LC50 of compound 2). Ligand docking studies were conducted using Galaxy 7TM software to analyze the binding of compound 2 with the GLP1 receptor. The results include dose-response curves and EC50 values for various compounds, along with statistical analysis (T-tests) to assess the significance of the findings. The report also provides a comprehensive overview of the materials and methods used, including molecular biology techniques. The overall aim is to understand the potential of GLP1R as a drug target for treating type 2 diabetes.

CW1
LAB REPORT
LAB REPORT
Paraphrase This Document
Need a fresh take? Get an instant paraphrase of this document with our AI Paraphraser
1. INTRODUCTION
DIABETES MELLITUS GLP1 AND ITS RELEVENCE TO DISEASE
Diabetes Mellitus is a metabolic disorder resulting from a defect in insulin
secretion, insulin action, or both. Lack of insulin causes chronic hyperglycemia
and abnormalities in the metabolism of proteins, fats, and carbohydrates (Bastaki
S., 2005). The significance of insulin as an anabolic hormone leads to metabolic
abnormalities in carbohydrates, lipids, and proteins. These metabolic abnormalities
are brought on by insufficient insulin levels to produce an adequate response
and/or insulin resistance of target tissues, primarily skeletal muscles, adipose
tissue, and to a lesser extent, liver, at the level of insulin receptors, signal
transduction system, and/or effect or enzymes or genes (Kharroubi & Darwish,
2015). Diabetes Mellitus are categorized into two types are Type 1 and type 2. To
prolong life and treat symptoms, medications are generally employed. The
prevention of long-term diabetic problems and the improvement of longevity
through the elimination of various risk factors are secondary goals (Bastaki S.,
2005). Insulin replacement therapy is typically necessary for type I diabetes, which
is caused by the immunologically mediated destruction of the pancreatic beta cells.
Type II diabetes seems to be brought on by both changes in insulin sensitivity and
insulin secretion. Although it rarely needs exogenous insulin, it can be managed
with food therapy or oral hypoglycemic medications (Flier et al., 1987).
A clinically validated drug target for type 2 diabetes and obesity is the glucagon-
like peptide-1 receptor (GLP-1R) (Cong et al., 2021). GLP1 has several actions. In
addition to an increase in insulin production, the glucokinase enzyme, and glucose
transporters, functional effects in the pancreas include the glucose-dependent
release of insulin. The two main drawbacks of GLP-1 are its relatively
narrow therapeutic window, where nausea acts as the dose-limiting factor, and
have very short half-life for native peptide. The GLP-1 receptor is a part of the G
protein-coupled receptors' glucagon-secretin B family (GPCRs) (Knudsen et al.,
2007). The most well-known impact of GLP-1R activation is increased cAMP
synthesis, which, together with cell membrane depolarization (Koole et al., 2015).
Drugs used to treat diabetes mellitus are being developed with the GLP1 receptor
in consideration as a potential target.
When diet, exercise, weight loss, and oral medicines are unable to regulate blood
glucose levels in type 2 DM, insulin becomes important. Type 2 DM can also be
treated with oral hypoglycemic medications. Sulphonylureas, biguanides, alpha
glucosidase inhibitors, analogues of meglitinide, and thiazolidenediones are
examples of oral hypoglycemic medications. The primary goal of these
medications is to treat the underlying metabolic problem, such as insulin resistance
and insufficient insulin production. They ought to be prescribed along with dietary
modifications and lifestyle adjustments that are appropriate. Dietary and lifestyle
modifications are intended to lower body weight, improve glycemic control, and
lower the risk of cardiovascular problems (Bastaki S., 2005).
2. MATERIALS AND METHODS
a). Cell culture:
Cell culture is the most widely used laboratory approach.. Cell culture was done in
an aseptic condition using a cell culture hood. Spray 70% ethanol on each item put
within the cell culture hood, then rinse it off. Before adding trypsin, the entire
medium has to be removed from the flask. The cells were treated with trypsin for 3
to 5 minutes, and then centrifuged at 1200 rpm for 5 minutes. The mixture was
then transferred to a hemocytometer for cell counting after 20 ml of trypan blue
and cell suspension were added. An inverted microscope was used to count the
number of viable cells.
b). Cell signaling assay:
A membrane protein known as adenylcyclase works as an enzyme. It turns ATP
into cAMP. After conducting cell treatment, the samples were diluted, and the
LANCE-cAMP kit was used to measure the intracellular cAMP level. The LANCE
cAMP test is a homogeneous time-resolved fluorescence resonance energy transfer
immunoassay designed to measure cAMP generated upon stimulation of adenyl
cyclase activity by GPCRs.
The media was removed from the cell plates, the stimulating buffer was added, and
the cells were then allowed to incubate for 30 minutes. In this assay, the drugs
adrenaline, adrenaline+ propranolol, and froskolin were used. For these drugs,
⊘ This is a preview!⊘
Do you want full access?
Subscribe today to unlock all pages.

Trusted by 1+ million students worldwide
serial dilutions were created. Using a multichannel pipette to activate the cells, the
medicines were added to cell plates and incubated at 37°C for 30 minutes. The
media was discarded, put on ice for 10 minutes, and then 5ul of lysate was added.
U light cAMP antibody was used to prepare the assay plate. The lysate was then
put to the assay plate and wrapped with aluminum foil. To measure signalling, a
fluorimeter was used.
c). Toxicity assay:
The materials used for the toxicity assay included Compound 2, 48-well cell
culture plates, Trypan blue, hemocytometer, cell culture media, Eppendorfs, and
pipettes. Liver cells were added in a 24 well plates containing 5000 cells. A series
of dilutions were prepared for Compound X from 10-3 to 10-10. 600μl of cell culture
media was added to each well of the 24-well plate containing liver cells.60μl
compound X added to triplicates at each concentration and incubated the cells for 1
hour at 37 . In the same way positive and negative controls were used.℃
After incubation, the cells were transferred to eppendorf tubes. Samples were
collected into the corresponding eppendorf tube after trypsin was applied to the
wells to loosen adherent cells. Then the eppendorf tube was centrifuged at
1600rpm for 5 minutes, the supernatant was collected, and the cell pellets were
then resuspended in 100μl of cell media. After that, cells were collected and mixed
with trypan blue in a 1:1 ratio before being loaded in 20μl into haemotocytometer
for cell counting. Then Total number of cell was counted.
The total number of cells was calculated by
Cells/ml = average count per square*dilution factor*104
Total cells =cell/ml*total volume of cells
To determine the drug toxicity, EC50 and LC50 can be calculated and dose
response curve was plotted.
Paraphrase This Document
Need a fresh take? Get an instant paraphrase of this document with our AI Paraphraser
e). Molecular biology:
Molecular biology includes the study of site directed mutagenesis, Transformation,
Transfection, Plasmid purification. For details refer week 9 7007BMS.
d).Ligand docking:
The ligand docking of compound 2 with GLP1 receptor in the allosteric binding
site was done with the help of Galaxy 7TM software.
3. RESULTS
3 a). Cell signaling assay
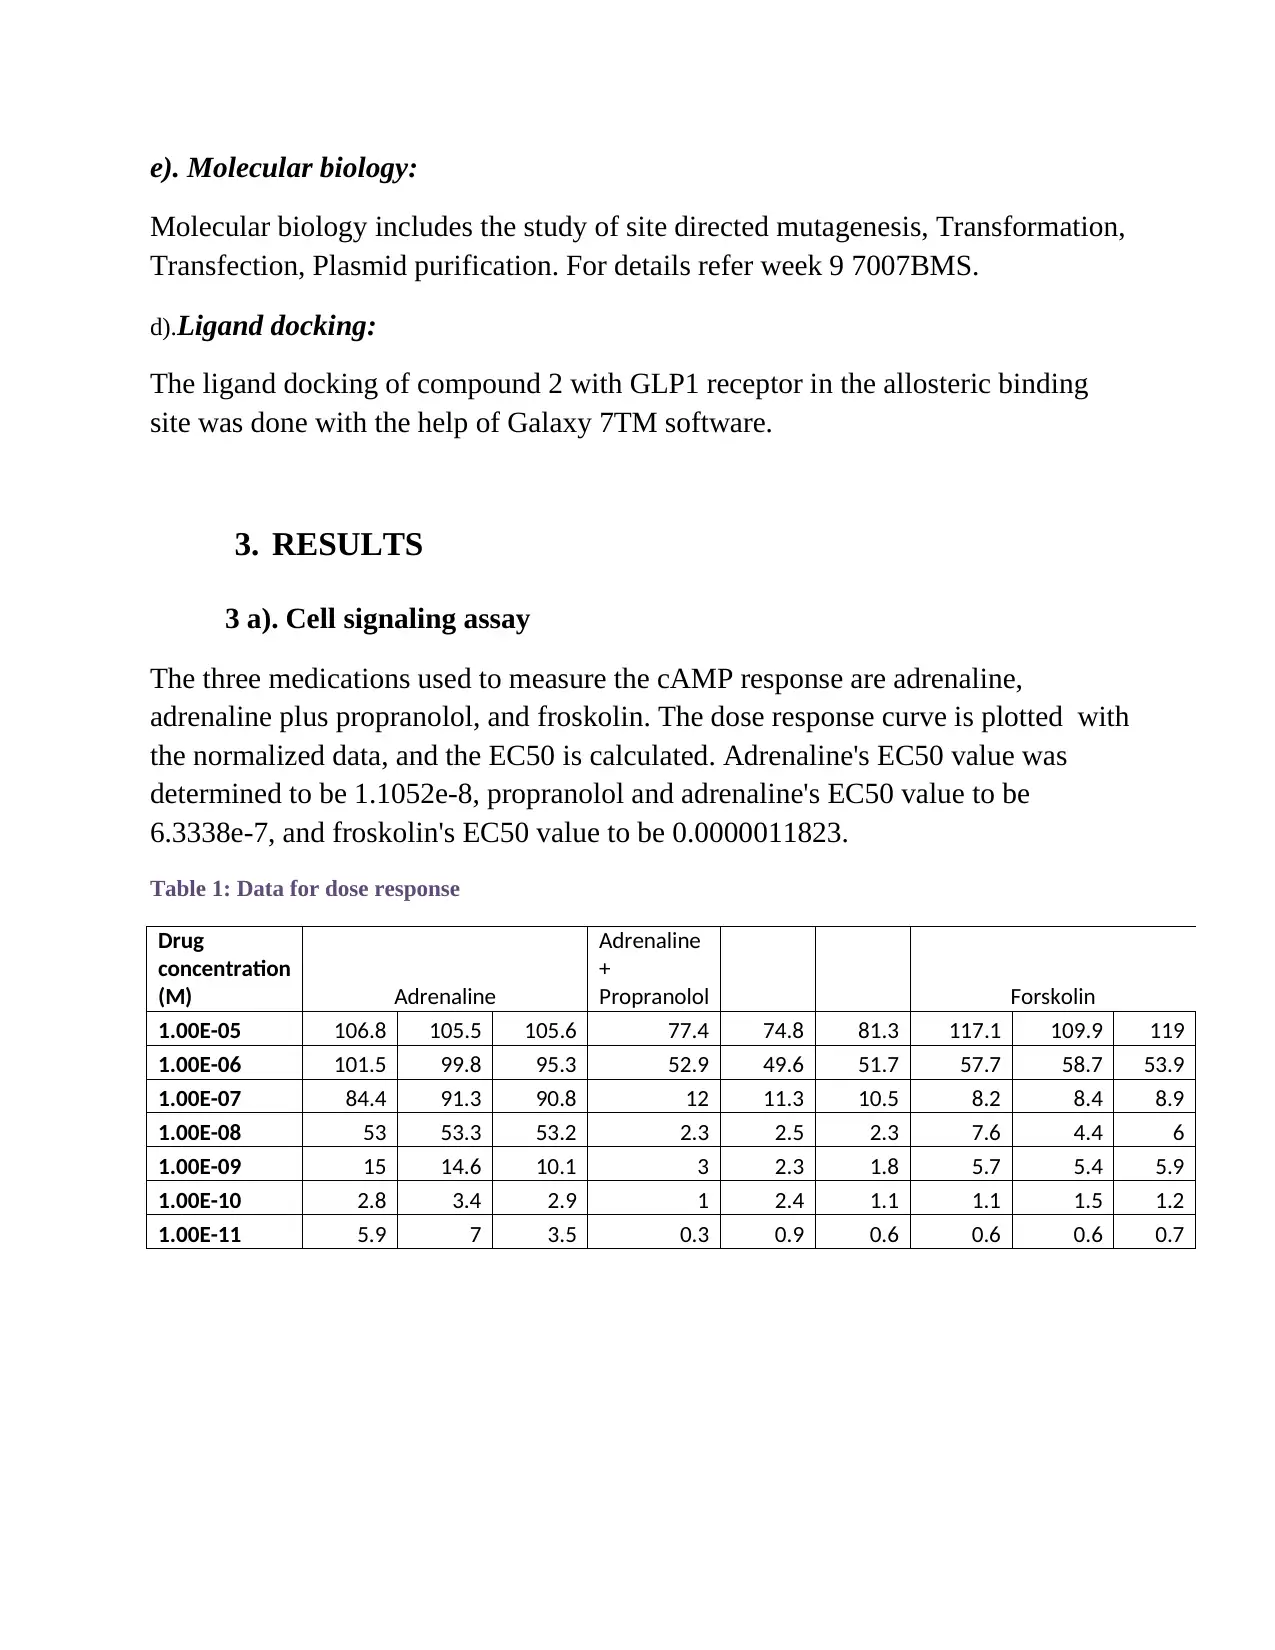
The three medications used to measure the cAMP response are adrenaline,
adrenaline plus propranolol, and froskolin. The dose response curve is plotted with
the normalized data, and the EC50 is calculated. Adrenaline's EC50 value was
determined to be 1.1052e-8, propranolol and adrenaline's EC50 value to be
6.3338e-7, and froskolin's EC50 value to be 0.0000011823.
Table 1: Data for dose response
Drug
concentration
(M) Adrenaline
Adrenaline
+
Propranolol Forskolin
1.00E-05 106.8 105.5 105.6 77.4 74.8 81.3 117.1 109.9 119
1.00E-06 101.5 99.8 95.3 52.9 49.6 51.7 57.7 58.7 53.9
1.00E-07 84.4 91.3 90.8 12 11.3 10.5 8.2 8.4 8.9
1.00E-08 53 53.3 53.2 2.3 2.5 2.3 7.6 4.4 6
1.00E-09 15 14.6 10.1 3 2.3 1.8 5.7 5.4 5.9
1.00E-10 2.8 3.4 2.9 1 2.4 1.1 1.1 1.5 1.2
1.00E-11 5.9 7 3.5 0.3 0.9 0.6 0.6 0.6 0.7
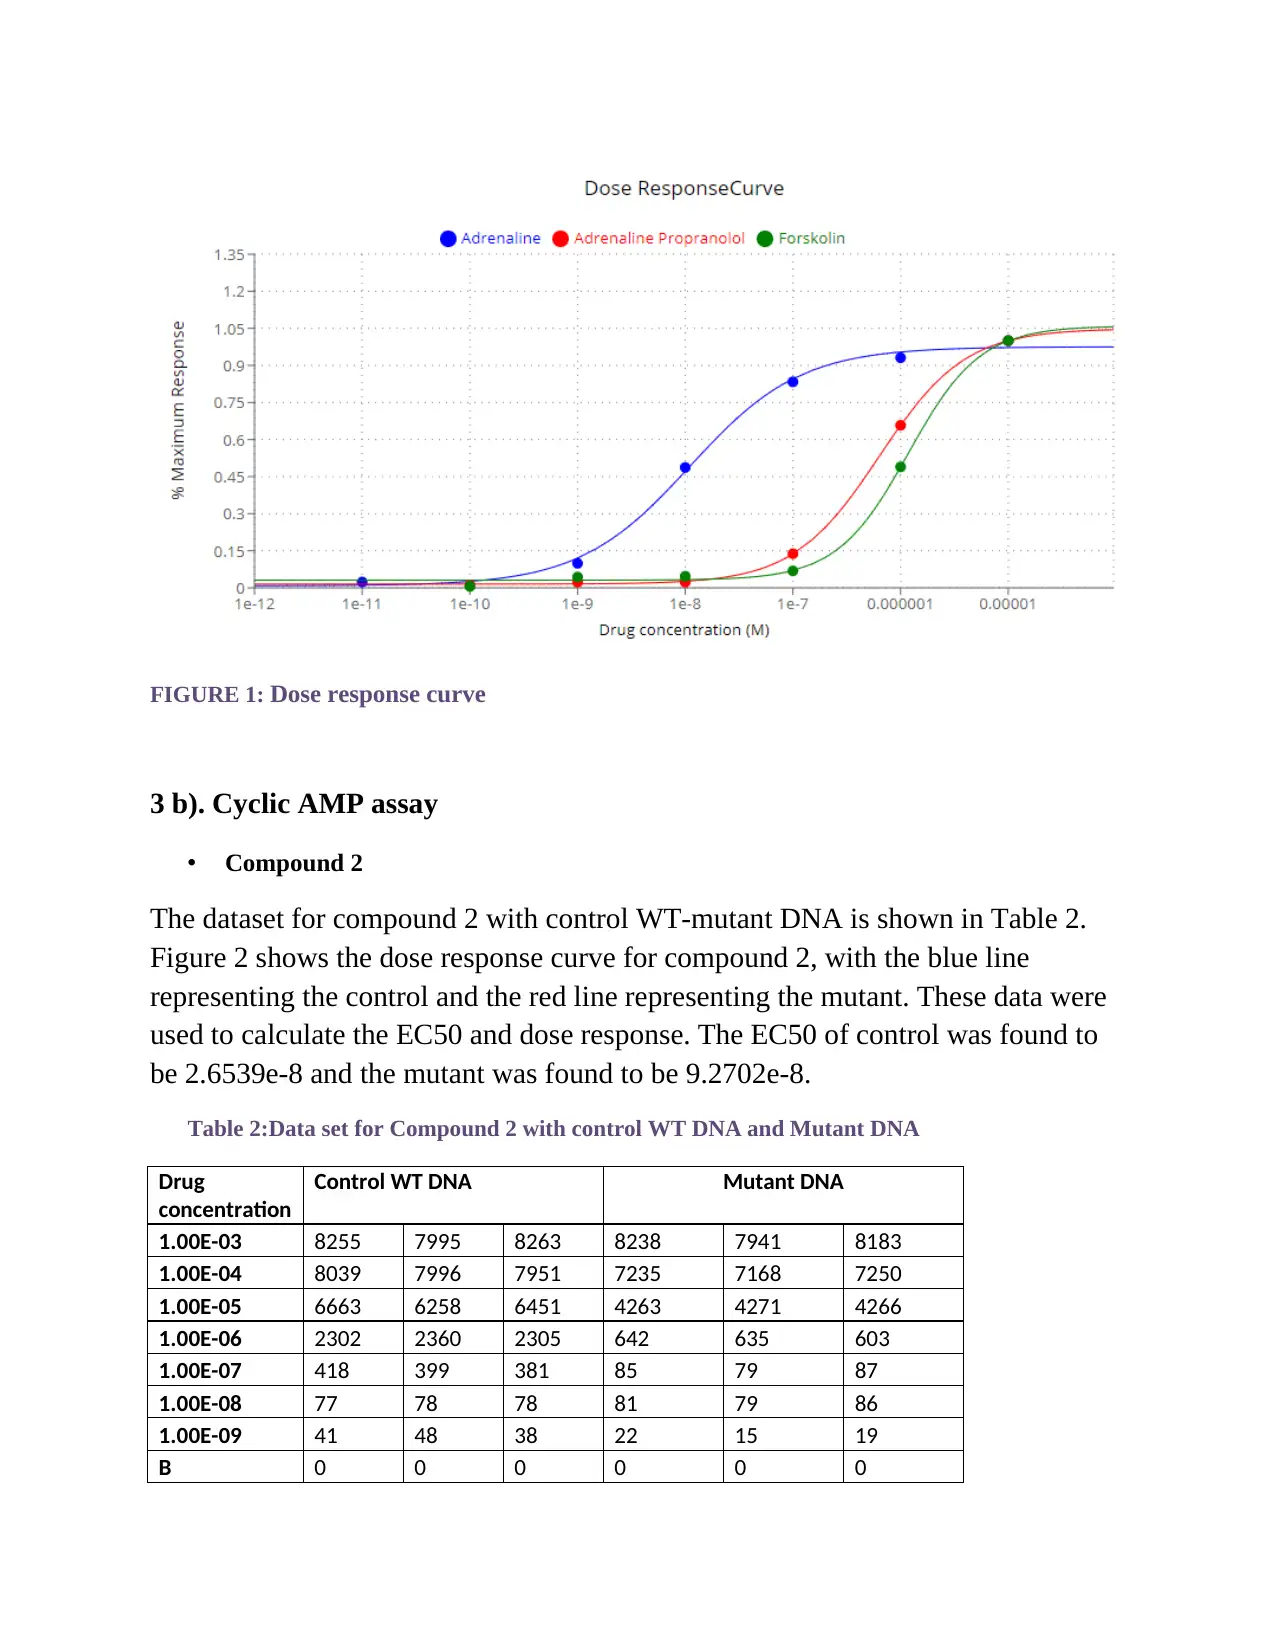
FIGURE 1: Dose response curve
3 b). Cyclic AMP assay
• Compound 2
The dataset for compound 2 with control WT-mutant DNA is shown in Table 2.
Figure 2 shows the dose response curve for compound 2, with the blue line
representing the control and the red line representing the mutant. These data were
used to calculate the EC50 and dose response. The EC50 of control was found to
be 2.6539e-8 and the mutant was found to be 9.2702e-8.
Table 2:Data set for Compound 2 with control WT DNA and Mutant DNA
Drug
concentration
Control WT DNA Mutant DNA
1.00E-03 8255 7995 8263 8238 7941 8183
1.00E-04 8039 7996 7951 7235 7168 7250
1.00E-05 6663 6258 6451 4263 4271 4266
1.00E-06 2302 2360 2305 642 635 603
1.00E-07 418 399 381 85 79 87
1.00E-08 77 78 78 81 79 86
1.00E-09 41 48 38 22 15 19
B 0 0 0 0 0 0
⊘ This is a preview!⊘
Do you want full access?
Subscribe today to unlock all pages.

Trusted by 1+ million students worldwide
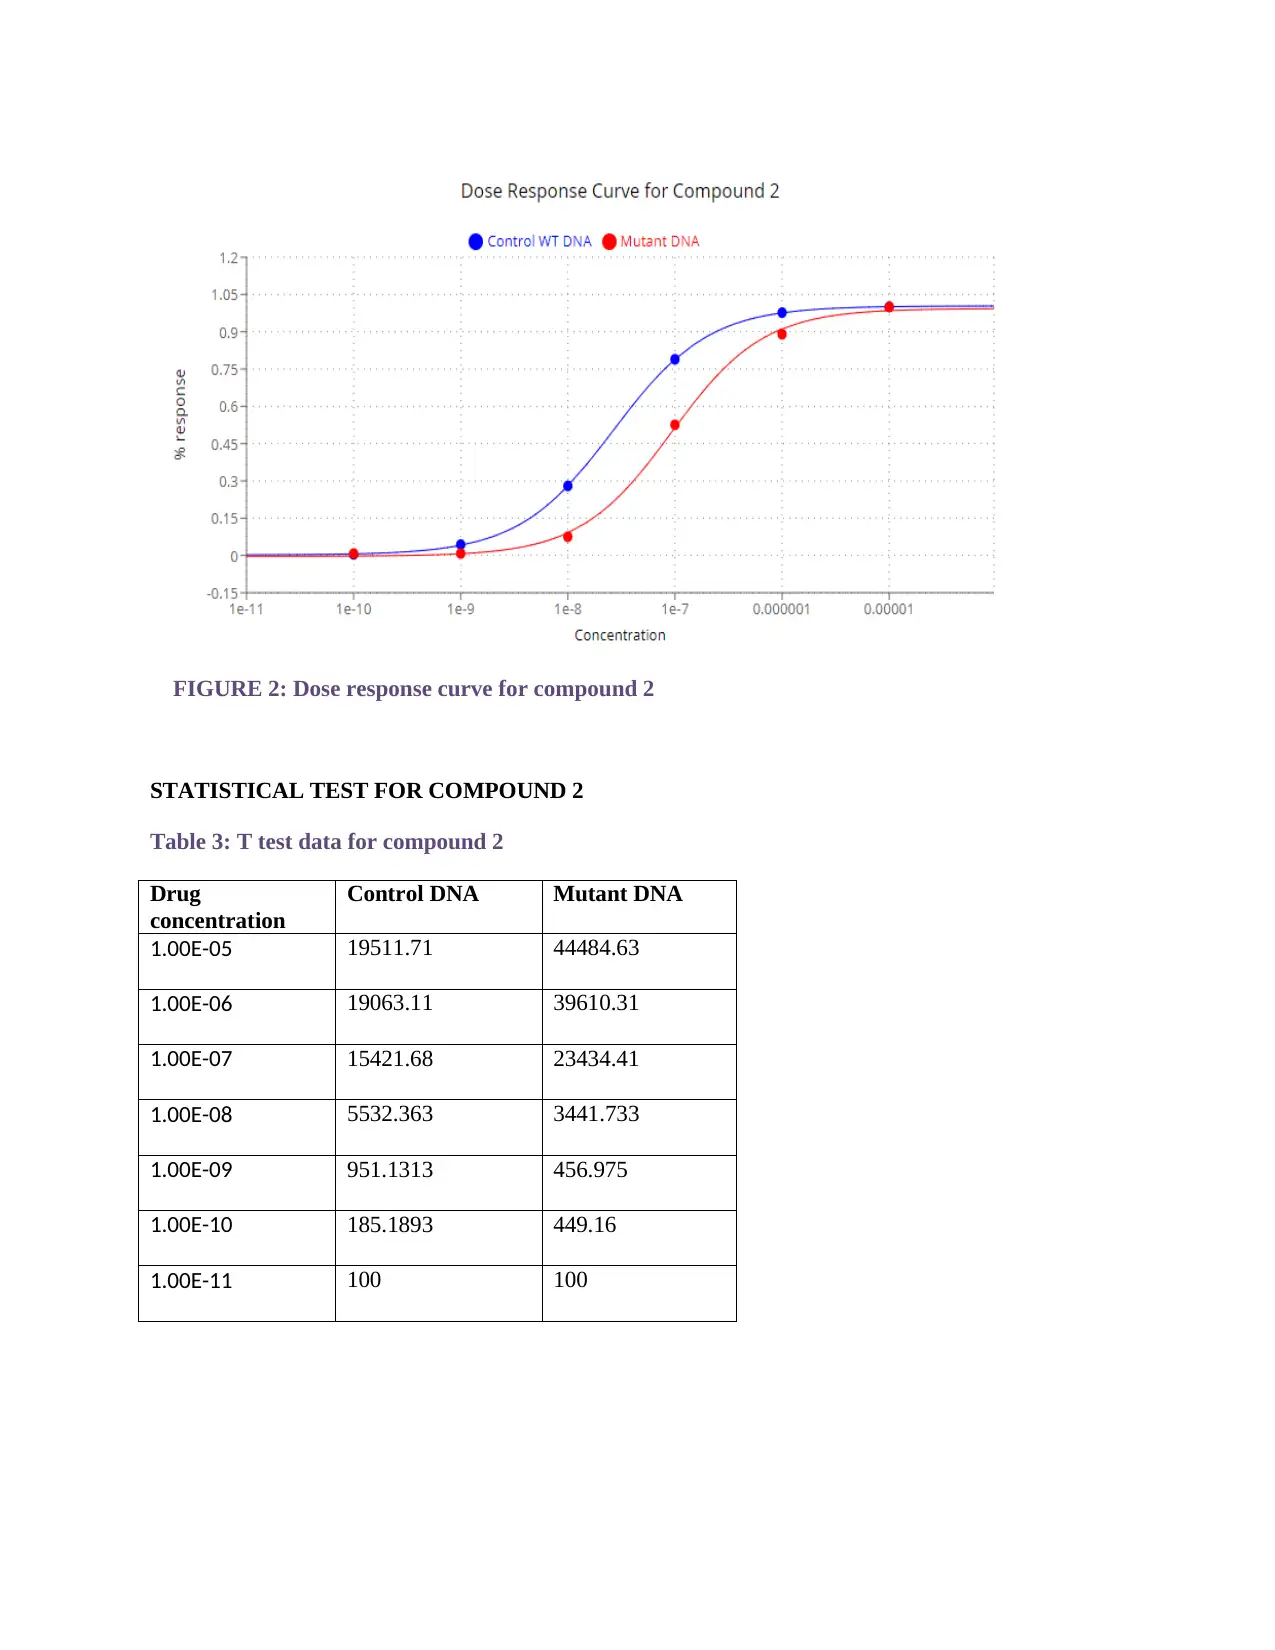
FIGURE 2: Dose response curve for compound 2
STATISTICAL TEST FOR COMPOUND 2
Table 3: T test data for compound 2
Drug
concentration
Control DNA Mutant DNA
1.00E-05 19511.71 44484.63
1.00E-06 19063.11 39610.31
1.00E-07 15421.68 23434.41
1.00E-08 5532.363 3441.733
1.00E-09 951.1313 456.975
1.00E-10 185.1893 449.16
1.00E-11 100 100
STATISTICAL TEST FOR COMPOUND 2
Table 3: T test data for compound 2
Drug
concentration
Control DNA Mutant DNA
1.00E-05 19511.71 44484.63
1.00E-06 19063.11 39610.31
1.00E-07 15421.68 23434.41
1.00E-08 5532.363 3441.733
1.00E-09 951.1313 456.975
1.00E-10 185.1893 449.16
1.00E-11 100 100
Paraphrase This Document
Need a fresh take? Get an instant paraphrase of this document with our AI Paraphraser
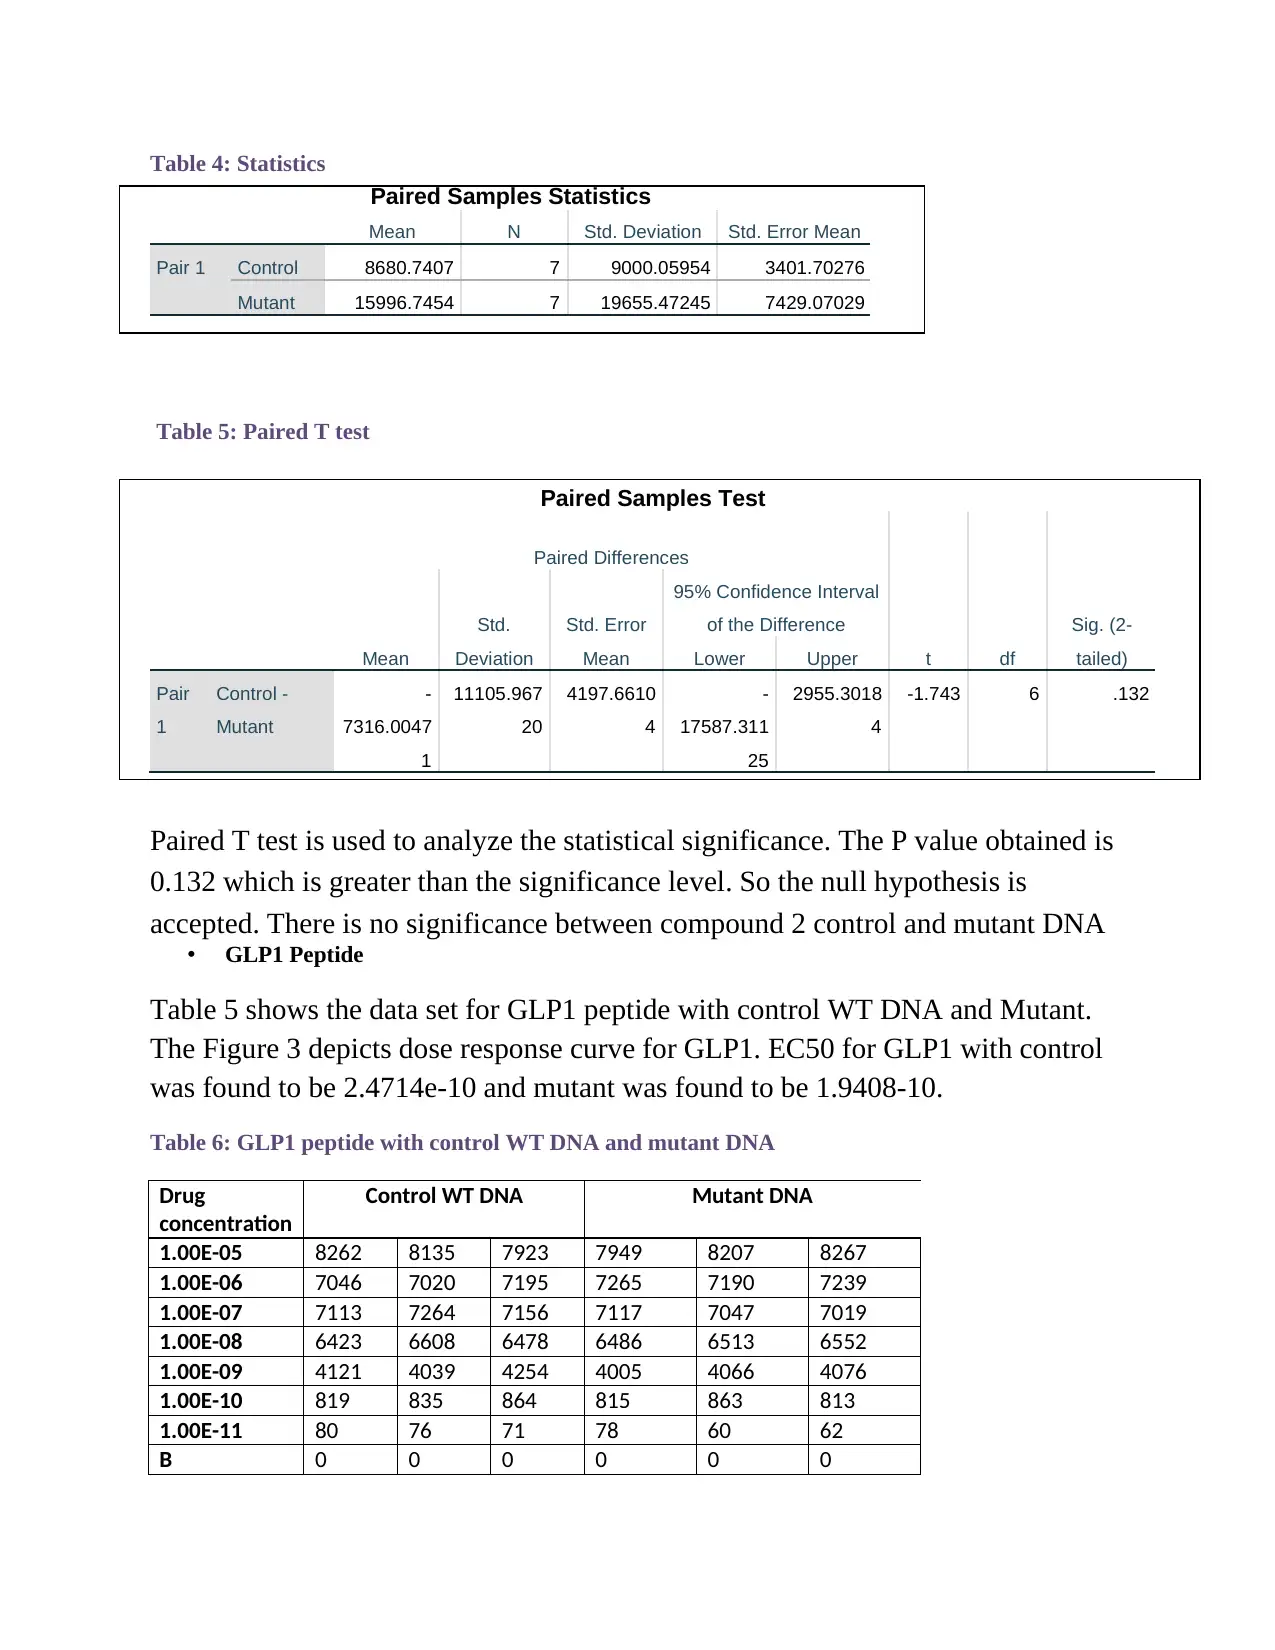
Table 4: Statistics
Paired Samples Statistics
Mean N Std. Deviation Std. Error Mean
Pair 1 Control 8680.7407 7 9000.05954 3401.70276
Mutant 15996.7454 7 19655.47245 7429.07029
Table 5: Paired T test
Paired Samples Test
Paired Differences
t df
Sig. (2-
tailed)Mean
Std.
Deviation
Std. Error
Mean
95% Confidence Interval
of the Difference
Lower Upper
Pair
1
Control -
Mutant
-
7316.0047
1
11105.967
20
4197.6610
4
-
17587.311
25
2955.3018
4
-1.743 6 .132
Paired T test is used to analyze the statistical significance. The P value obtained is
0.132 which is greater than the significance level. So the null hypothesis is
accepted. There is no significance between compound 2 control and mutant DNA
• GLP1 Peptide
Table 5 shows the data set for GLP1 peptide with control WT DNA and Mutant.
The Figure 3 depicts dose response curve for GLP1. EC50 for GLP1 with control
was found to be 2.4714e-10 and mutant was found to be 1.9408-10.
Table 6: GLP1 peptide with control WT DNA and mutant DNA
Drug
concentration
Control WT DNA Mutant DNA
1.00E-05 8262 8135 7923 7949 8207 8267
1.00E-06 7046 7020 7195 7265 7190 7239
1.00E-07 7113 7264 7156 7117 7047 7019
1.00E-08 6423 6608 6478 6486 6513 6552
1.00E-09 4121 4039 4254 4005 4066 4076
1.00E-10 819 835 864 815 863 813
1.00E-11 80 76 71 78 60 62
B 0 0 0 0 0 0
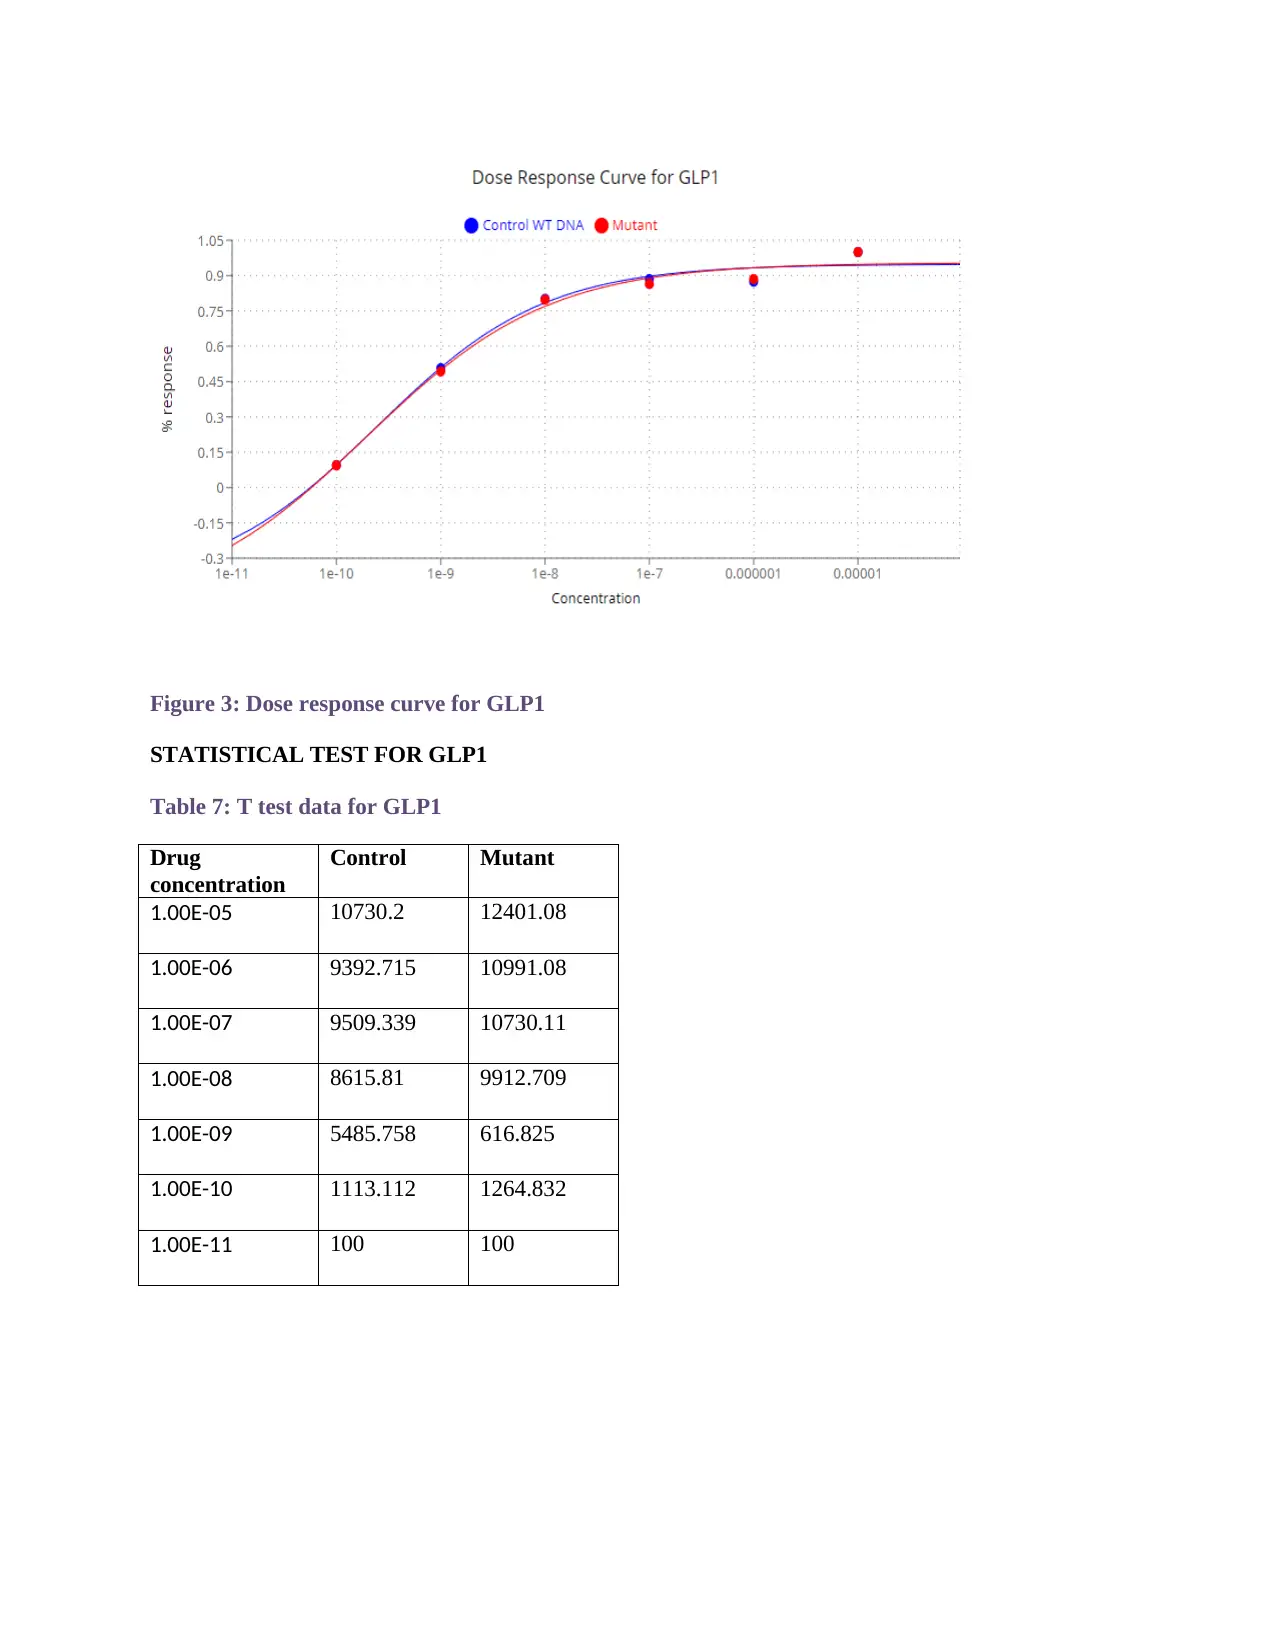
Figure 3: Dose response curve for GLP1
STATISTICAL TEST FOR GLP1
Table 7: T test data for GLP1
Drug
concentration
Control Mutant
1.00E-05 10730.2 12401.08
1.00E-06 9392.715 10991.08
1.00E-07 9509.339 10730.11
1.00E-08 8615.81 9912.709
1.00E-09 5485.758 616.825
1.00E-10 1113.112 1264.832
1.00E-11 100 100
STATISTICAL TEST FOR GLP1
Table 7: T test data for GLP1
Drug
concentration
Control Mutant
1.00E-05 10730.2 12401.08
1.00E-06 9392.715 10991.08
1.00E-07 9509.339 10730.11
1.00E-08 8615.81 9912.709
1.00E-09 5485.758 616.825
1.00E-10 1113.112 1264.832
1.00E-11 100 100
⊘ This is a preview!⊘
Do you want full access?
Subscribe today to unlock all pages.

Trusted by 1+ million students worldwide
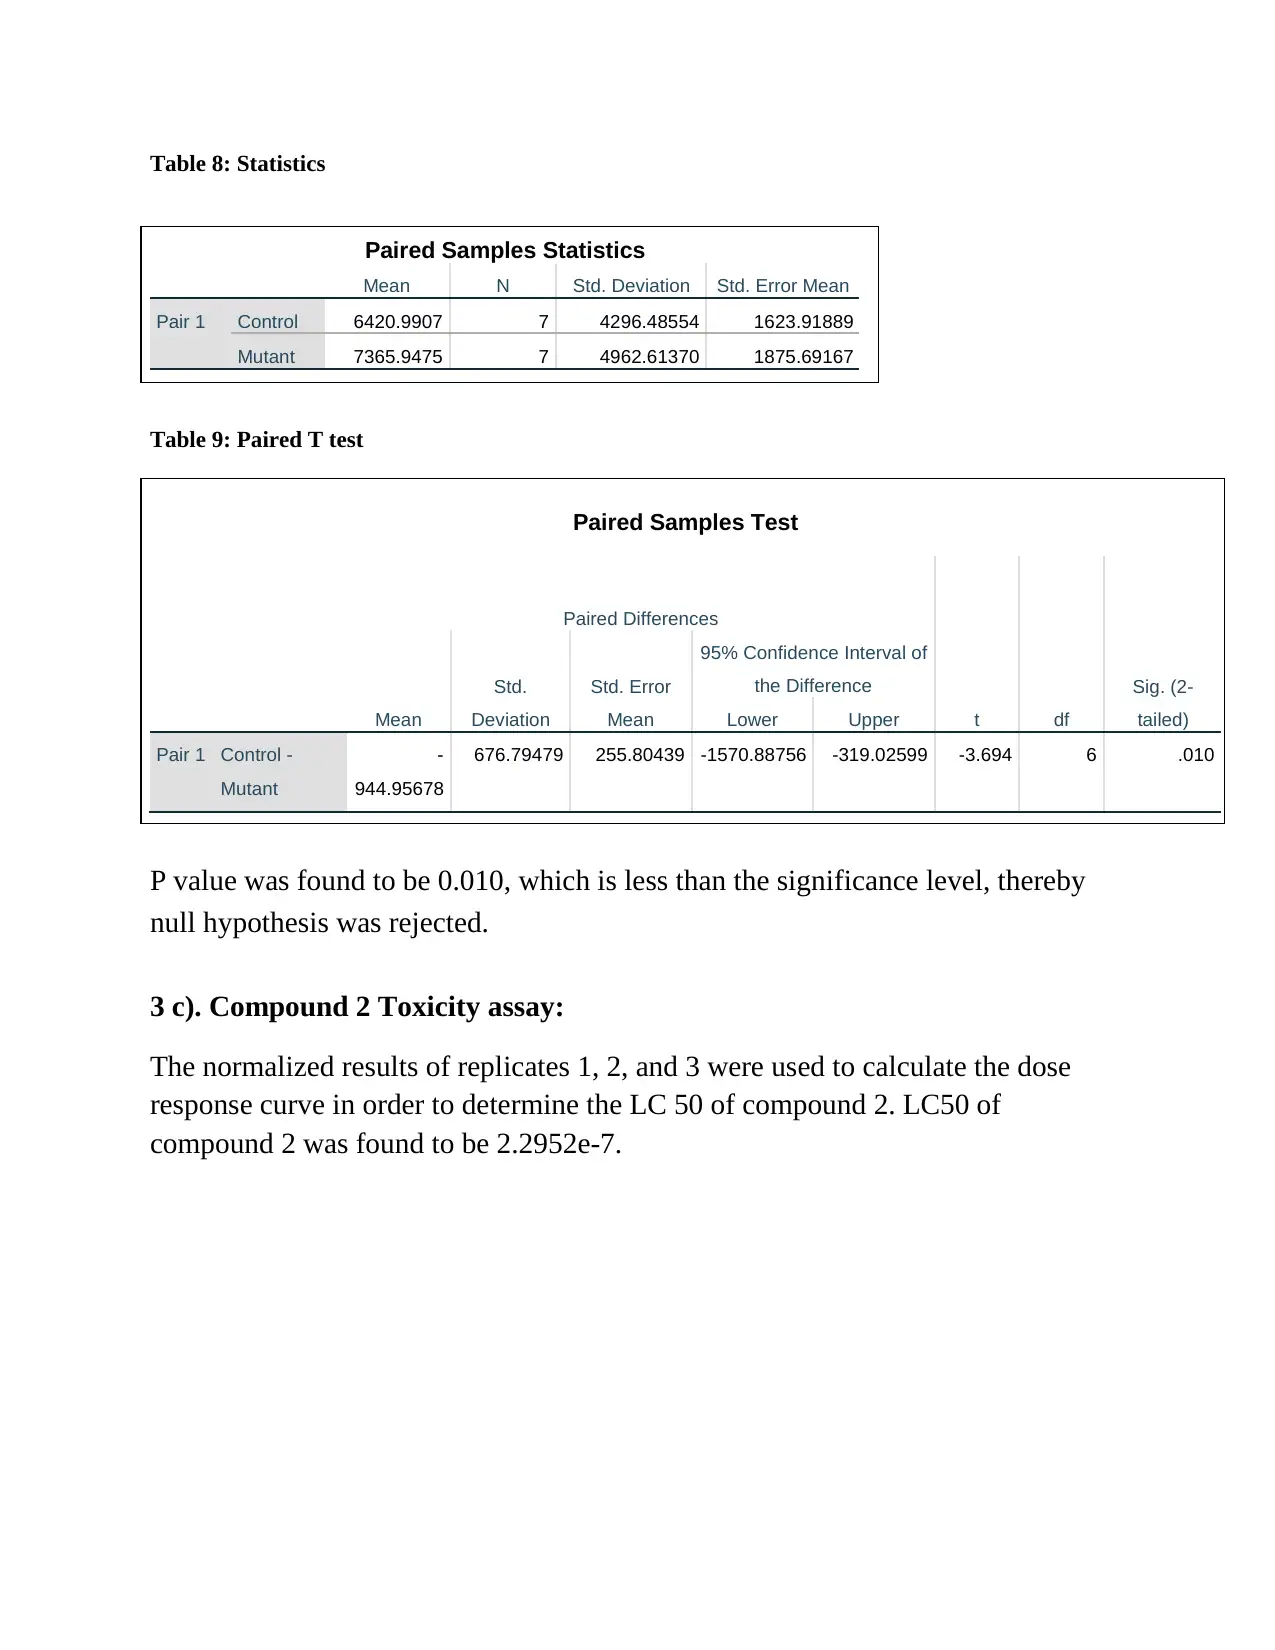
Table 8: Statistics
Paired Samples Statistics
Mean N Std. Deviation Std. Error Mean
Pair 1 Control 6420.9907 7 4296.48554 1623.91889
Mutant 7365.9475 7 4962.61370 1875.69167
Table 9: Paired T test
Paired Samples Test
Paired Differences
t df
Sig. (2-
tailed)Mean
Std.
Deviation
Std. Error
Mean
95% Confidence Interval of
the Difference
Lower Upper
Pair 1 Control -
Mutant
-
944.95678
676.79479 255.80439 -1570.88756 -319.02599 -3.694 6 .010
P value was found to be 0.010, which is less than the significance level, thereby
null hypothesis was rejected.
3 c). Compound 2 Toxicity assay:
The normalized results of replicates 1, 2, and 3 were used to calculate the dose
response curve in order to determine the LC 50 of compound 2. LC50 of
compound 2 was found to be 2.2952e-7.
Paraphrase This Document
Need a fresh take? Get an instant paraphrase of this document with our AI Paraphraser
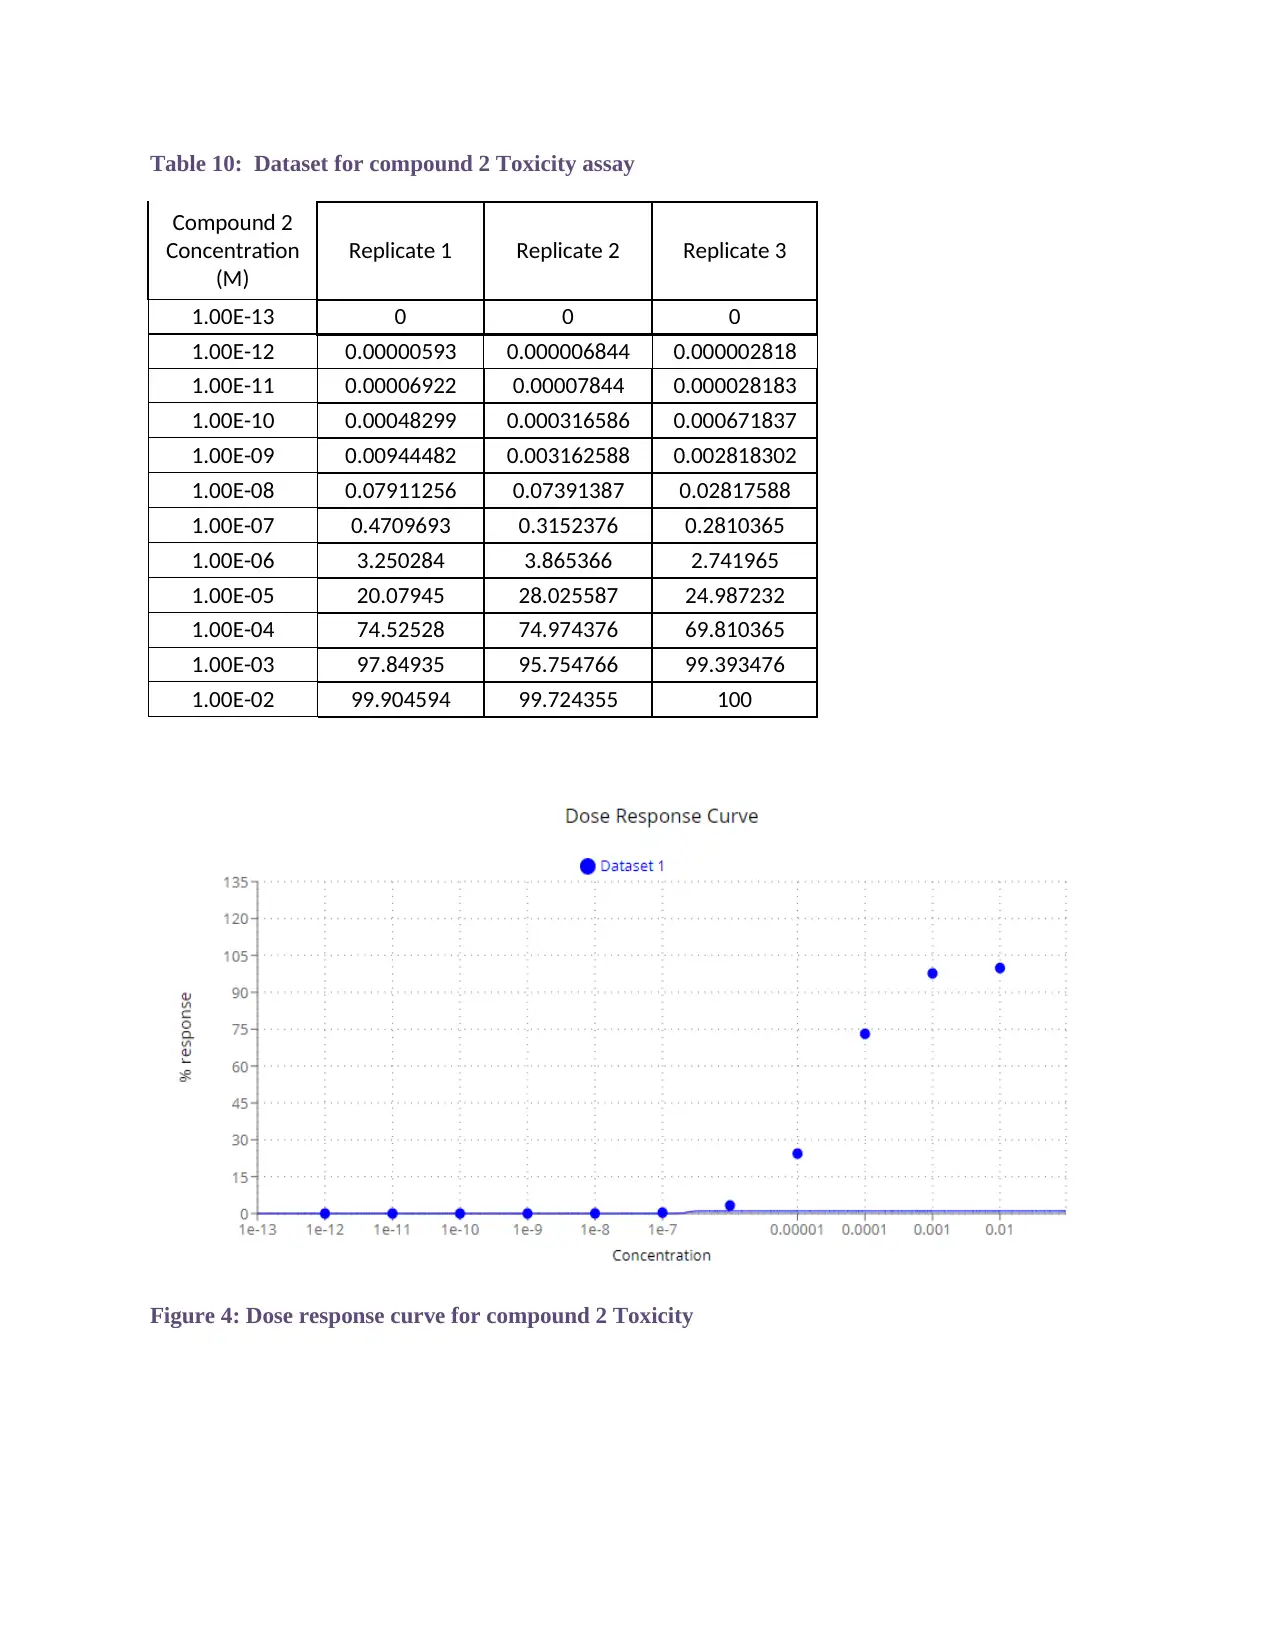
Table 10: Dataset for compound 2 Toxicity assay
Compound 2
Concentration
(M)
Replicate 1 Replicate 2 Replicate 3
1.00E-13 0 0 0
1.00E-12 0.00000593 0.000006844 0.000002818
1.00E-11 0.00006922 0.00007844 0.000028183
1.00E-10 0.00048299 0.000316586 0.000671837
1.00E-09 0.00944482 0.003162588 0.002818302
1.00E-08 0.07911256 0.07391387 0.02817588
1.00E-07 0.4709693 0.3152376 0.2810365
1.00E-06 3.250284 3.865366 2.741965
1.00E-05 20.07945 28.025587 24.987232
1.00E-04 74.52528 74.974376 69.810365
1.00E-03 97.84935 95.754766 99.393476
1.00E-02 99.904594 99.724355 100
Figure 4: Dose response curve for compound 2 Toxicity
4). Ligand docking:
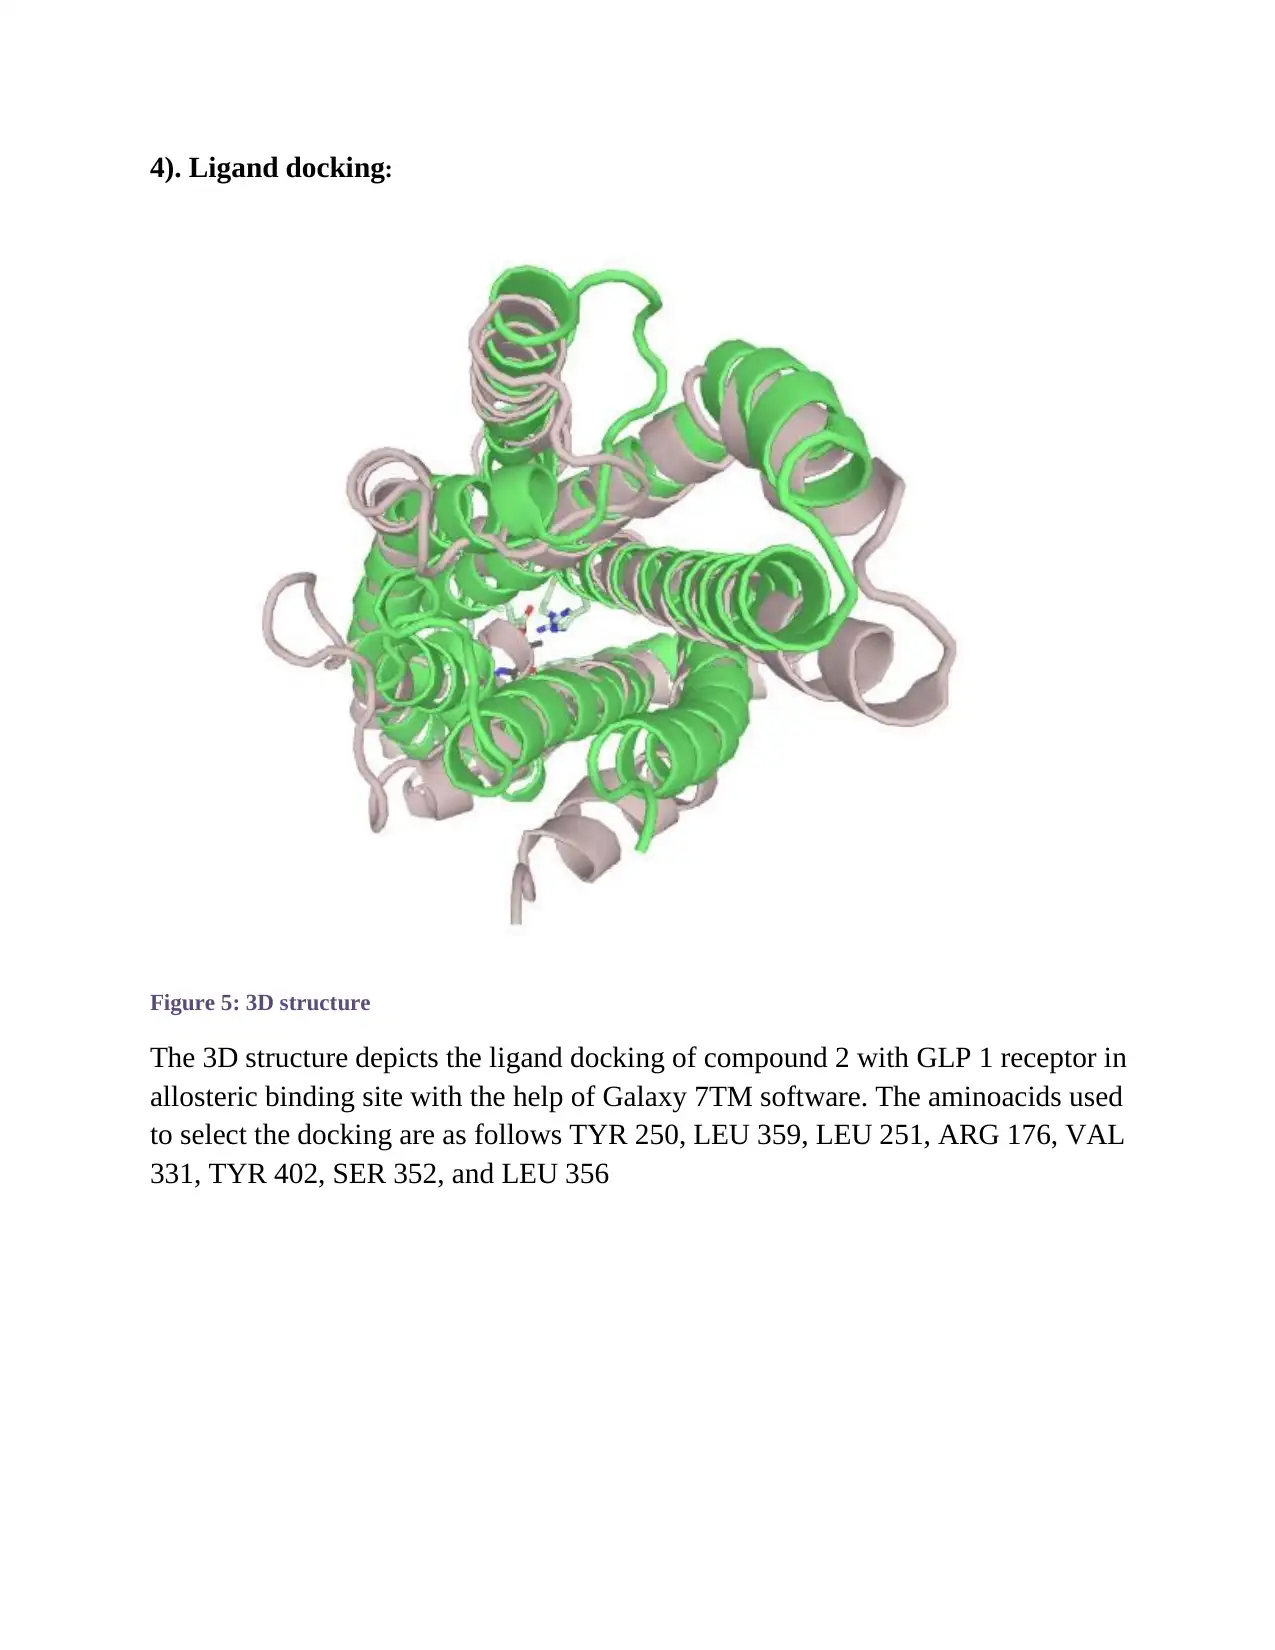
Figure 5: 3D structure
The 3D structure depicts the ligand docking of compound 2 with GLP 1 receptor in
allosteric binding site with the help of Galaxy 7TM software. The aminoacids used
to select the docking are as follows TYR 250, LEU 359, LEU 251, ARG 176, VAL
331, TYR 402, SER 352, and LEU 356
Figure 5: 3D structure
The 3D structure depicts the ligand docking of compound 2 with GLP 1 receptor in
allosteric binding site with the help of Galaxy 7TM software. The aminoacids used
to select the docking are as follows TYR 250, LEU 359, LEU 251, ARG 176, VAL
331, TYR 402, SER 352, and LEU 356
⊘ This is a preview!⊘
Do you want full access?
Subscribe today to unlock all pages.

Trusted by 1+ million students worldwide
1 out of 17
Related Documents
Your All-in-One AI-Powered Toolkit for Academic Success.
+13062052269
info@desklib.com
Available 24*7 on WhatsApp / Email
![[object Object]](/_next/static/media/star-bottom.7253800d.svg)
Unlock your academic potential
Copyright © 2020–2026 A2Z Services. All Rights Reserved. Developed and managed by ZUCOL.


