ENEM14015 CQU Lab Report: Dynamic System Modelling Analysis
VerifiedAdded on 2020/03/16
|18
|2750
|76
Report
AI Summary
This lab report, prepared for ENEM14015 at Central Queensland University, details experiments on damped free vibration. The report covers the theoretical background of damped free vibration, including concepts of rotational spring stiffness, mass moment of inertia, and damping. The experiments involved observing undamped and damped free vibrations using the GUNT Tm150 Free Vibration Equipment. The procedure included measuring system parameters, observing vibrations, and calculating the damping ratio using logarithmic decrements. The results section presents the initial measurements, spring stiffness test data, calculation results, and free vibration amplitude measurements. Data analysis involves plotting graphs to demonstrate damping, and the discussion section analyzes the effects of shaft diameter, length, and mass. Additional experiments on whirling of shafts, mass balance, and forced vibration with viscous damping are also briefly outlined, providing a comprehensive overview of dynamic system modelling concepts. Students can find more study resources on Desklib.

CENTRAL QUEENSLAND UNIVERSITY
AUSTRALIA
SCHOOL OF ENGINEERING AND TECHNOLOGY
HIGHER EDUCATION DIVISION
ENEM14015 LAB REPORT
LABWORK
DYNAMIC SYSTEM MODELLING
AUSTRALIA
SCHOOL OF ENGINEERING AND TECHNOLOGY
HIGHER EDUCATION DIVISION
ENEM14015 LAB REPORT
LABWORK
DYNAMIC SYSTEM MODELLING
Paraphrase This Document
Need a fresh take? Get an instant paraphrase of this document with our AI Paraphraser
LAB 1: DAMPED FREE VIBRATION
BASIC OVERVIEW
Lab Instructions
(i) Students must don personal protective equipment while accessing the laboratories
(ii) Requirements are such as closed footwear and long or short sleeve shirts.
Damped Free Vibration
The free vibration response of a system is useful in determining the resonance frequency
of a system and other characteristics of the system such as the damping constant. A free vibration
response is readily obtained from a vibrating system where the spring, mass, and damper
characteristics may be possibly unknown. The free vibration is present in both linear and
rotational vibrating systems and both use the same concepts. The lab experiment uses rotational
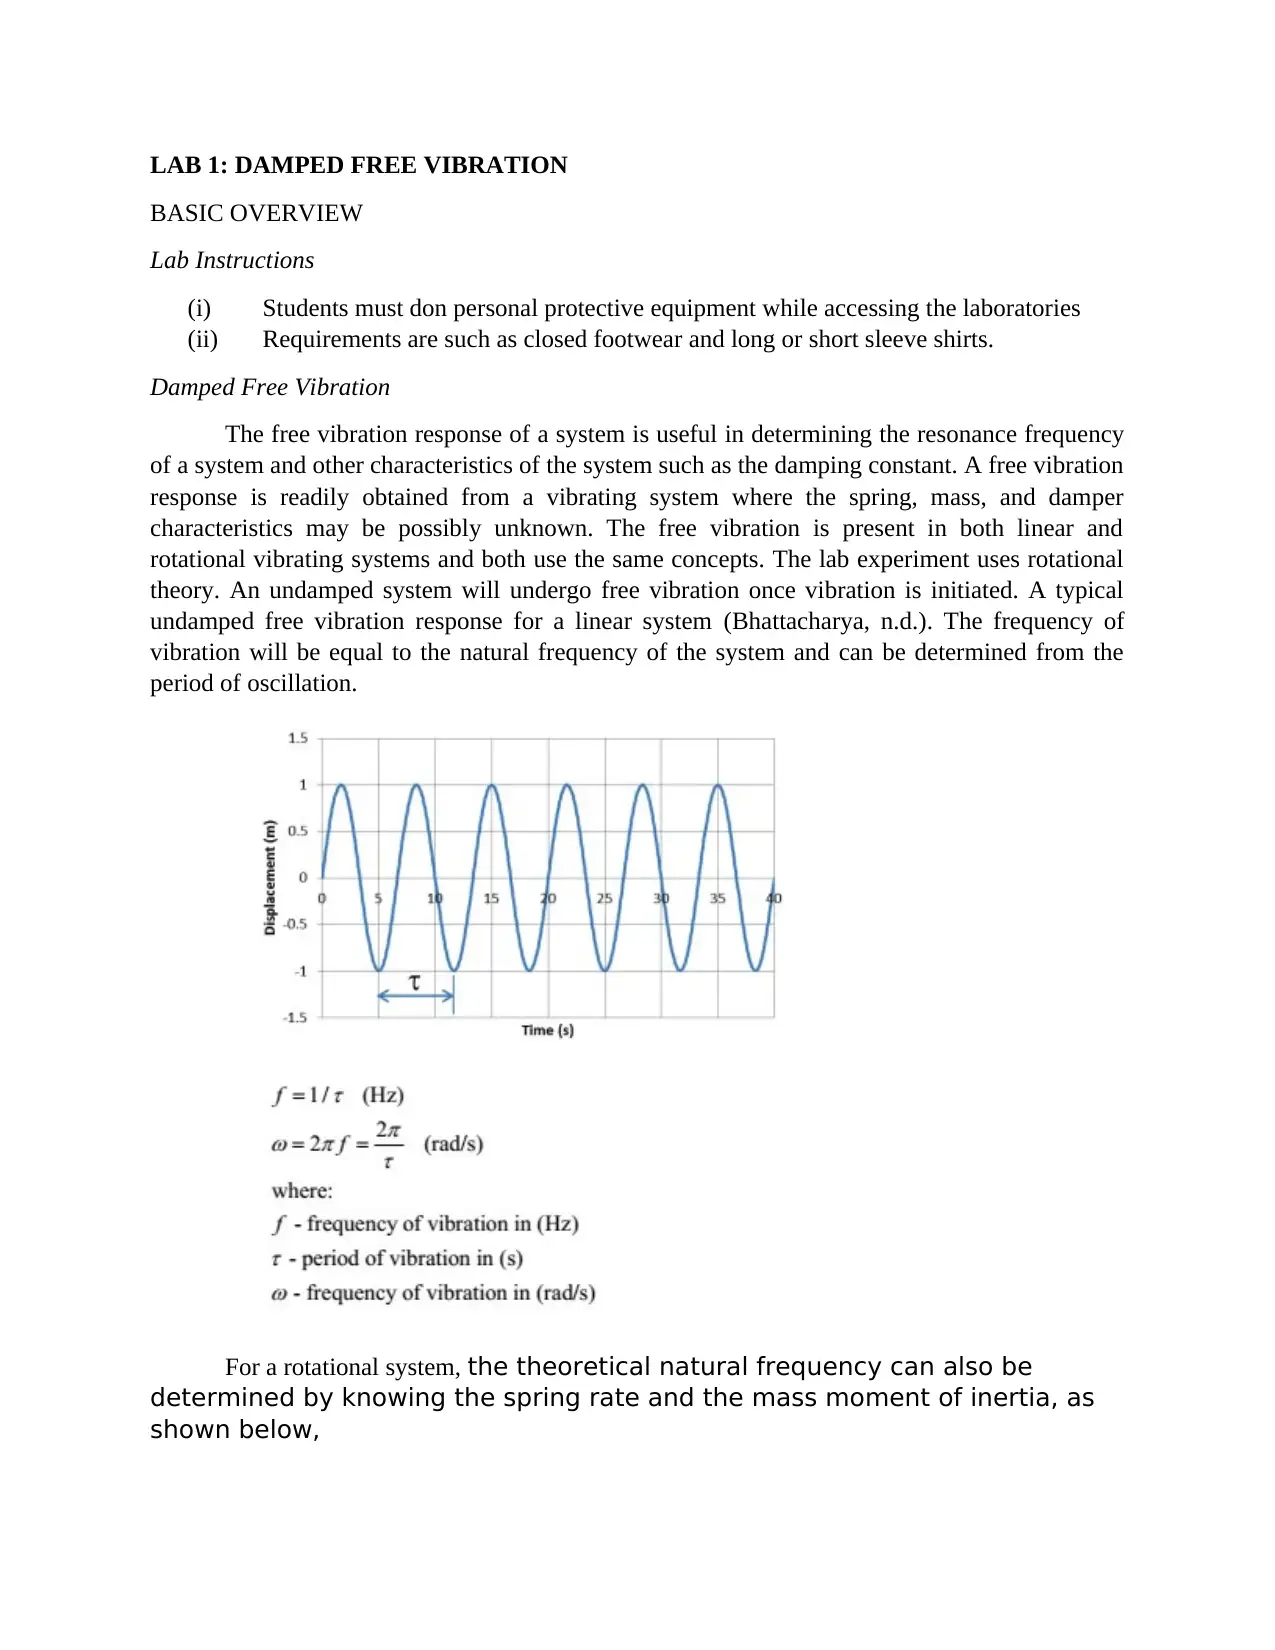
theory. An undamped system will undergo free vibration once vibration is initiated. A typical
undamped free vibration response for a linear system (Bhattacharya, n.d.). The frequency of
vibration will be equal to the natural frequency of the system and can be determined from the
period of oscillation.
For a rotational system, the theoretical natural frequency can also be
determined by knowing the spring rate and the mass moment of inertia, as
shown below,
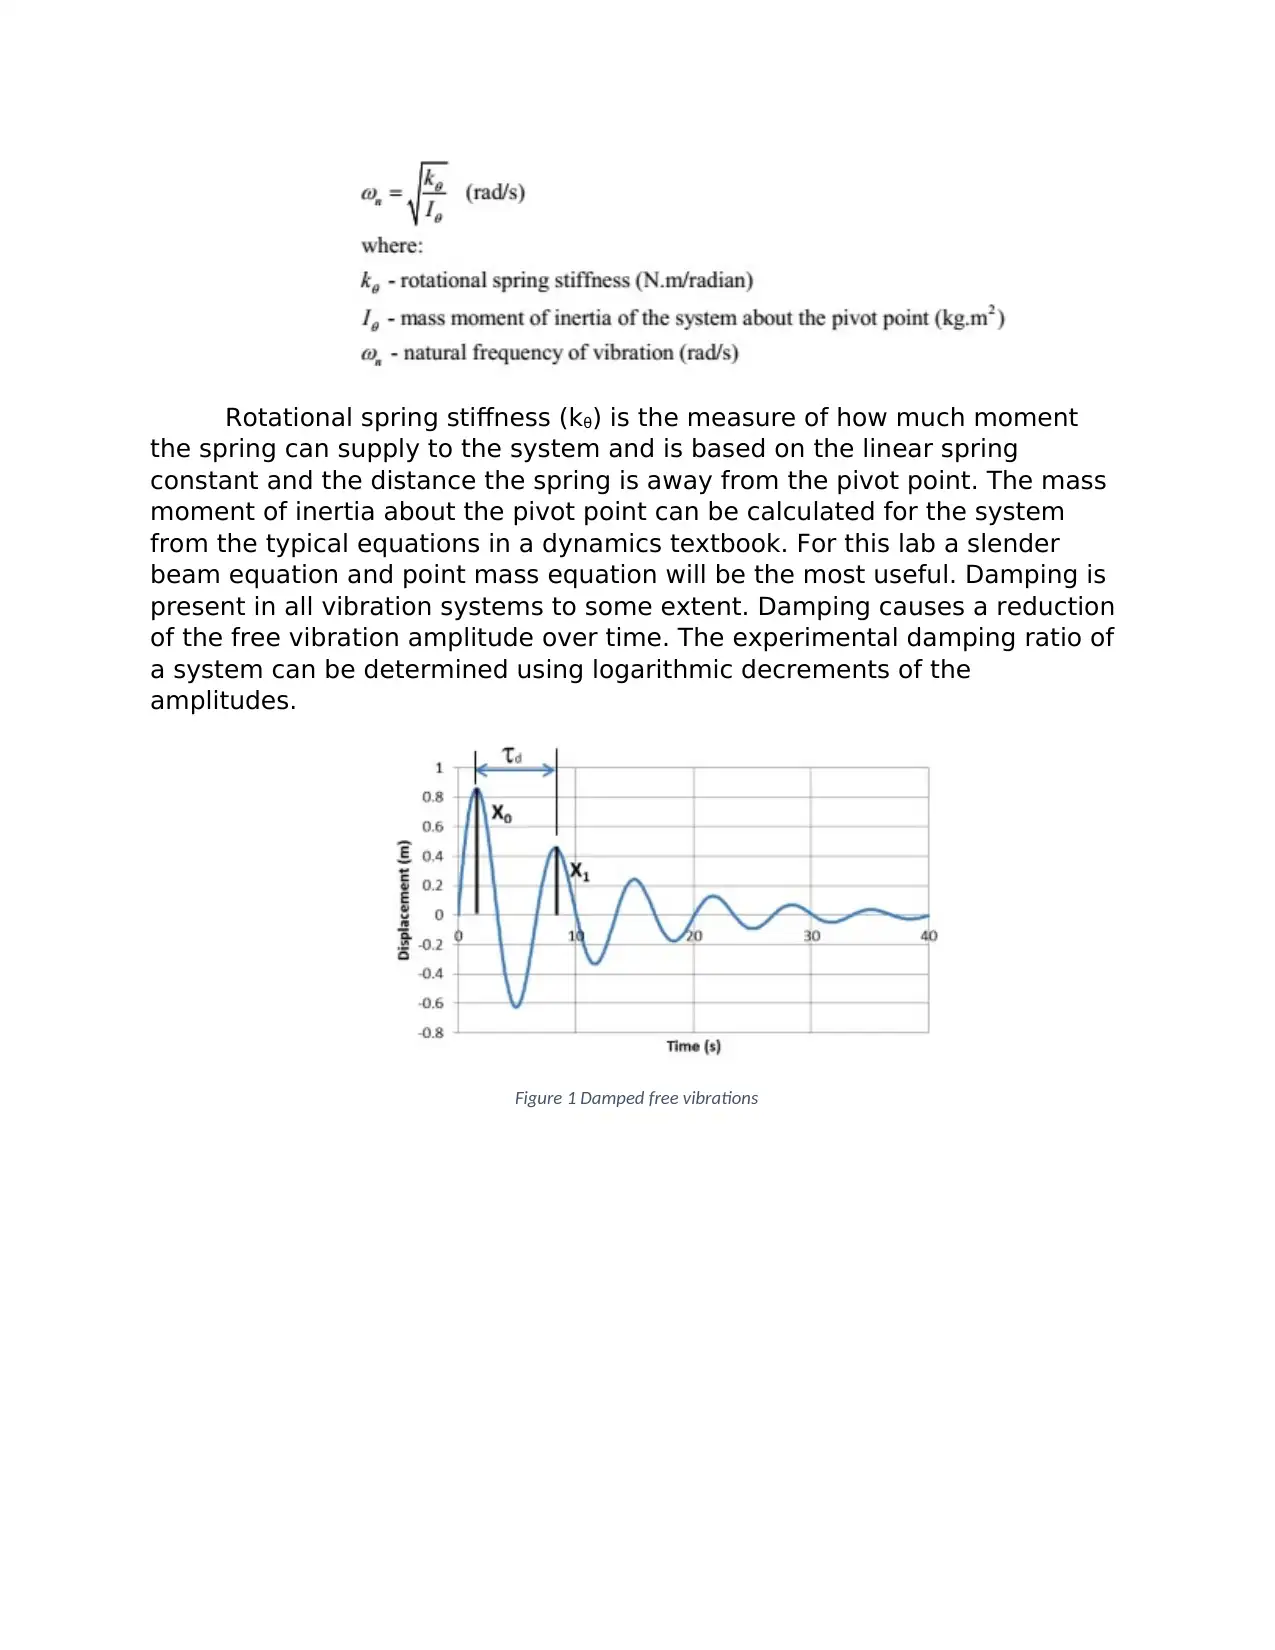
Rotational spring stiffness (kθ) is the measure of how much moment
the spring can supply to the system and is based on the linear spring
constant and the distance the spring is away from the pivot point. The mass
moment of inertia about the pivot point can be calculated for the system
from the typical equations in a dynamics textbook. For this lab a slender
beam equation and point mass equation will be the most useful. Damping is
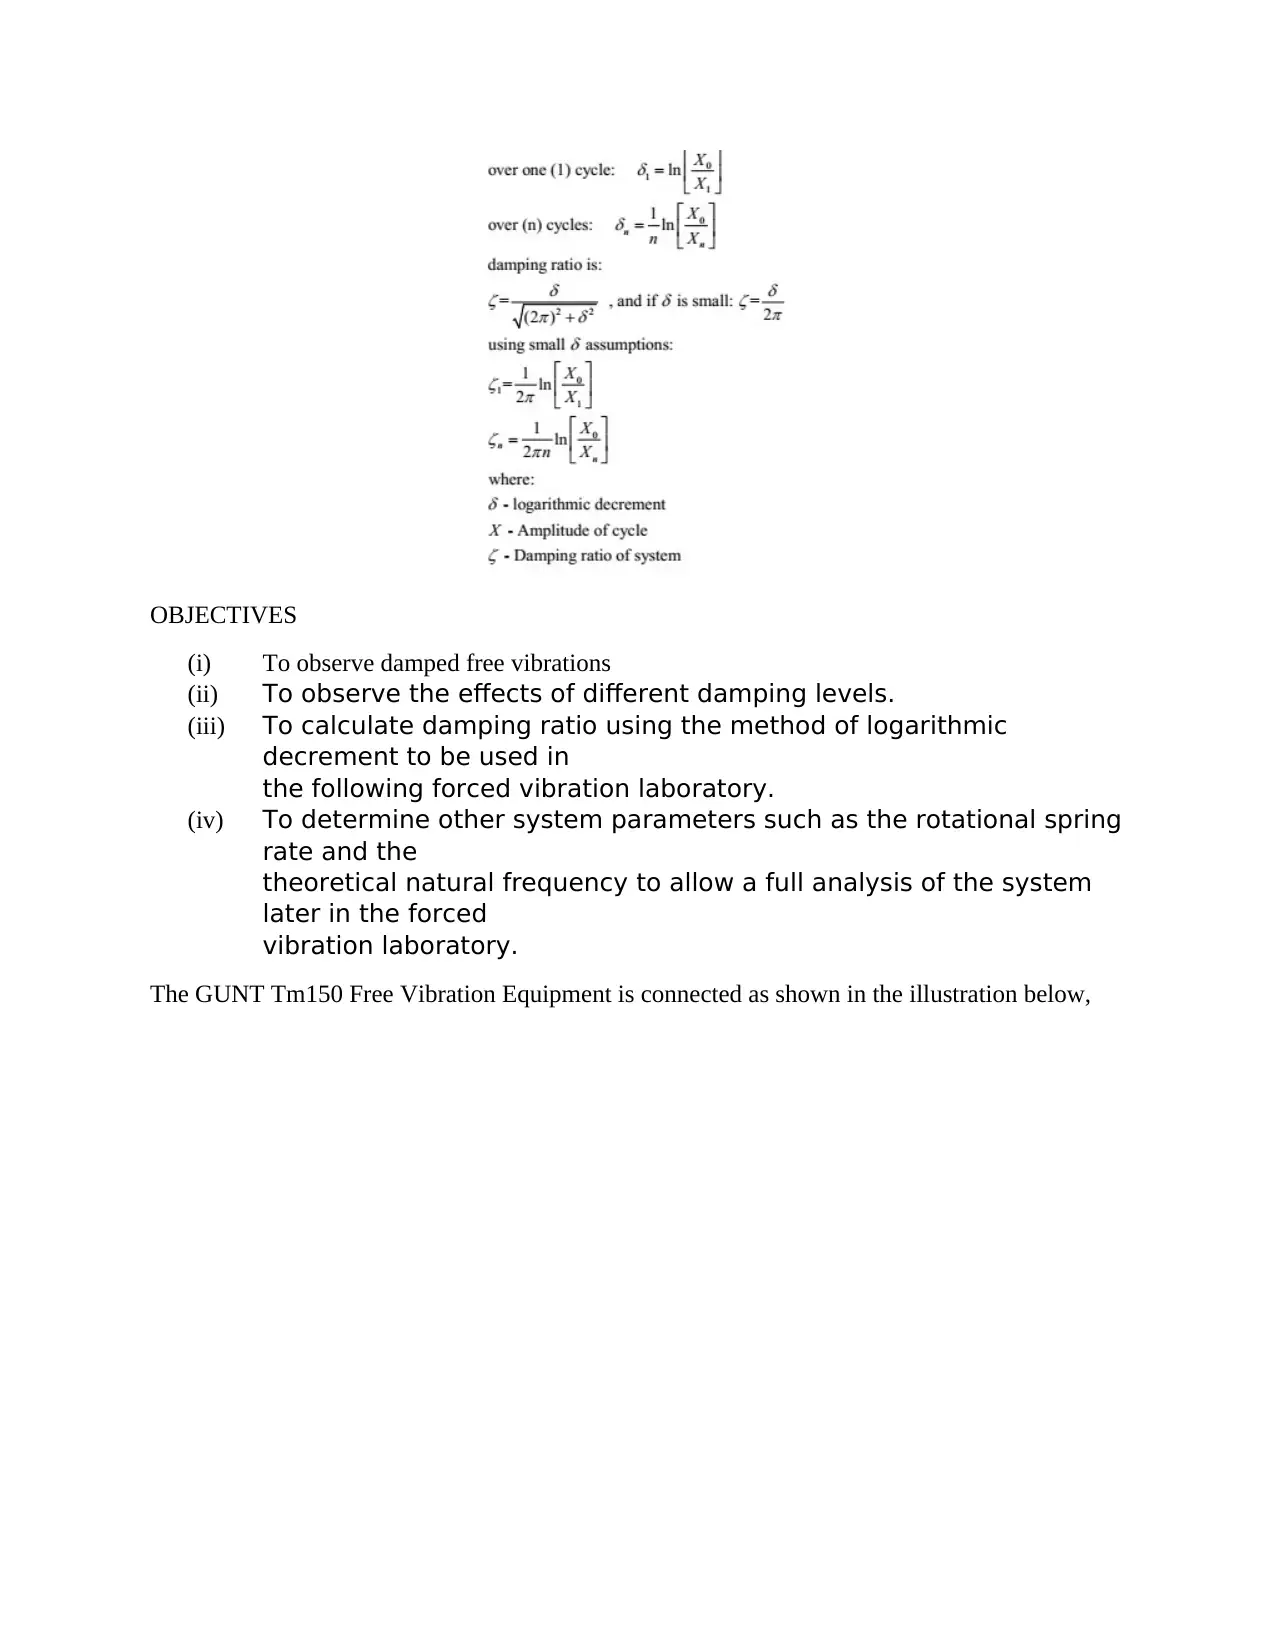
present in all vibration systems to some extent. Damping causes a reduction
of the free vibration amplitude over time. The experimental damping ratio of
a system can be determined using logarithmic decrements of the
amplitudes.
Figure 1 Damped free vibrations
⊘ This is a preview!⊘
Do you want full access?
Subscribe today to unlock all pages.

Trusted by 1+ million students worldwide
OBJECTIVES
(i) To observe damped free vibrations
(ii) To observe the effects of different damping levels.
(iii) To calculate damping ratio using the method of logarithmic
decrement to be used in
the following forced vibration laboratory.
(iv) To determine other system parameters such as the rotational spring
rate and the
theoretical natural frequency to allow a full analysis of the system
later in the forced
vibration laboratory.
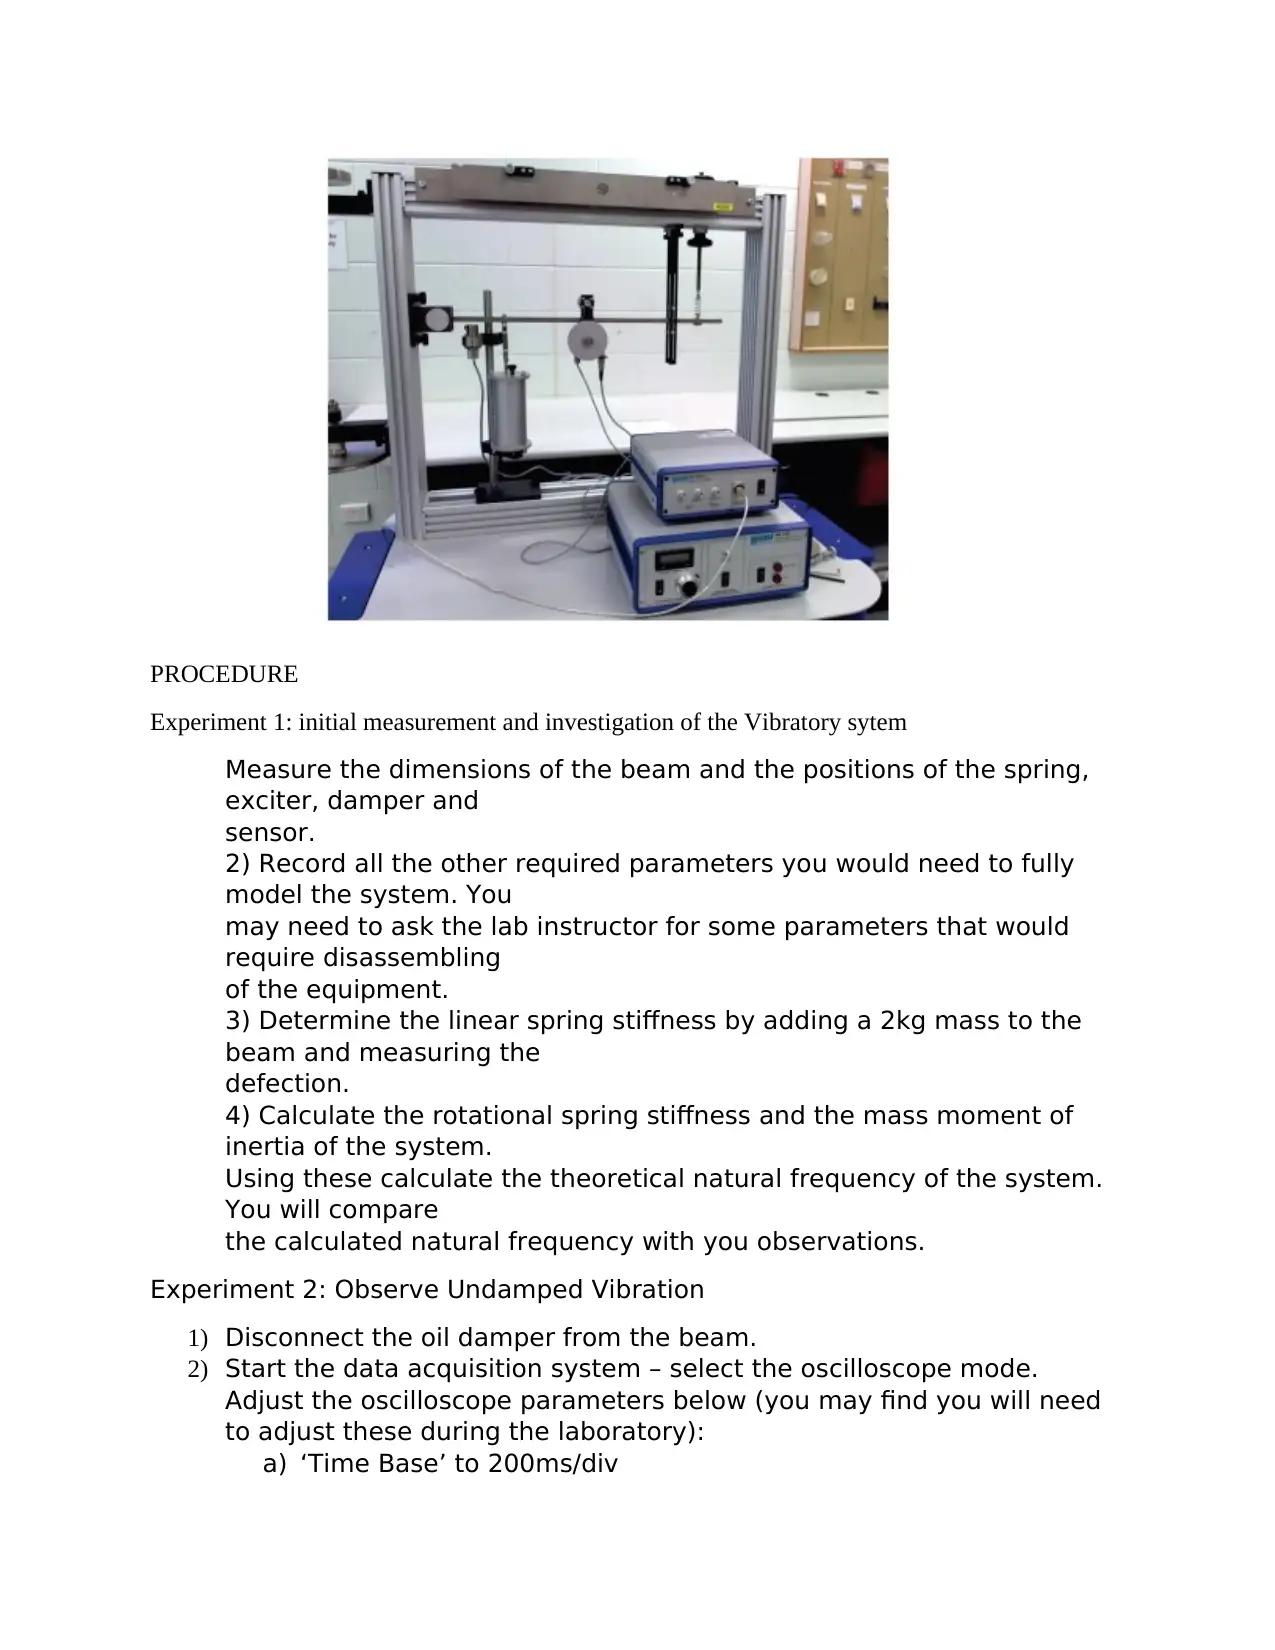
The GUNT Tm150 Free Vibration Equipment is connected as shown in the illustration below,
Paraphrase This Document
Need a fresh take? Get an instant paraphrase of this document with our AI Paraphraser
PROCEDURE
Experiment 1: initial measurement and investigation of the Vibratory sytem
Measure the dimensions of the beam and the positions of the spring,
exciter, damper and
sensor.
2) Record all the other required parameters you would need to fully
model the system. You
may need to ask the lab instructor for some parameters that would
require disassembling
of the equipment.
3) Determine the linear spring stiffness by adding a 2kg mass to the
beam and measuring the
defection.
4) Calculate the rotational spring stiffness and the mass moment of
inertia of the system.
Using these calculate the theoretical natural frequency of the system.
You will compare
the calculated natural frequency with you observations.
Experiment 2: Observe Undamped Vibration
1) Disconnect the oil damper from the beam.
2) Start the data acquisition system – select the oscilloscope mode.
Adjust the oscilloscope parameters below (you may find you will need
to adjust these during the laboratory):
a) ‘Time Base’ to 200ms/div
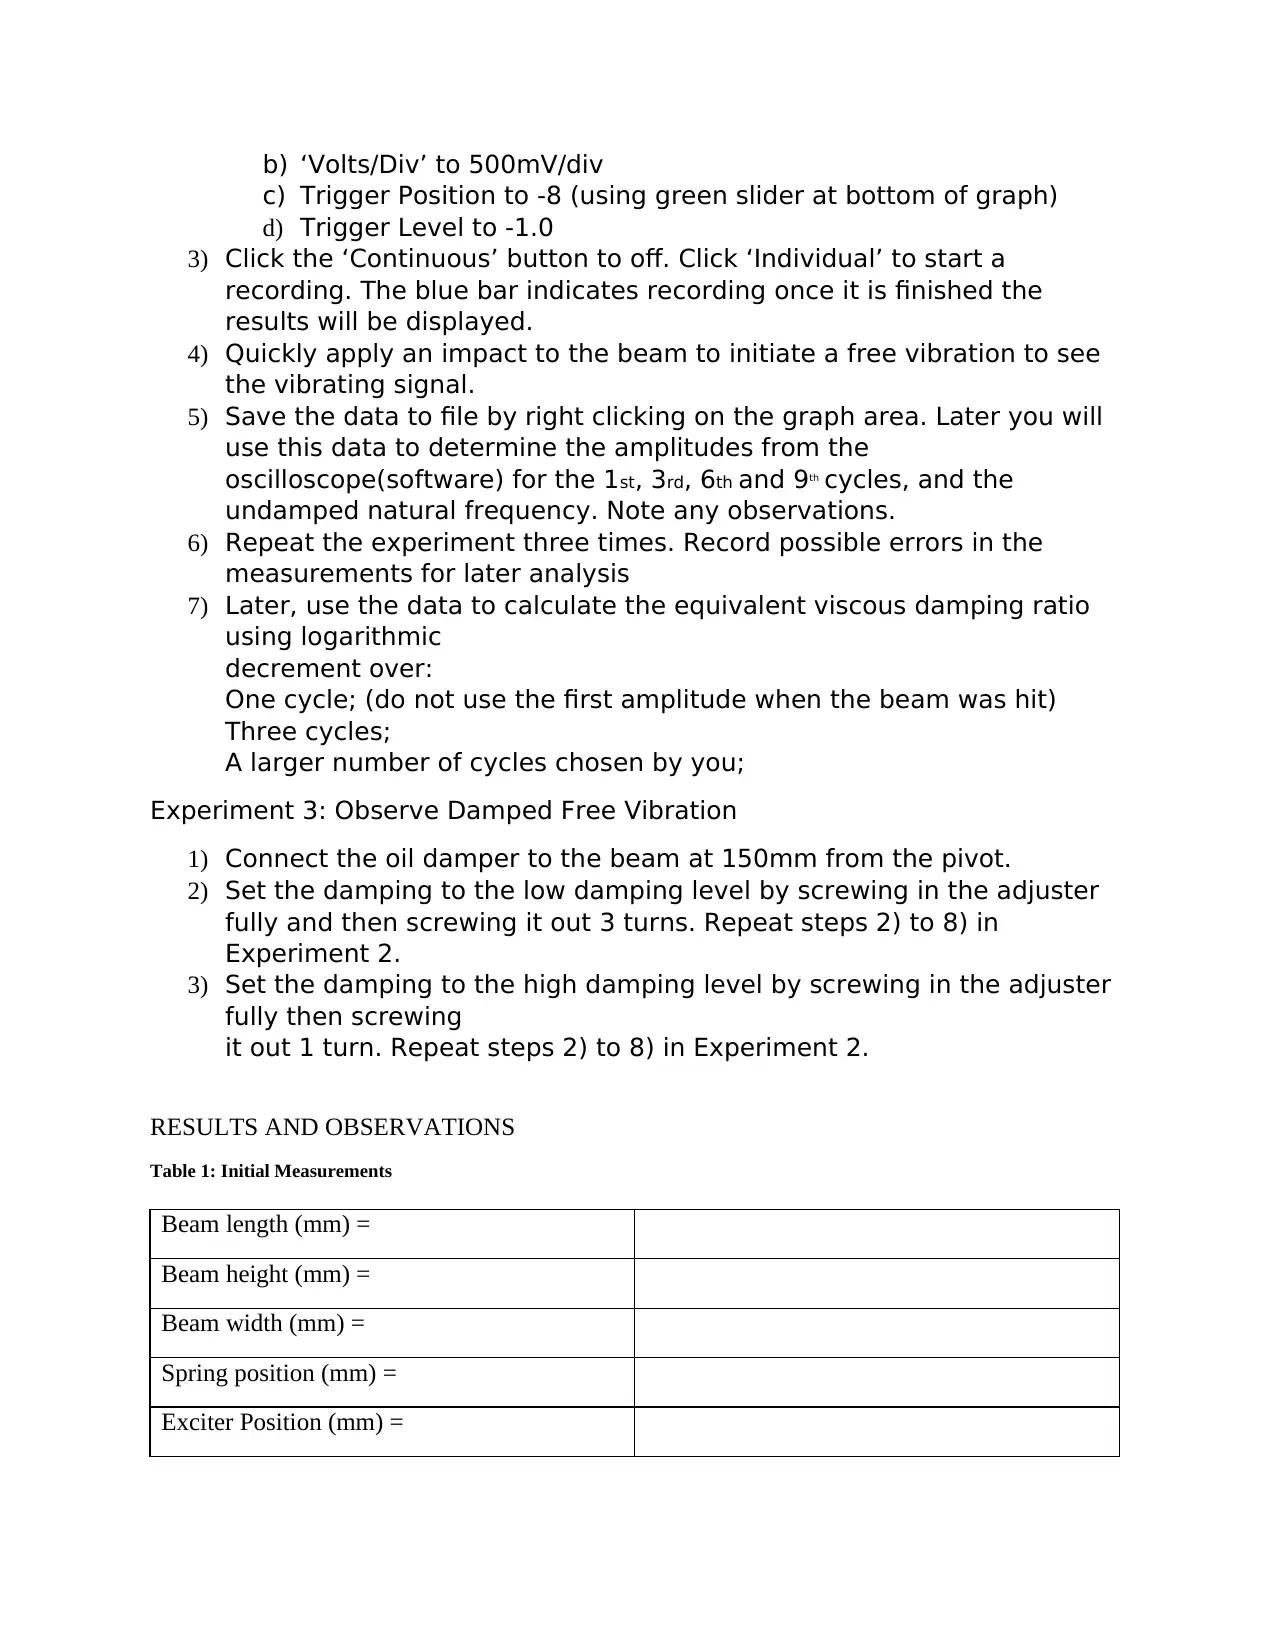
b) ‘Volts/Div’ to 500mV/div
c) Trigger Position to -8 (using green slider at bottom of graph)
d) Trigger Level to -1.0
3) Click the ‘Continuous’ button to off. Click ‘Individual’ to start a
recording. The blue bar indicates recording once it is finished the
results will be displayed.
4) Quickly apply an impact to the beam to initiate a free vibration to see
the vibrating signal.
5) Save the data to file by right clicking on the graph area. Later you will
use this data to determine the amplitudes from the
oscilloscope(software) for the 1st, 3rd, 6th and 9th cycles, and the
undamped natural frequency. Note any observations.
6) Repeat the experiment three times. Record possible errors in the
measurements for later analysis
7) Later, use the data to calculate the equivalent viscous damping ratio
using logarithmic
decrement over:
One cycle; (do not use the first amplitude when the beam was hit)
Three cycles;
A larger number of cycles chosen by you;
Experiment 3: Observe Damped Free Vibration
1) Connect the oil damper to the beam at 150mm from the pivot.
2) Set the damping to the low damping level by screwing in the adjuster
fully and then screwing it out 3 turns. Repeat steps 2) to 8) in
Experiment 2.
3) Set the damping to the high damping level by screwing in the adjuster
fully then screwing
it out 1 turn. Repeat steps 2) to 8) in Experiment 2.
RESULTS AND OBSERVATIONS
Table 1: Initial Measurements
Beam length (mm) =
Beam height (mm) =
Beam width (mm) =
Spring position (mm) =
Exciter Position (mm) =
⊘ This is a preview!⊘
Do you want full access?
Subscribe today to unlock all pages.

Trusted by 1+ million students worldwide
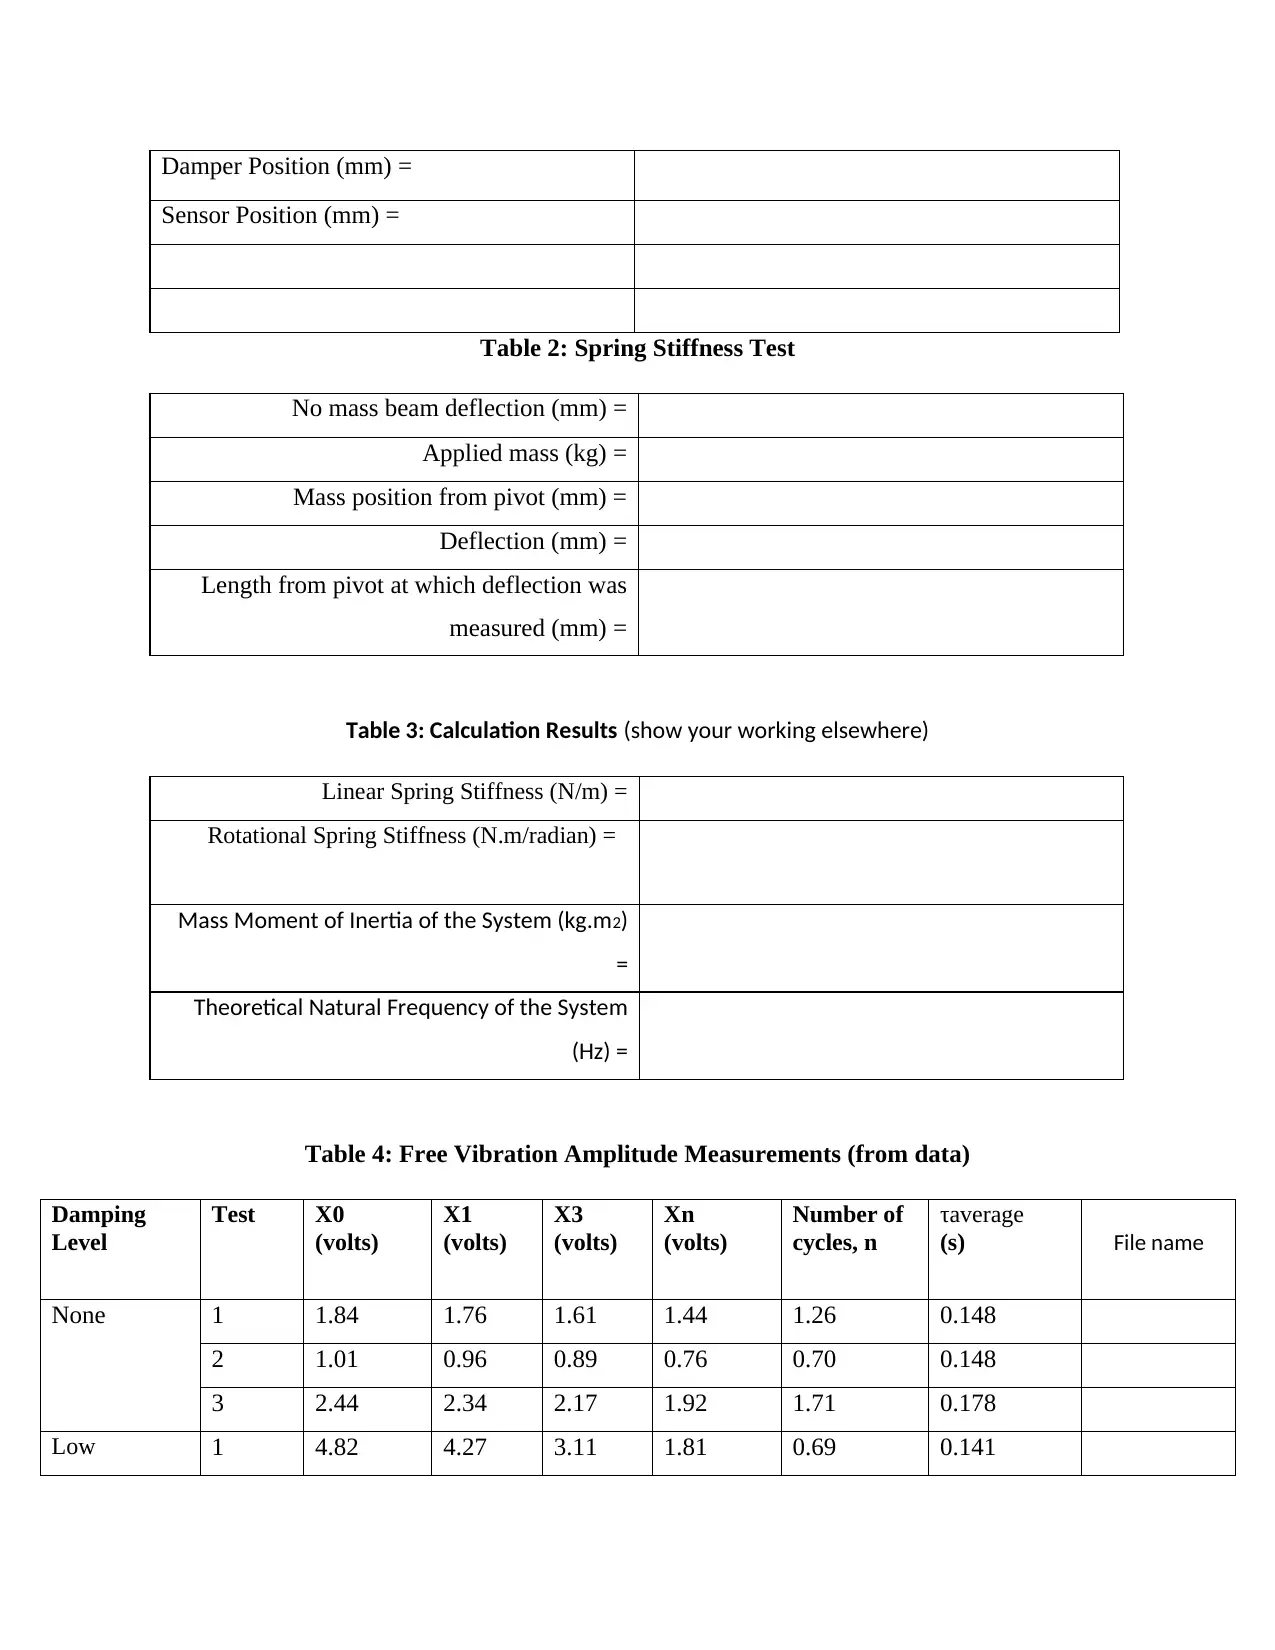
Damper Position (mm) =
Sensor Position (mm) =
Table 2: Spring Stiffness Test
No mass beam deflection (mm) =
Applied mass (kg) =
Mass position from pivot (mm) =
Deflection (mm) =
Length from pivot at which deflection was
measured (mm) =
Table 3: Calculation Results (show your working elsewhere)
Linear Spring Stiffness (N/m) =
Rotational Spring Stiffness (N.m/radian) =
Mass Moment of Inertia of the System (kg.m2)
=
Theoretical Natural Frequency of the System
(Hz) =
Table 4: Free Vibration Amplitude Measurements (from data)
Damping
Level
Test X0
(volts)
X1
(volts)
X3
(volts)
Xn
(volts)
Number of
cycles, n
τaverage
(s) File name
None 1 1.84 1.76 1.61 1.44 1.26 0.148
2 1.01 0.96 0.89 0.76 0.70 0.148
3 2.44 2.34 2.17 1.92 1.71 0.178
Low 1 4.82 4.27 3.11 1.81 0.69 0.141
Paraphrase This Document
Need a fresh take? Get an instant paraphrase of this document with our AI Paraphraser
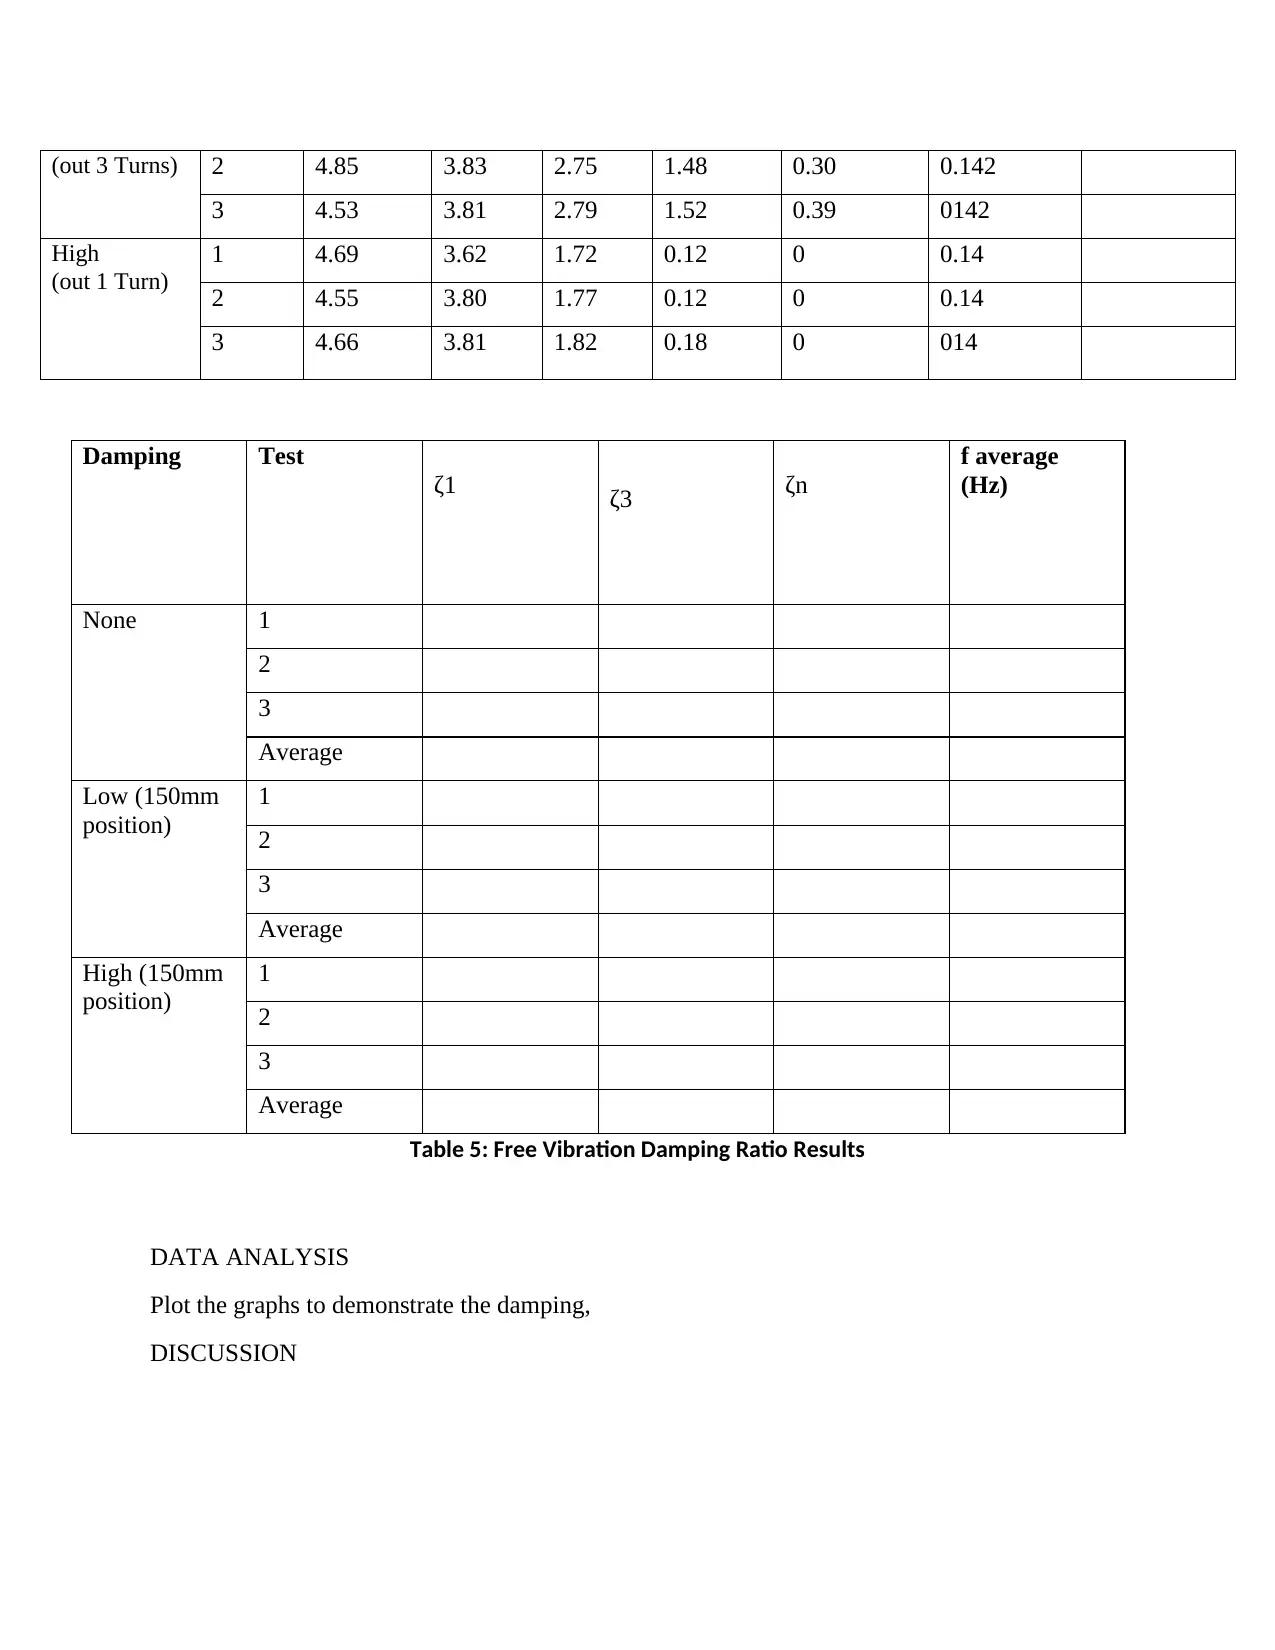
(out 3 Turns) 2 4.85 3.83 2.75 1.48 0.30 0.142
3 4.53 3.81 2.79 1.52 0.39 0142
High
(out 1 Turn)
1 4.69 3.62 1.72 0.12 0 0.14
2 4.55 3.80 1.77 0.12 0 0.14
3 4.66 3.81 1.82 0.18 0 014
Damping Test
ζ1 ζ3 ζn
f average
(Hz)
None 1
2
3
Average
Low (150mm
position)
1
2
3
Average
High (150mm
position)
1
2
3
Average
Table 5: Free Vibration Damping Ratio Results
DATA ANALYSIS
Plot the graphs to demonstrate the damping,
DISCUSSION
LAB 2: WHIRLING OF SHAFTS- GUNT TM625
BASIC OVERVIEW
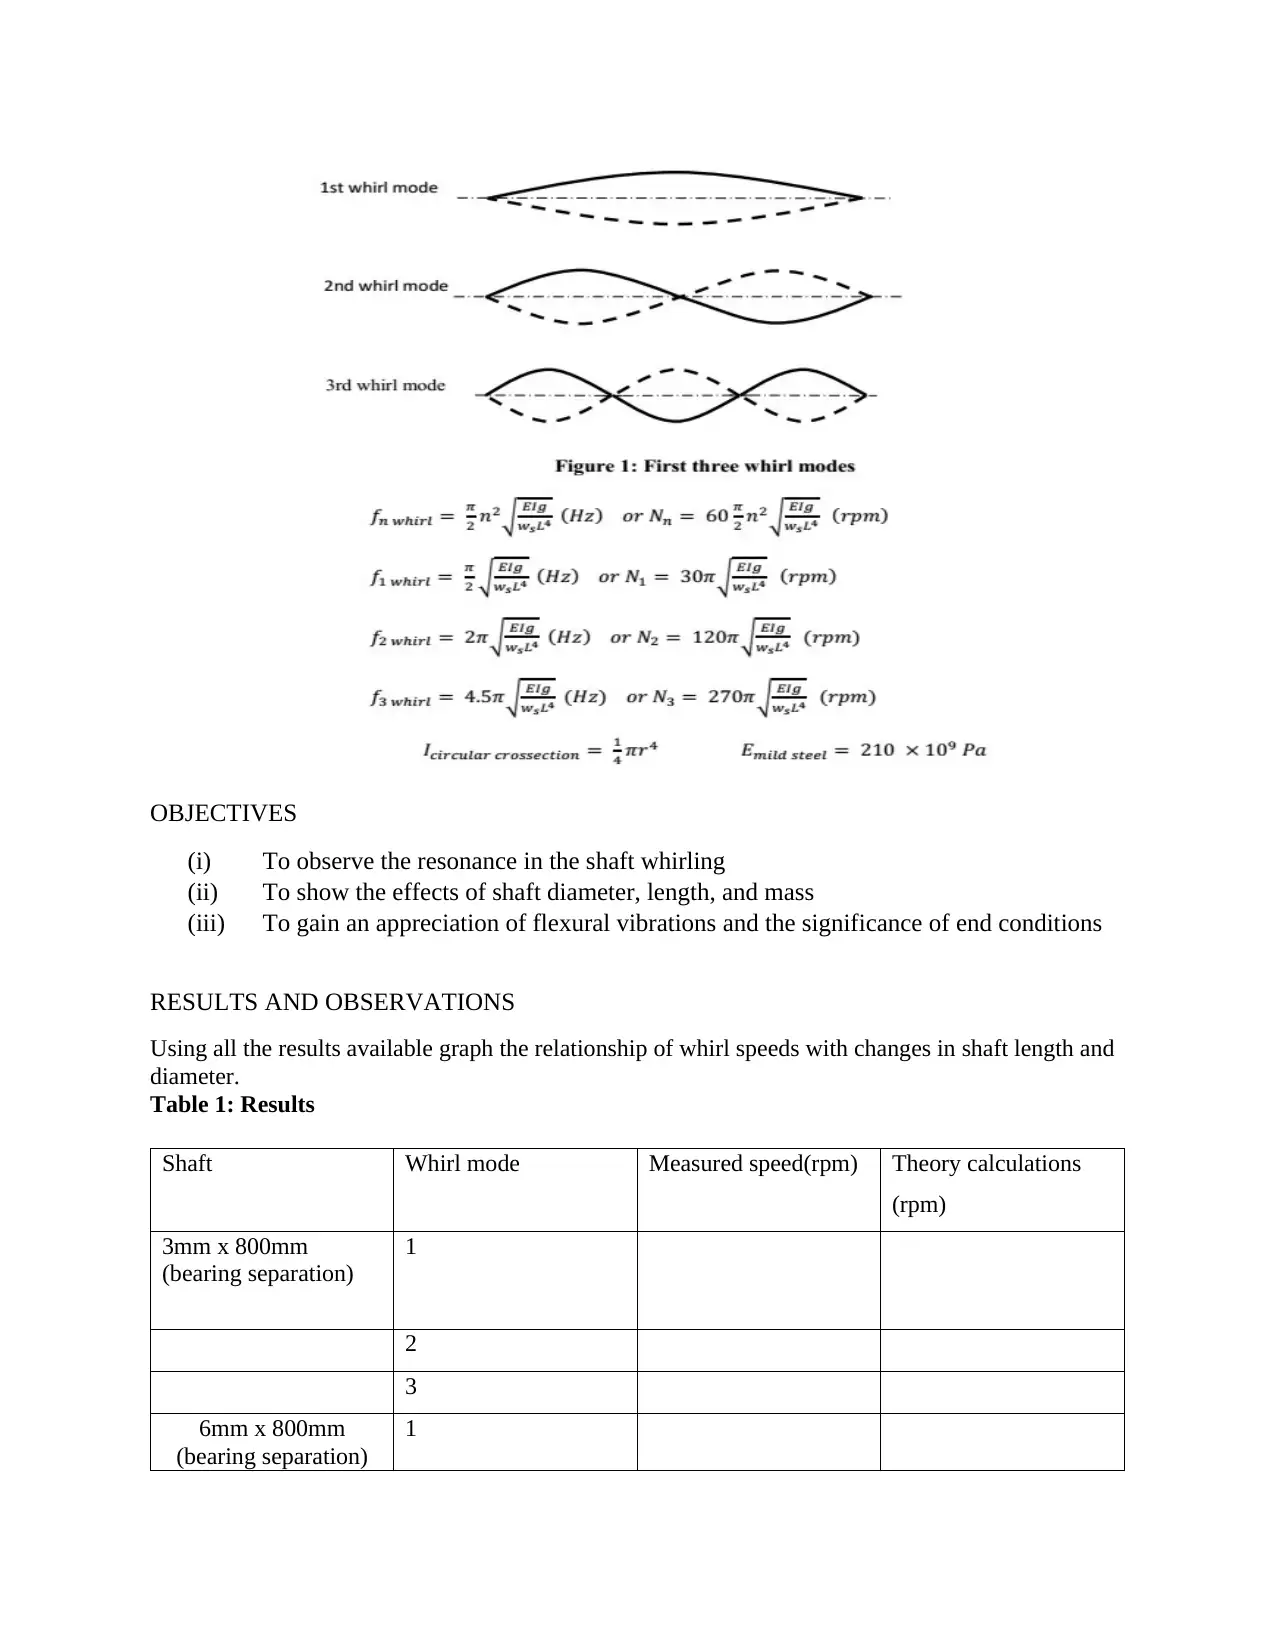
Vibrations can occur when shafts rotate, this mode of vibration is called whirling. Whirling is
the defection of the shaft parallel to the axis of rotation. If not controlled whirling can damage
shafts and any associated equipment that is fitted or connected to the shaft, such as bearings,
gears and couplings (Lobontiu, n.d.). Shaft whirling occurs when the shaft displaces
out from its normal center line. There are multiple speeds or modes at which
whirling occurs based on the material and dimensions of the shaft. The
whirling mode is affected when additional masses are fitted to the beam. The
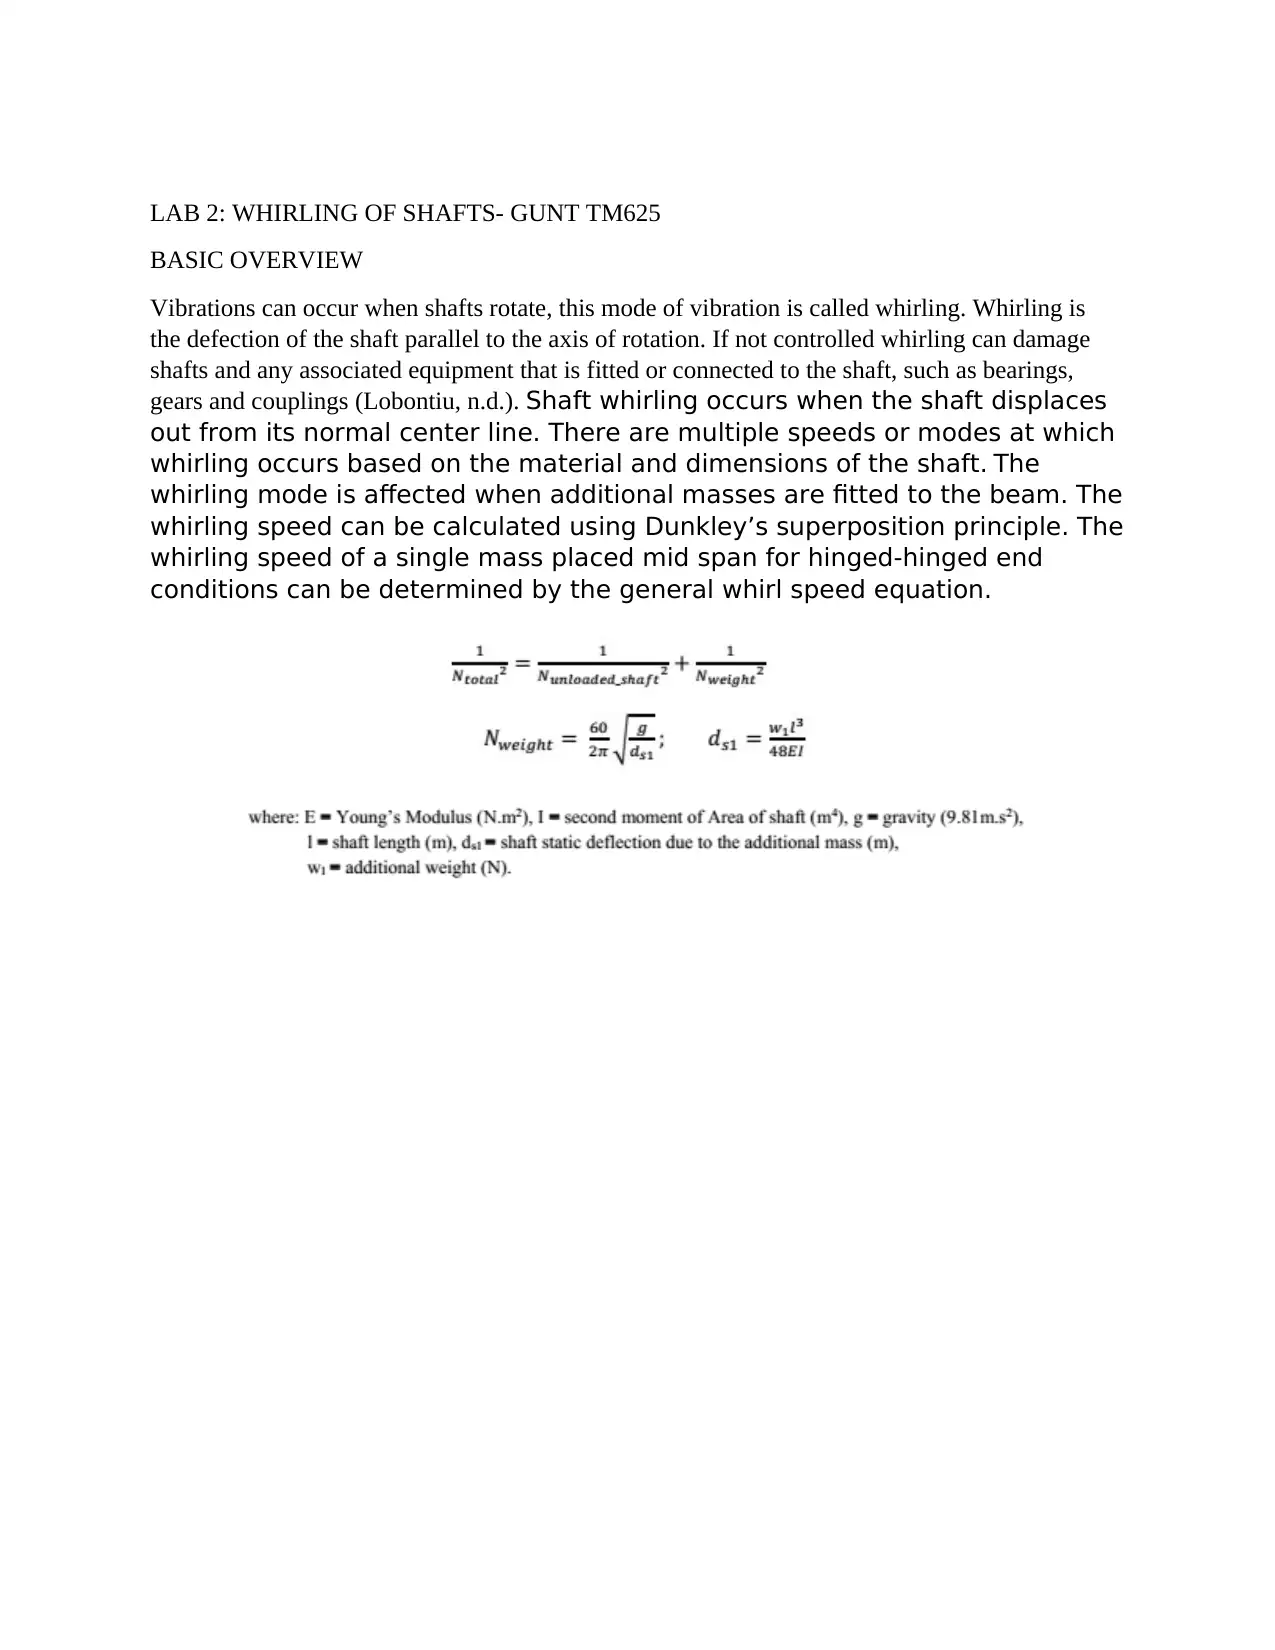
whirling speed can be calculated using Dunkley’s superposition principle. The
whirling speed of a single mass placed mid span for hinged-hinged end
conditions can be determined by the general whirl speed equation.
⊘ This is a preview!⊘
Do you want full access?
Subscribe today to unlock all pages.

Trusted by 1+ million students worldwide
OBJECTIVES
(i) To observe the resonance in the shaft whirling
(ii) To show the effects of shaft diameter, length, and mass
(iii) To gain an appreciation of flexural vibrations and the significance of end conditions
RESULTS AND OBSERVATIONS
Using all the results available graph the relationship of whirl speeds with changes in shaft length and
diameter.
Table 1: Results
Shaft Whirl mode Measured speed(rpm) Theory calculations
(rpm)
3mm x 800mm
(bearing separation)
1
2
3
6mm x 800mm
(bearing separation)
1
Paraphrase This Document
Need a fresh take? Get an instant paraphrase of this document with our AI Paraphraser
2
3mm x 450mm
(bearing separation)
(use 600mm long
shaft)
1
1 (additional 1kg mass
at midpoint)
DISCUSSION
LAB 3: MASS BALANCE
BASIC OVERVIEW
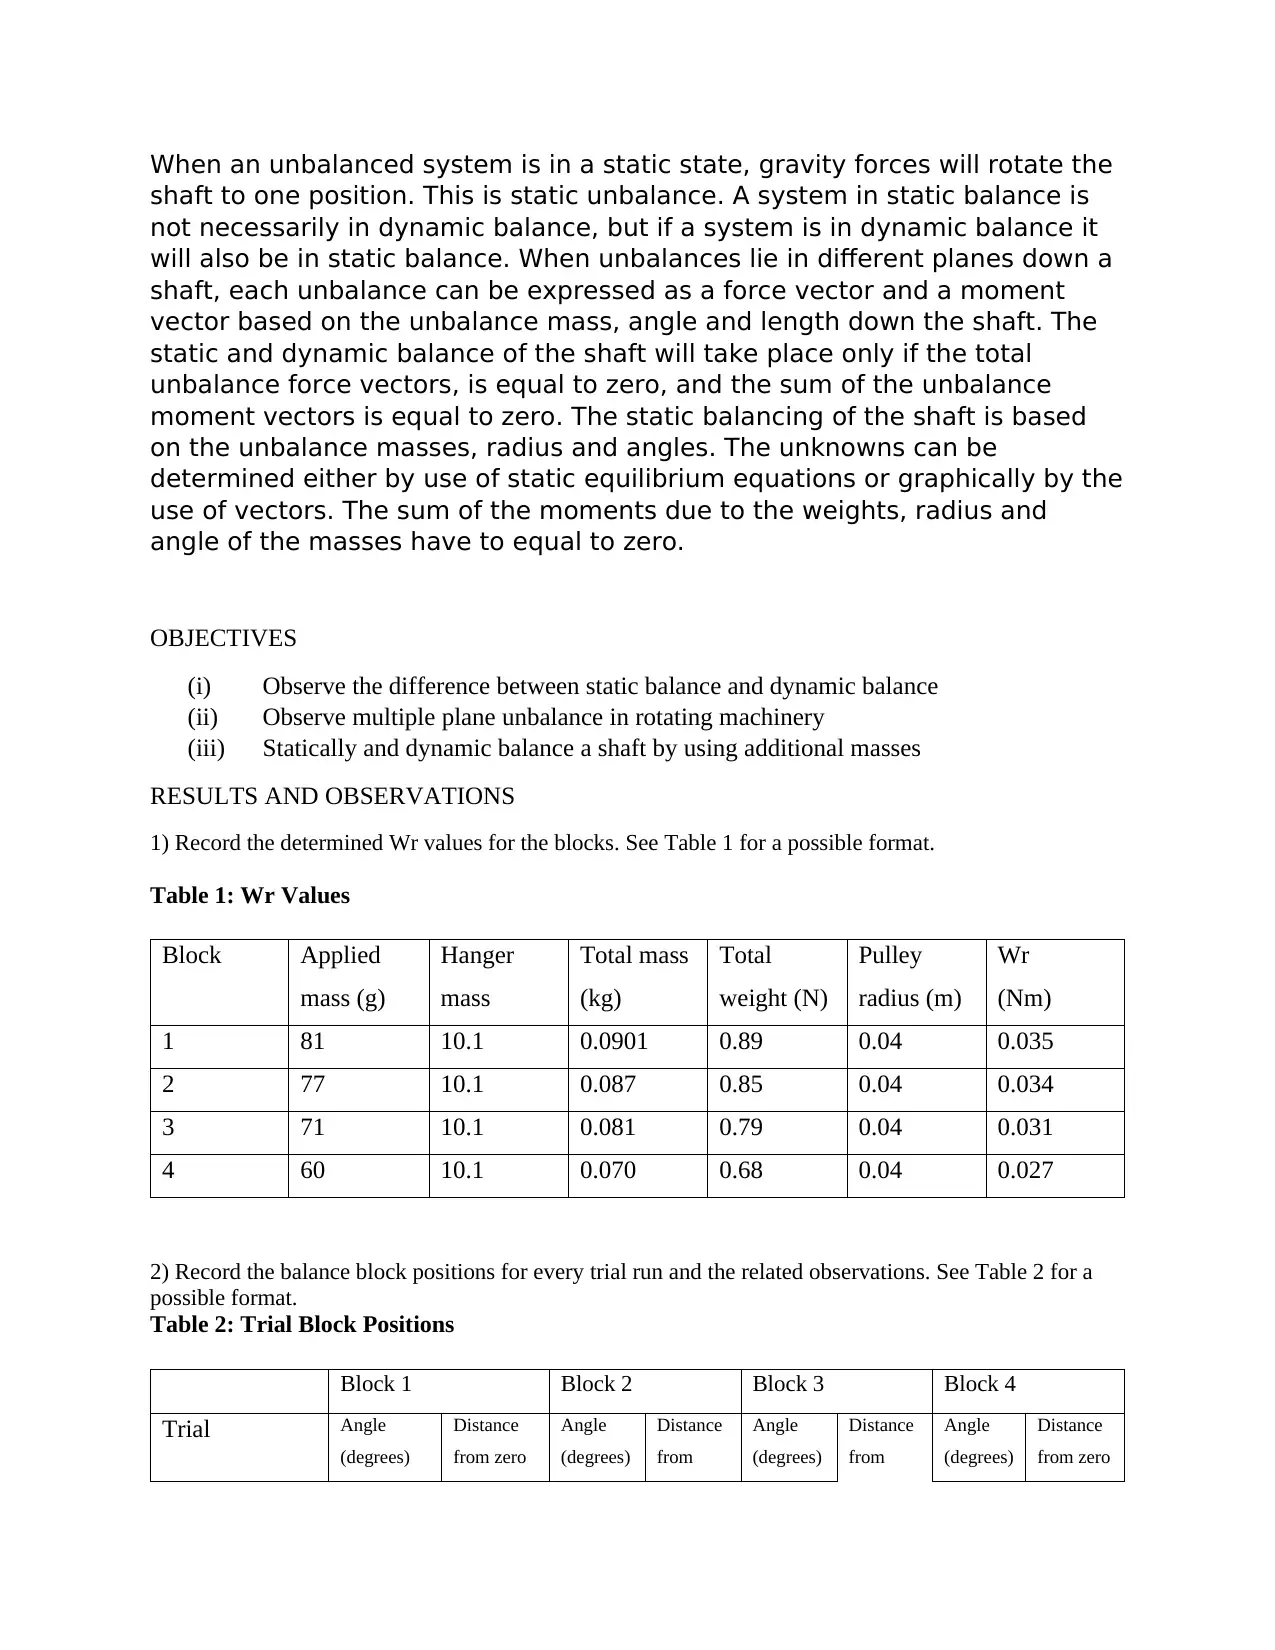
When any eccentric mass exists in a rotation system, the centrifugal force
will be acting and rotating together with the shaft. These unbalance forces
can be harmful, causing extra loading of bearings and vibration of the
system. That is why the balancing process is of great importance for many
practical cases. Multiple unbalances can exist along a single shaft due to
unbalance in individual components fitted to the shaft. The centrifugal force
value F due to a mass unbalance can be expressed as shown in the equation
below. This centrifugal force is acting radially outwards and in the plane
where the center of mass m rotates.
When an unbalanced system is in a static state, gravity forces will rotate the
shaft to one position. This is static unbalance. A system in static balance is
not necessarily in dynamic balance, but if a system is in dynamic balance it
will also be in static balance. When unbalances lie in different planes down a
shaft, each unbalance can be expressed as a force vector and a moment
vector based on the unbalance mass, angle and length down the shaft. The
static and dynamic balance of the shaft will take place only if the total
unbalance force vectors, is equal to zero, and the sum of the unbalance
moment vectors is equal to zero. The static balancing of the shaft is based
on the unbalance masses, radius and angles. The unknowns can be
determined either by use of static equilibrium equations or graphically by the
use of vectors. The sum of the moments due to the weights, radius and
angle of the masses have to equal to zero.
OBJECTIVES
(i) Observe the difference between static balance and dynamic balance
(ii) Observe multiple plane unbalance in rotating machinery
(iii) Statically and dynamic balance a shaft by using additional masses
RESULTS AND OBSERVATIONS
1) Record the determined Wr values for the blocks. See Table 1 for a possible format.
Table 1: Wr Values
Block Applied
mass (g)
Hanger
mass
Total mass
(kg)
Total
weight (N)
Pulley
radius (m)
Wr
(Nm)
1 81 10.1 0.0901 0.89 0.04 0.035
2 77 10.1 0.087 0.85 0.04 0.034
3 71 10.1 0.081 0.79 0.04 0.031
4 60 10.1 0.070 0.68 0.04 0.027
2) Record the balance block positions for every trial run and the related observations. See Table 2 for a
possible format.
Table 2: Trial Block Positions
Block 1 Block 2 Block 3 Block 4
Trial Angle
(degrees)
Distance
from zero
Angle
(degrees)
Distance
from
Angle
(degrees)
Distance
from
Angle
(degrees)
Distance
from zero
⊘ This is a preview!⊘
Do you want full access?
Subscribe today to unlock all pages.

Trusted by 1+ million students worldwide
1 out of 18
Related Documents
Your All-in-One AI-Powered Toolkit for Academic Success.
+13062052269
info@desklib.com
Available 24*7 on WhatsApp / Email
![[object Object]](/_next/static/media/star-bottom.7253800d.svg)
Unlock your academic potential
Copyright © 2020–2025 A2Z Services. All Rights Reserved. Developed and managed by ZUCOL.


