A Simple Analysis of Openness for Italy and Sweden
VerifiedAdded on 2023/02/01
|11
|1898
|30
AI Summary
This article provides a simple analysis of the trade openness and income inequality in Italy and Sweden. It includes data on the %openness and % Gini index for both countries, as well as graphs and correlations between the two variables. The article also discusses the Stolper-Samuelson theorem and the hypothetical Ricardian model to explain the relationship between trade openness and inequality.
Contribute Materials
Your contribution can guide someone’s learning journey. Share your
documents today.
DATA ANALYSIS
A Simple Analysis of Openness for Italy and Sweden
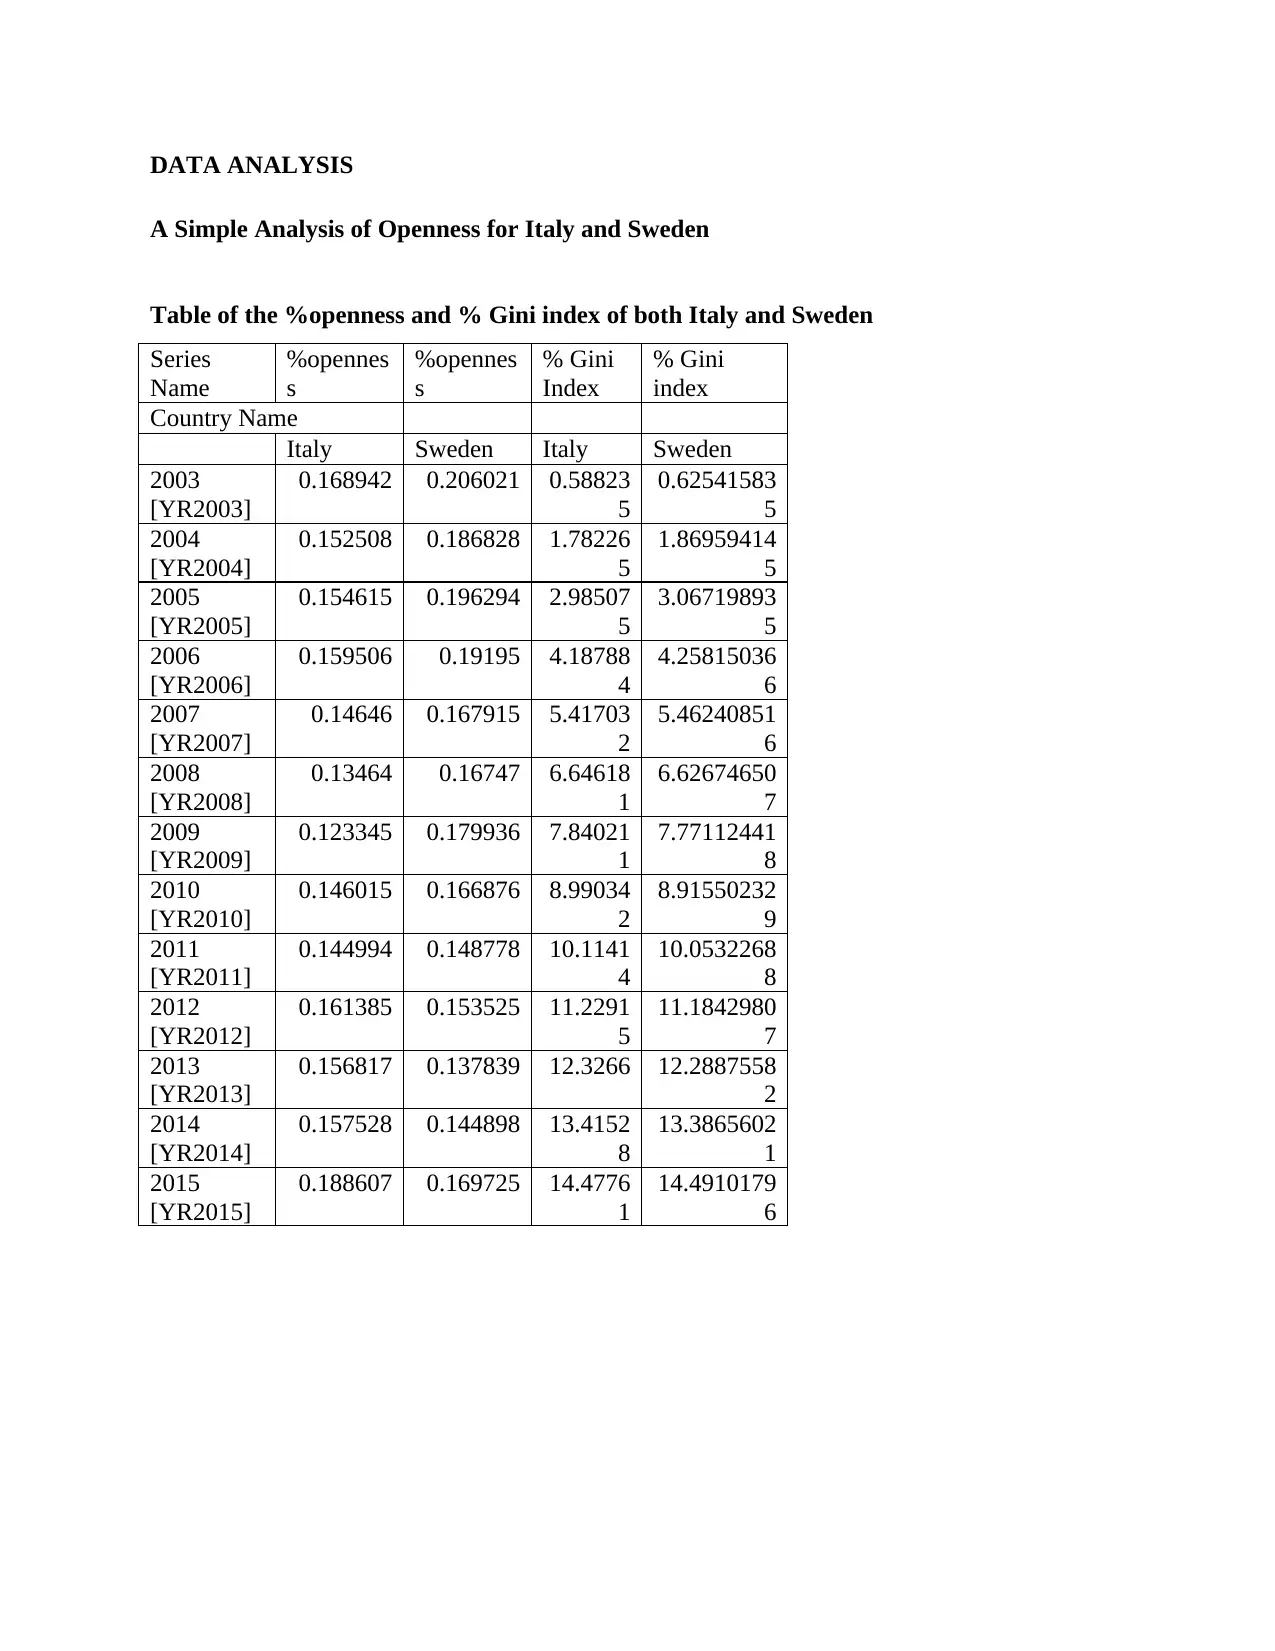
Table of the %openness and % Gini index of both Italy and Sweden
Series
Name
%opennes
s
%opennes
s
% Gini
Index
% Gini
index
Country Name
Italy Sweden Italy Sweden
2003
[YR2003]
0.168942 0.206021 0.58823
5
0.62541583
5
2004
[YR2004]
0.152508 0.186828 1.78226
5
1.86959414
5
2005
[YR2005]
0.154615 0.196294 2.98507
5
3.06719893
5
2006
[YR2006]
0.159506 0.19195 4.18788
4
4.25815036
6
2007
[YR2007]
0.14646 0.167915 5.41703
2
5.46240851
6
2008
[YR2008]
0.13464 0.16747 6.64618
1
6.62674650
7
2009
[YR2009]
0.123345 0.179936 7.84021
1
7.77112441
8
2010
[YR2010]
0.146015 0.166876 8.99034
2
8.91550232
9
2011
[YR2011]
0.144994 0.148778 10.1141
4
10.0532268
8
2012
[YR2012]
0.161385 0.153525 11.2291
5
11.1842980
7
2013
[YR2013]
0.156817 0.137839 12.3266 12.2887558
2
2014
[YR2014]
0.157528 0.144898 13.4152
8
13.3865602
1
2015
[YR2015]
0.188607 0.169725 14.4776
1
14.4910179
6
A Simple Analysis of Openness for Italy and Sweden
Table of the %openness and % Gini index of both Italy and Sweden
Series
Name
%opennes
s
%opennes
s
% Gini
Index
% Gini
index
Country Name
Italy Sweden Italy Sweden
2003
[YR2003]
0.168942 0.206021 0.58823
5
0.62541583
5
2004
[YR2004]
0.152508 0.186828 1.78226
5
1.86959414
5
2005
[YR2005]
0.154615 0.196294 2.98507
5
3.06719893
5
2006
[YR2006]
0.159506 0.19195 4.18788
4
4.25815036
6
2007
[YR2007]
0.14646 0.167915 5.41703
2
5.46240851
6
2008
[YR2008]
0.13464 0.16747 6.64618
1
6.62674650
7
2009
[YR2009]
0.123345 0.179936 7.84021
1
7.77112441
8
2010
[YR2010]
0.146015 0.166876 8.99034
2
8.91550232
9
2011
[YR2011]
0.144994 0.148778 10.1141
4
10.0532268
8
2012
[YR2012]
0.161385 0.153525 11.2291
5
11.1842980
7
2013
[YR2013]
0.156817 0.137839 12.3266 12.2887558
2
2014
[YR2014]
0.157528 0.144898 13.4152
8
13.3865602
1
2015
[YR2015]
0.188607 0.169725 14.4776
1
14.4910179
6
Secure Best Marks with AI Grader
Need help grading? Try our AI Grader for instant feedback on your assignments.
0 2 4 6 8 10 12 14 16
0
0.02
0.04
0.06
0.08
0.1
0.12
0.14
0.16
0.18
0.2
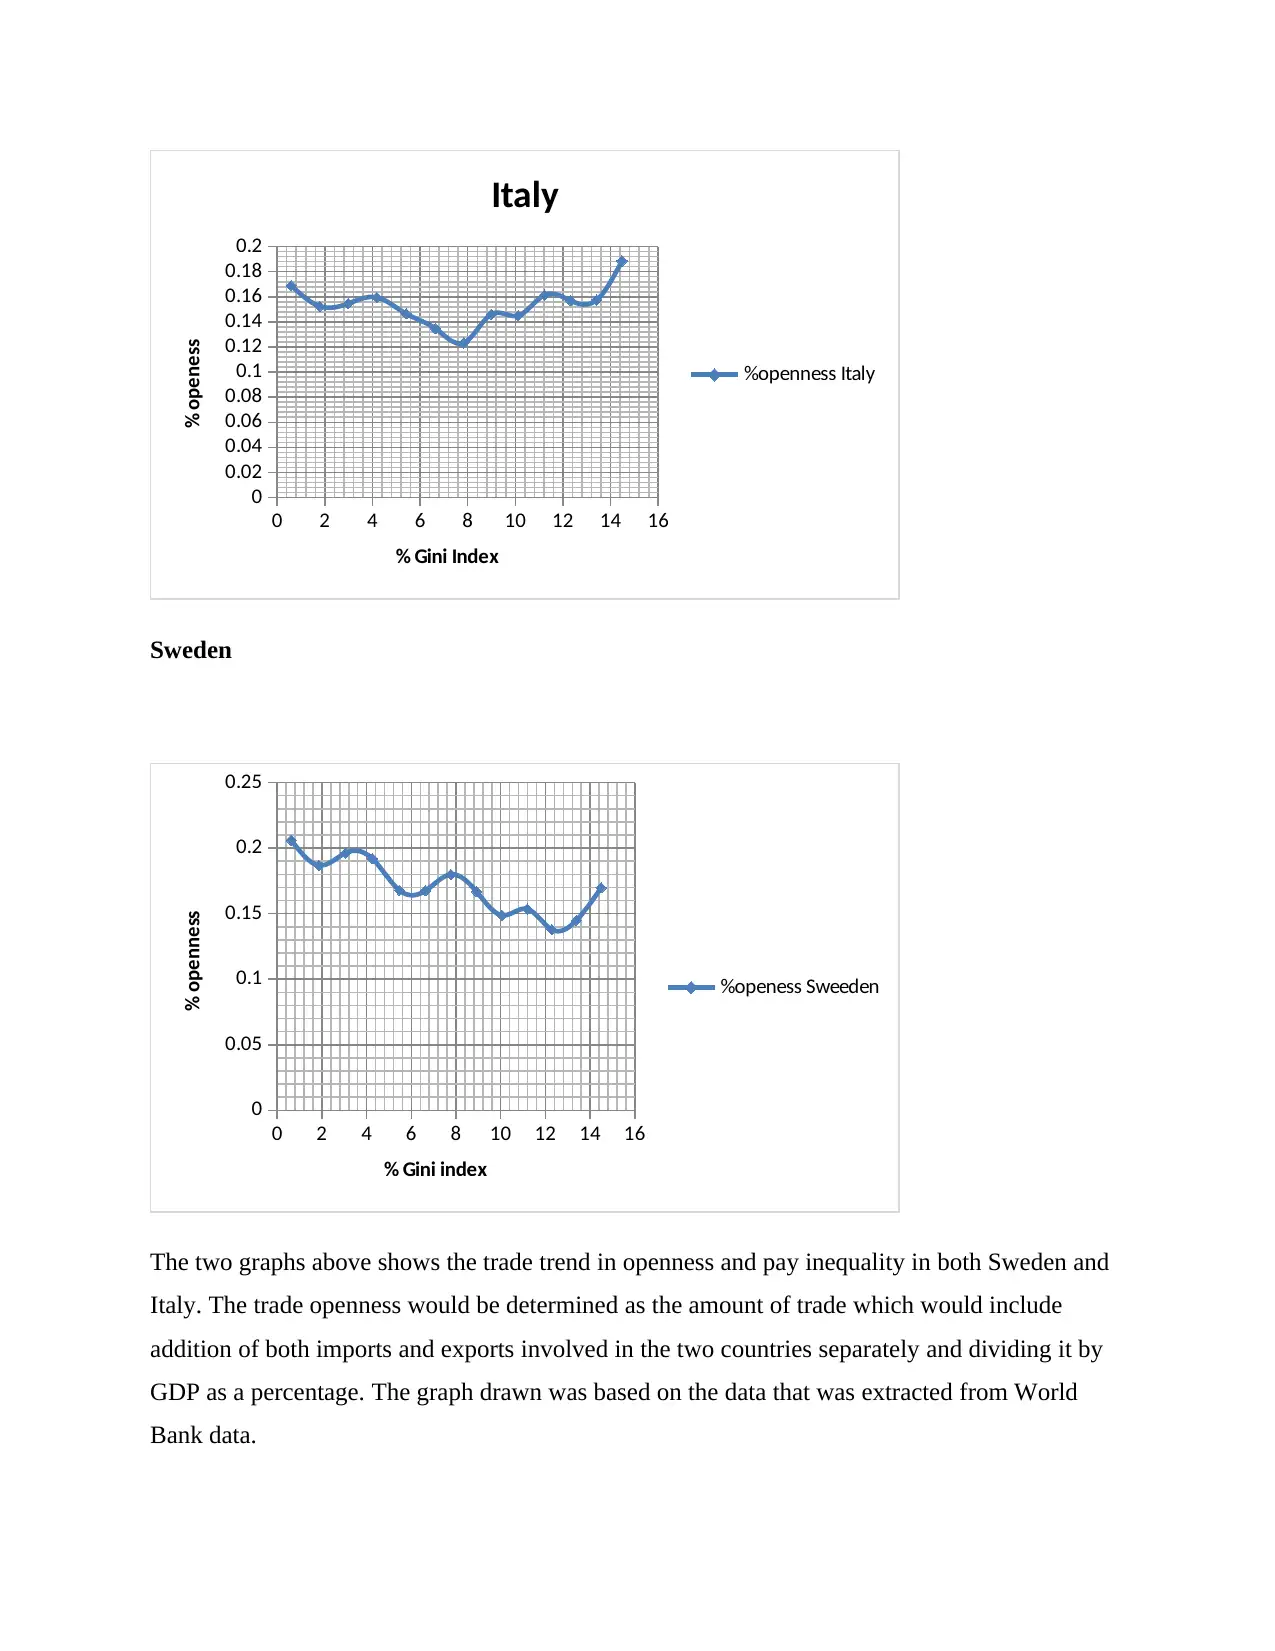
Italy
%openness Italy
% Gini Index
% openess
Sweden
0 2 4 6 8 10 12 14 16
0
0.05
0.1
0.15
0.2
0.25
%openess Sweeden
% Gini index
% openness
The two graphs above shows the trade trend in openness and pay inequality in both Sweden and
Italy. The trade openness would be determined as the amount of trade which would include
addition of both imports and exports involved in the two countries separately and dividing it by
GDP as a percentage. The graph drawn was based on the data that was extracted from World
Bank data.
0
0.02
0.04
0.06
0.08
0.1
0.12
0.14
0.16
0.18
0.2
Italy
%openness Italy
% Gini Index
% openess
Sweden
0 2 4 6 8 10 12 14 16
0
0.05
0.1
0.15
0.2
0.25
%openess Sweeden
% Gini index
% openness
The two graphs above shows the trade trend in openness and pay inequality in both Sweden and
Italy. The trade openness would be determined as the amount of trade which would include
addition of both imports and exports involved in the two countries separately and dividing it by
GDP as a percentage. The graph drawn was based on the data that was extracted from World
Bank data.
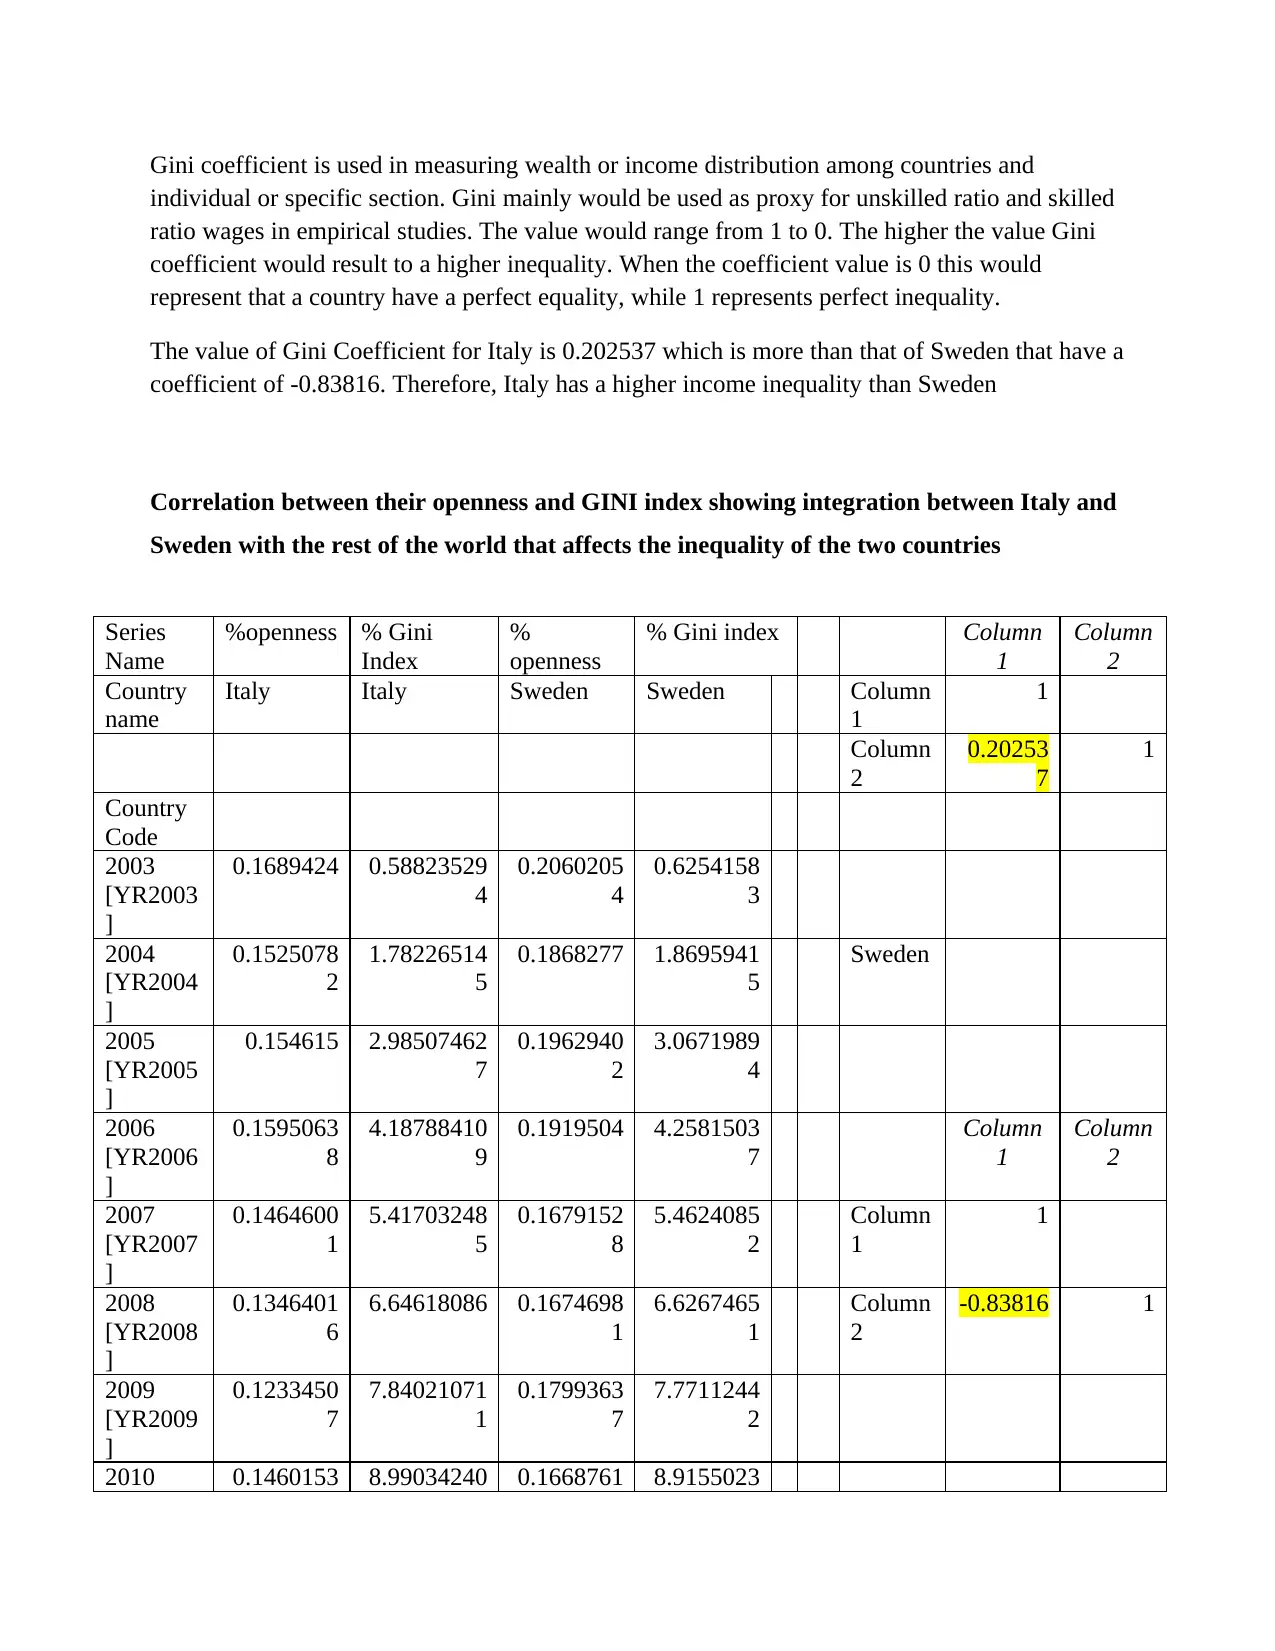
Gini coefficient is used in measuring wealth or income distribution among countries and
individual or specific section. Gini mainly would be used as proxy for unskilled ratio and skilled
ratio wages in empirical studies. The value would range from 1 to 0. The higher the value Gini
coefficient would result to a higher inequality. When the coefficient value is 0 this would
represent that a country have a perfect equality, while 1 represents perfect inequality.
The value of Gini Coefficient for Italy is 0.202537 which is more than that of Sweden that have a
coefficient of -0.83816. Therefore, Italy has a higher income inequality than Sweden
Correlation between their openness and GINI index showing integration between Italy and
Sweden with the rest of the world that affects the inequality of the two countries
Series
Name
%openness % Gini
Index
%
openness
% Gini index Column
1
Column
2
Country
name
Italy Italy Sweden Sweden Column
1
1
Column
2
0.20253
7
1
Country
Code
2003
[YR2003
]
0.1689424 0.58823529
4
0.2060205
4
0.6254158
3
2004
[YR2004
]
0.1525078
2
1.78226514
5
0.1868277 1.8695941
5
Sweden
2005
[YR2005
]
0.154615 2.98507462
7
0.1962940
2
3.0671989
4
2006
[YR2006
]
0.1595063
8
4.18788410
9
0.1919504 4.2581503
7
Column
1
Column
2
2007
[YR2007
]
0.1464600
1
5.41703248
5
0.1679152
8
5.4624085
2
Column
1
1
2008
[YR2008
]
0.1346401
6
6.64618086 0.1674698
1
6.6267465
1
Column
2
-0.83816 1
2009
[YR2009
]
0.1233450
7
7.84021071
1
0.1799363
7
7.7711244
2
2010 0.1460153 8.99034240 0.1668761 8.9155023
[YR2010
]
8 6 4 3
2011
[YR2011
]
0.1449939
9
10.1141352
1
0.1487777
1
10.053226
9
2012
[YR2012
]
0.1613853 11.2291483
8
0.1535248
7
11.184298
1
2013
[YR2013
]
0.1568169
6
12.3266022
8
0.1378387
6
12.288755
8
2014
[YR2014
]
0.1575283
1
13.4152765
6
0.1448975
4
13.386560
2
2015
[YR2015
]
0.1886065
5
14.4776119
4
0.1697246
3
14.491018
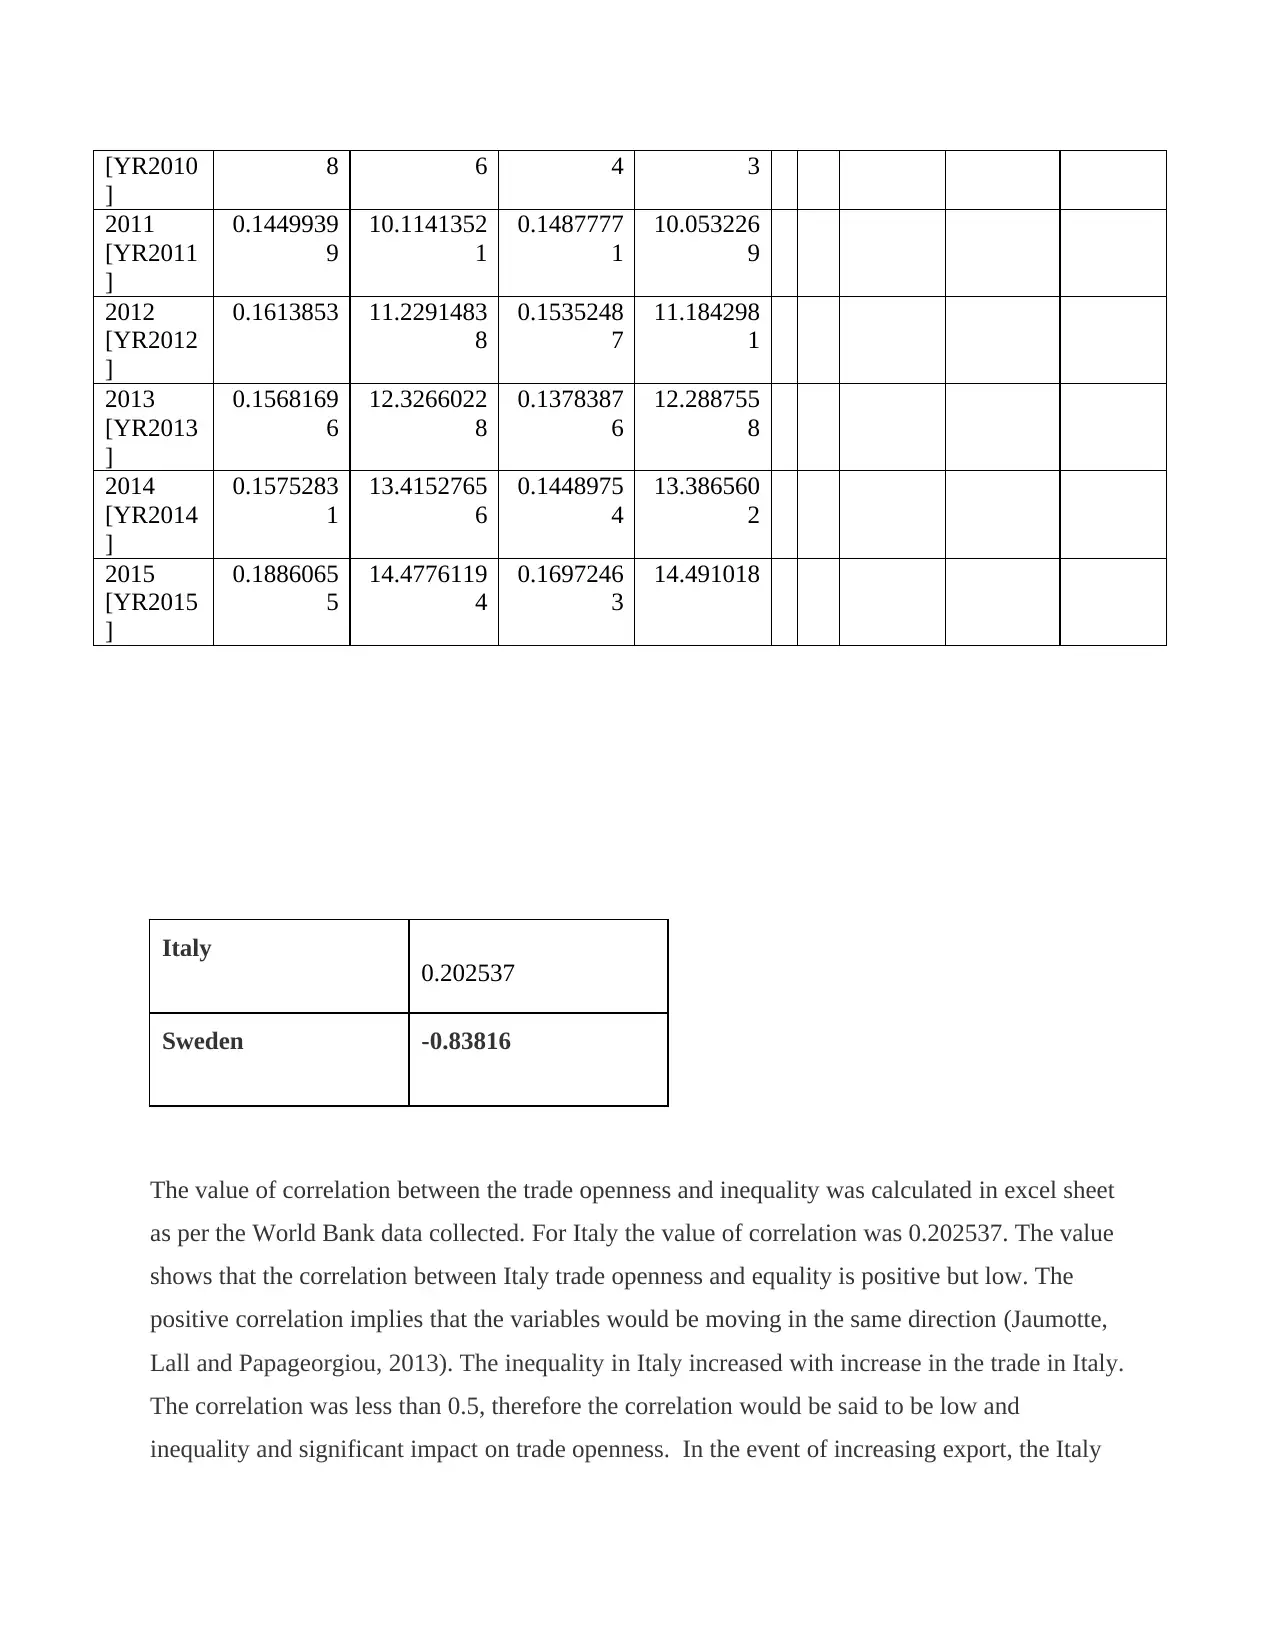
Italy 0.202537
Sweden -0.83816
The value of correlation between the trade openness and inequality was calculated in excel sheet
as per the World Bank data collected. For Italy the value of correlation was 0.202537. The value
shows that the correlation between Italy trade openness and equality is positive but low. The
positive correlation implies that the variables would be moving in the same direction (Jaumotte,
Lall and Papageorgiou, 2013). The inequality in Italy increased with increase in the trade in Italy.
The correlation was less than 0.5, therefore the correlation would be said to be low and
inequality and significant impact on trade openness. In the event of increasing export, the Italy
]
8 6 4 3
2011
[YR2011
]
0.1449939
9
10.1141352
1
0.1487777
1
10.053226
9
2012
[YR2012
]
0.1613853 11.2291483
8
0.1535248
7
11.184298
1
2013
[YR2013
]
0.1568169
6
12.3266022
8
0.1378387
6
12.288755
8
2014
[YR2014
]
0.1575283
1
13.4152765
6
0.1448975
4
13.386560
2
2015
[YR2015
]
0.1886065
5
14.4776119
4
0.1697246
3
14.491018
Italy 0.202537
Sweden -0.83816
The value of correlation between the trade openness and inequality was calculated in excel sheet
as per the World Bank data collected. For Italy the value of correlation was 0.202537. The value
shows that the correlation between Italy trade openness and equality is positive but low. The
positive correlation implies that the variables would be moving in the same direction (Jaumotte,
Lall and Papageorgiou, 2013). The inequality in Italy increased with increase in the trade in Italy.
The correlation was less than 0.5, therefore the correlation would be said to be low and
inequality and significant impact on trade openness. In the event of increasing export, the Italy
Secure Best Marks with AI Grader
Need help grading? Try our AI Grader for instant feedback on your assignments.
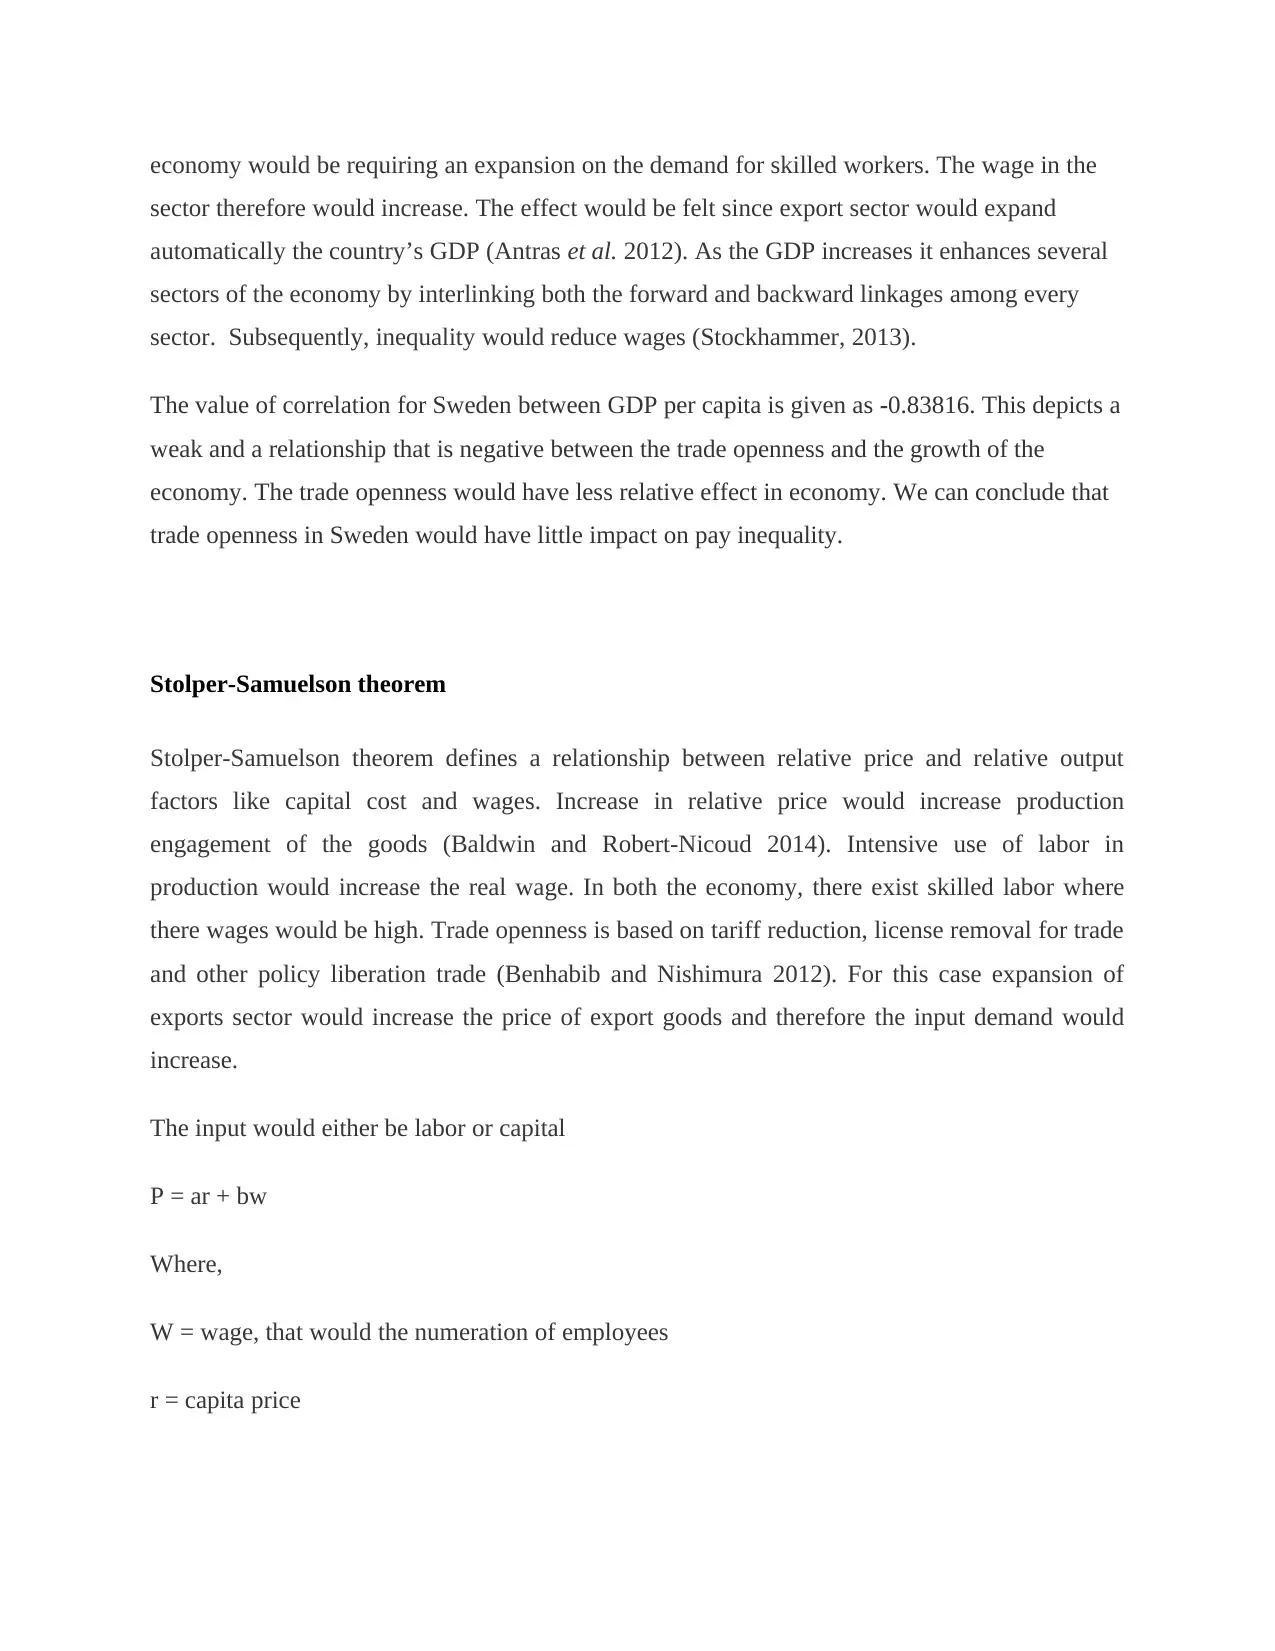
economy would be requiring an expansion on the demand for skilled workers. The wage in the
sector therefore would increase. The effect would be felt since export sector would expand
automatically the country’s GDP (Antras et al. 2012). As the GDP increases it enhances several
sectors of the economy by interlinking both the forward and backward linkages among every
sector. Subsequently, inequality would reduce wages (Stockhammer, 2013).
The value of correlation for Sweden between GDP per capita is given as -0.83816. This depicts a
weak and a relationship that is negative between the trade openness and the growth of the
economy. The trade openness would have less relative effect in economy. We can conclude that
trade openness in Sweden would have little impact on pay inequality.
Stolper-Samuelson theorem
Stolper-Samuelson theorem defines a relationship between relative price and relative output
factors like capital cost and wages. Increase in relative price would increase production
engagement of the goods (Baldwin and Robert-Nicoud 2014). Intensive use of labor in
production would increase the real wage. In both the economy, there exist skilled labor where
there wages would be high. Trade openness is based on tariff reduction, license removal for trade
and other policy liberation trade (Benhabib and Nishimura 2012). For this case expansion of
exports sector would increase the price of export goods and therefore the input demand would
increase.
The input would either be labor or capital
P = ar + bw
Where,
W = wage, that would the numeration of employees
r = capita price
At first, expansion of the sector was due to a factor of relative abundant that had low cost. After
trade openness, an increase in intensively use demand inputs raised the factor price. Therefore,
we expect that if Italy and Sweden adopt labor intensive in their production, trade openness
would be expected to increase subsequently the price of labor (PL/PC). Therefore, increasing
country wage rate would equalize the price factor of the country. The difference in high wage
rate in different sectors would reduce inequality in wage.
The data for Italy and Sweden showed that wage inequality in the economy industrial sector was
low but steadier in Italy as compared to Sweden. The relationship between the variables adhered
to Stolper-Samuelson theory to a particular extends. In Italy the wage rate was higher and labor
was low (Baldwin and Robert-Nicoud 2014). Therefore, increasing export growth rate would not
mitigate the pay inequality in Italy.
Furthermore, industrial inequality in Sweden decreased over time, but not based to increase in
trade. The country is experiencing a fall in open trade throughout the period. It is projected that
the demand for labor would surpass the labor supply. In accordance Stolper-Samuelson theorem,
the trade openness and pay inequality would have a negative correlation and this how Sweden
was experiencing.
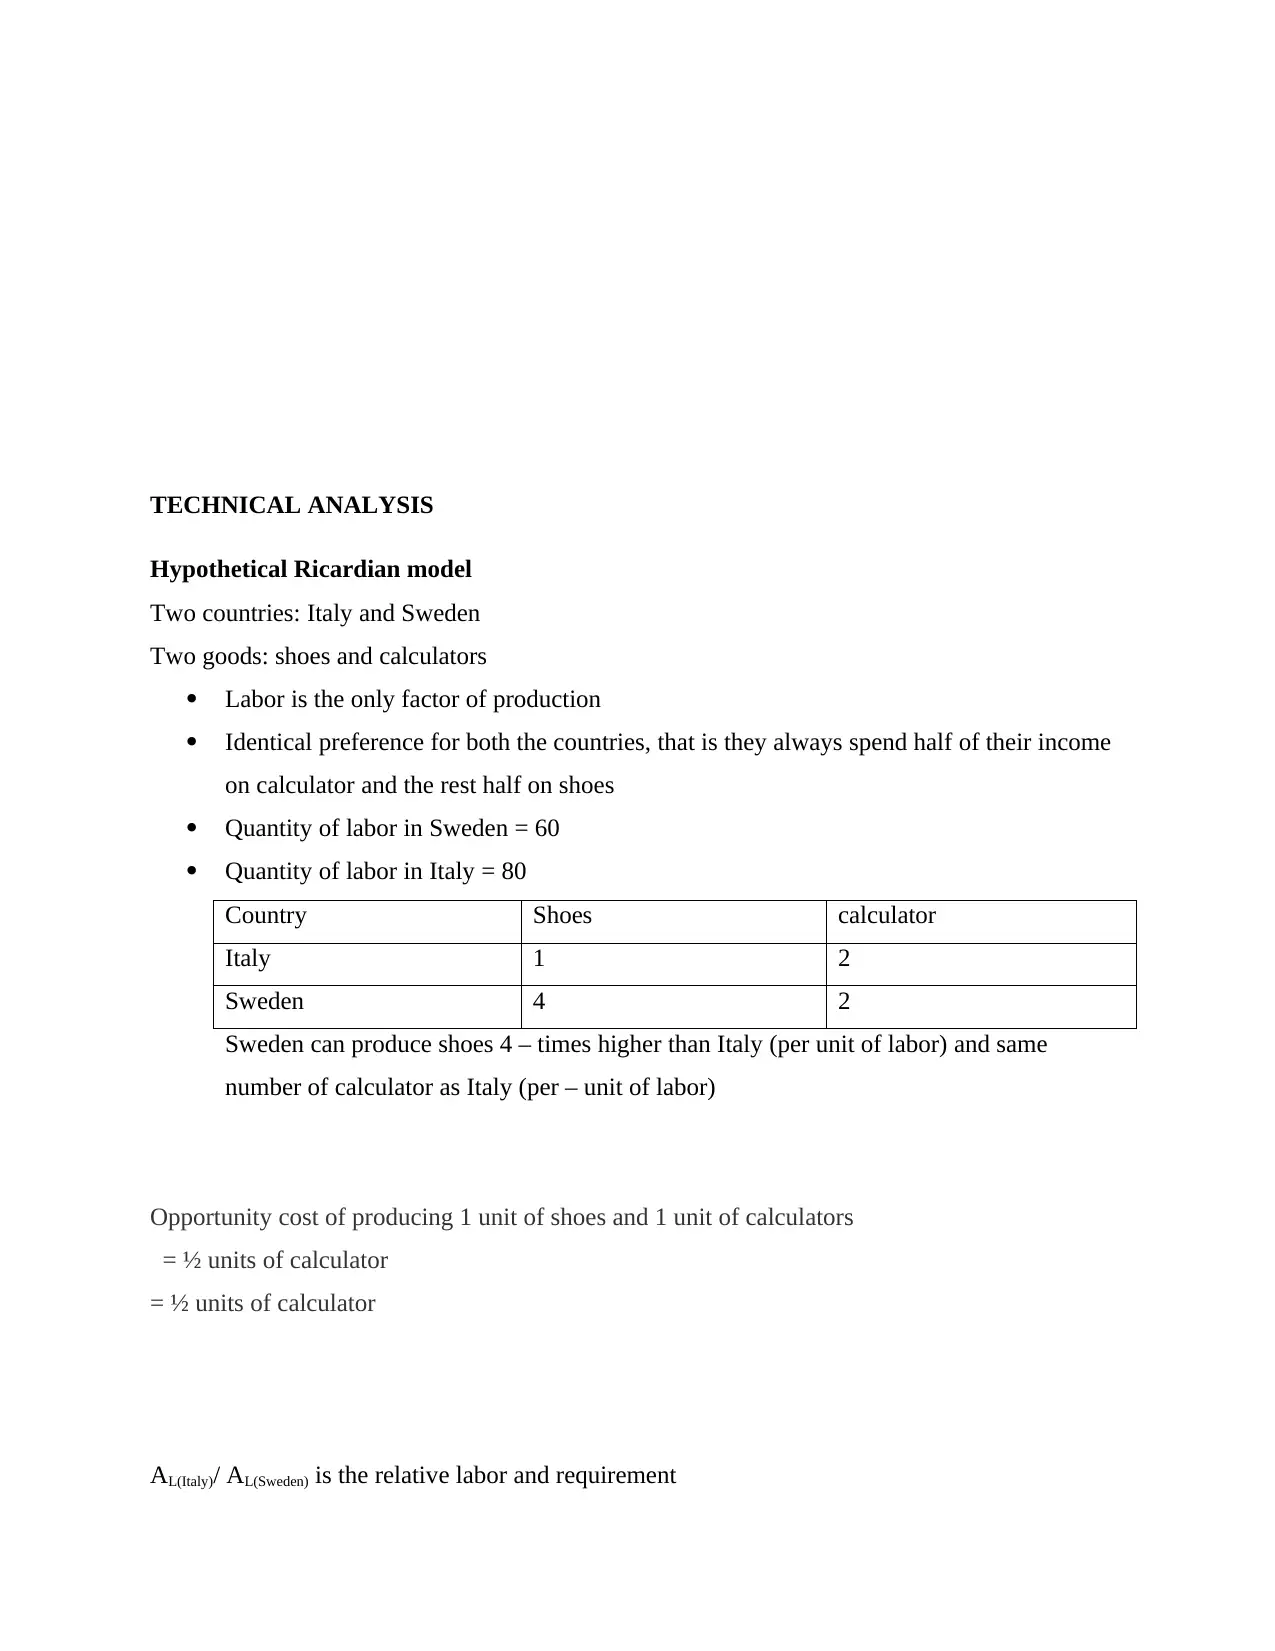
TECHNICAL ANALYSIS
Hypothetical Ricardian model
Two countries: Italy and Sweden
Two goods: shoes and calculators
Labor is the only factor of production
Identical preference for both the countries, that is they always spend half of their income
on calculator and the rest half on shoes
Quantity of labor in Sweden = 60
Quantity of labor in Italy = 80
Country Shoes calculator
Italy 1 2
Sweden 4 2
Sweden can produce shoes 4 – times higher than Italy (per unit of labor) and same
number of calculator as Italy (per – unit of labor)
Opportunity cost of producing 1 unit of shoes and 1 unit of calculators
= ½ units of calculator
= ½ units of calculator
AL(Italy)/ AL(Sweden) is the relative labor and requirement
Paraphrase This Document
Need a fresh take? Get an instant paraphrase of this document with our AI Paraphraser
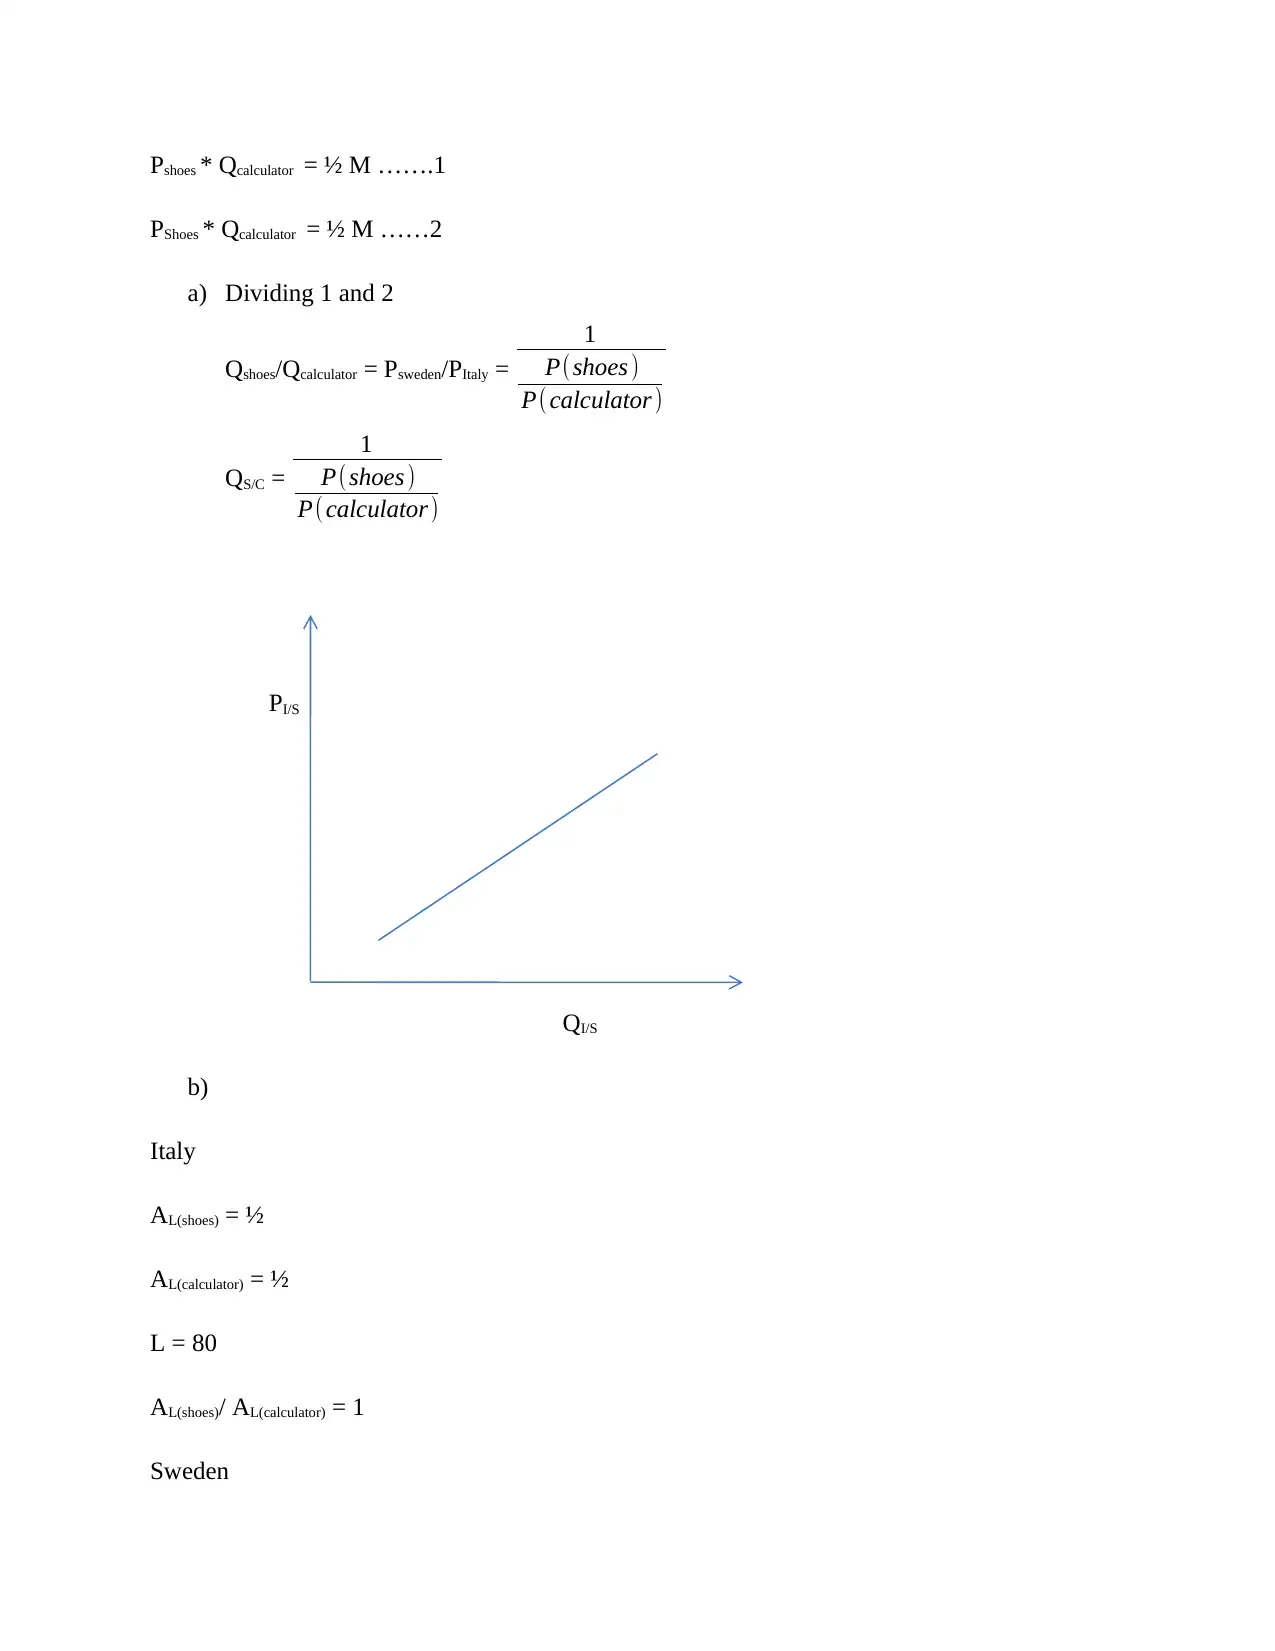
Pshoes * Qcalculator = ½ M …….1
PShoes * Qcalculator = ½ M ……2
a) Dividing 1 and 2
Qshoes/Qcalculator = Psweden/PItaly =
1
P(shoes )
P( calculator)
QS/C =
1
P(shoes )
P( calculator)
PI/S
QI/S
b)
Italy
AL(shoes) = ½
AL(calculator) = ½
L = 80
AL(shoes)/ AL(calculator) = 1
Sweden
PShoes * Qcalculator = ½ M ……2
a) Dividing 1 and 2
Qshoes/Qcalculator = Psweden/PItaly =
1
P(shoes )
P( calculator)
QS/C =
1
P(shoes )
P( calculator)
PI/S
QI/S
b)
Italy
AL(shoes) = ½
AL(calculator) = ½
L = 80
AL(shoes)/ AL(calculator) = 1
Sweden
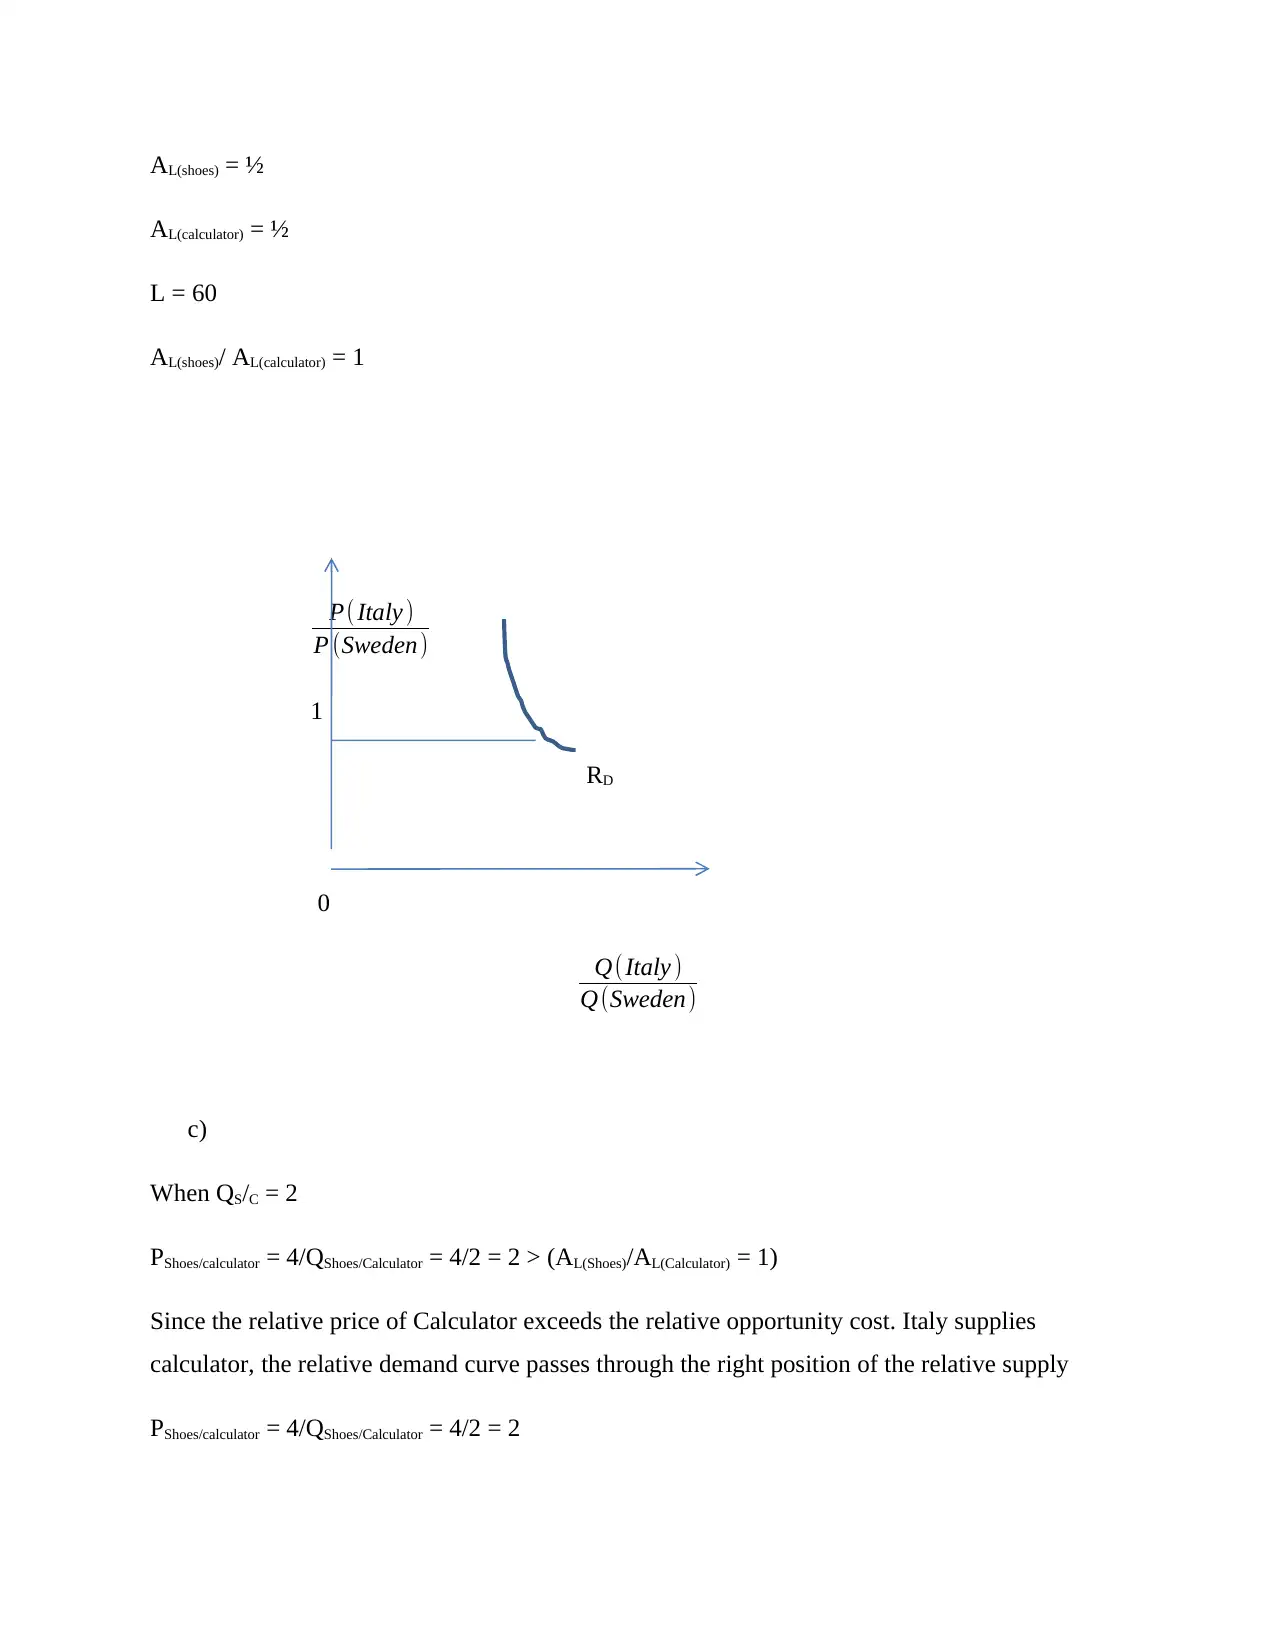
AL(shoes) = ½
AL(calculator) = ½
L = 60
AL(shoes)/ AL(calculator) = 1
P(Italy )
P (Sweden)
1
RD
0
Q(Italy )
Q(Sweden)
c)
When QS/C = 2
PShoes/calculator = 4/QShoes/Calculator = 4/2 = 2 > (AL(Shoes)/AL(Calculator) = 1)
Since the relative price of Calculator exceeds the relative opportunity cost. Italy supplies
calculator, the relative demand curve passes through the right position of the relative supply
PShoes/calculator = 4/QShoes/Calculator = 4/2 = 2
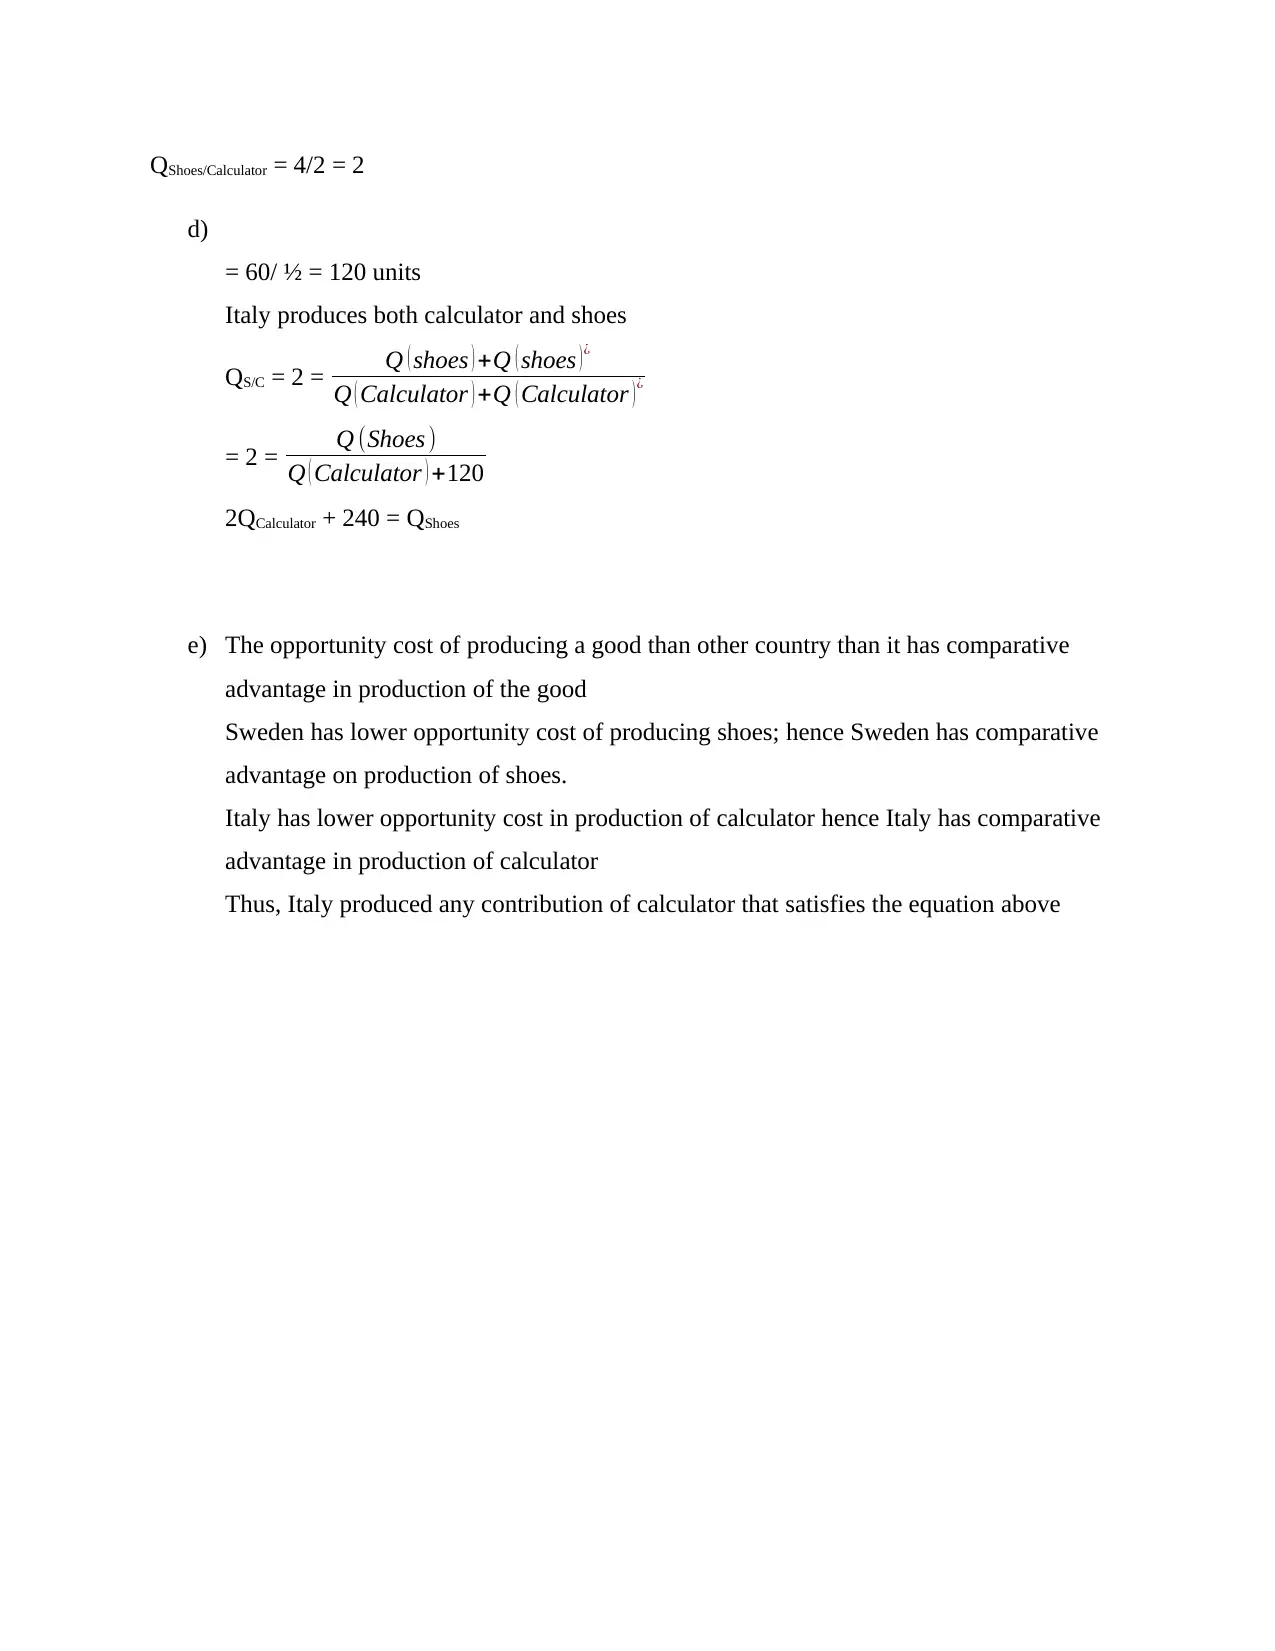
QShoes/Calculator = 4/2 = 2
d)
= 60/ ½ = 120 units
Italy produces both calculator and shoes
QS/C = 2 = Q ( shoes ) +Q ( shoes ) ¿
Q ( Calculator ) +Q ( Calculator ) ¿
= 2 = Q (Shoes )
Q ( Calculator ) +120
2QCalculator + 240 = QShoes
e) The opportunity cost of producing a good than other country than it has comparative
advantage in production of the good
Sweden has lower opportunity cost of producing shoes; hence Sweden has comparative
advantage on production of shoes.
Italy has lower opportunity cost in production of calculator hence Italy has comparative
advantage in production of calculator
Thus, Italy produced any contribution of calculator that satisfies the equation above
Secure Best Marks with AI Grader
Need help grading? Try our AI Grader for instant feedback on your assignments.
References
Jaumotte, F., Lall, S. and Papageorgiou, C., 2013. Rising income inequality: technology, or trade
and financial globalization?. IMF Economic Review,61(2), pp.271-309.
Antras, P., Chor, D., Fally, T. and Hillberry, R., 2012. Measuring the upstreamness of production
and trade flows. The American Economic Review, 102(3), pp.412-416.
Stockhammer, E., 2013. Why have wage shares fallen. ILO, Conditions of Work and
Employment Series, (35).
Baldwin, R. and Robert-Nicoud, F., 2014. Trade-in-goods and trade-in-tasks: An integrating
framework. Journal of International Economics, 92(1), pp.51-62.
Benhabib, J. and Nishimura, K., 2012. Indeterminacy and sunspots with constant returns.
In Nonlinear Dynamics in Equilibrium Models (pp. 311-346). Springer Berlin Heidelberg.
1 out of 11


Your All-in-One AI-Powered Toolkit for Academic Success.
+13062052269
info@desklib.com
Available 24*7 on WhatsApp / Email
![[object Object]](/_next/static/media/star-bottom.7253800d.svg)
Unlock your academic potential
© 2024 | Zucol Services PVT LTD | All rights reserved.