Data Analysis and Forecasting: Kuala Lumpur Wind Speed Project
VerifiedAdded on 2021/02/21
|11
|1311
|78
Project
AI Summary
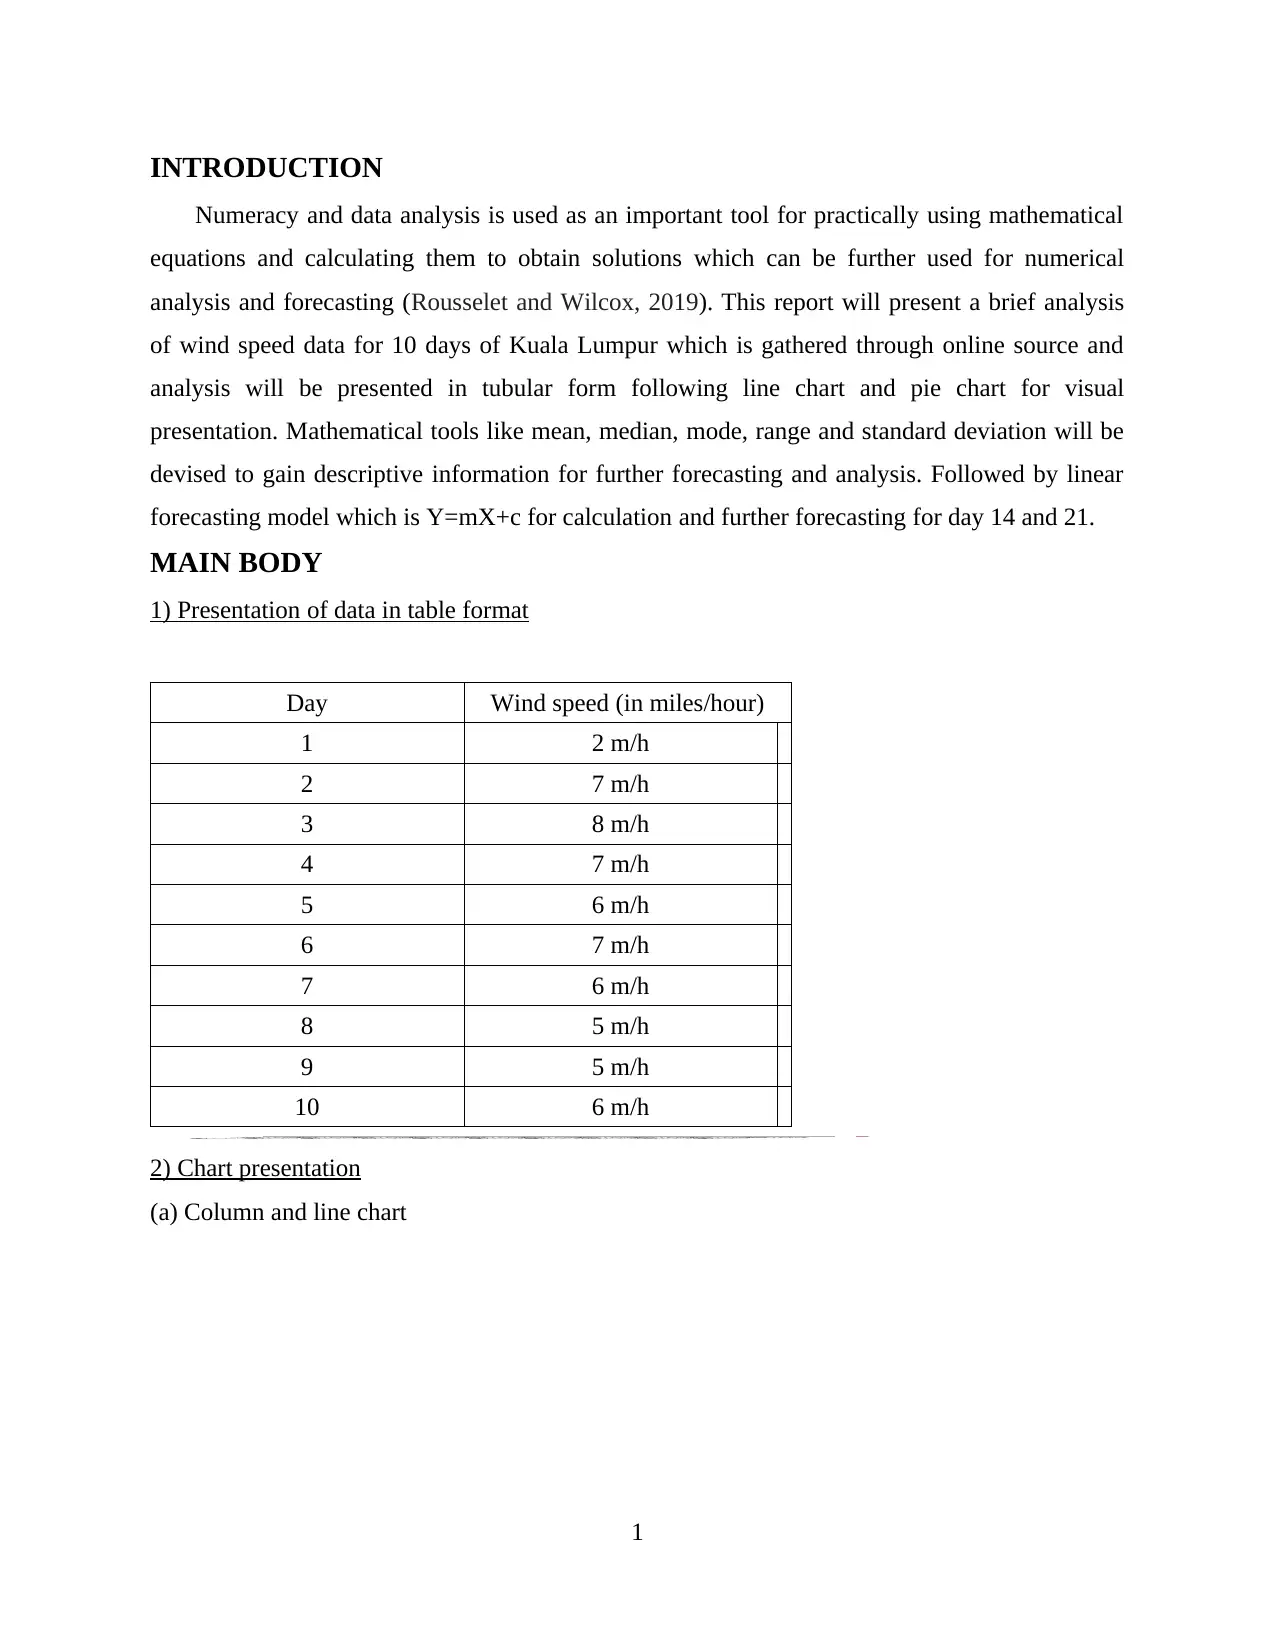
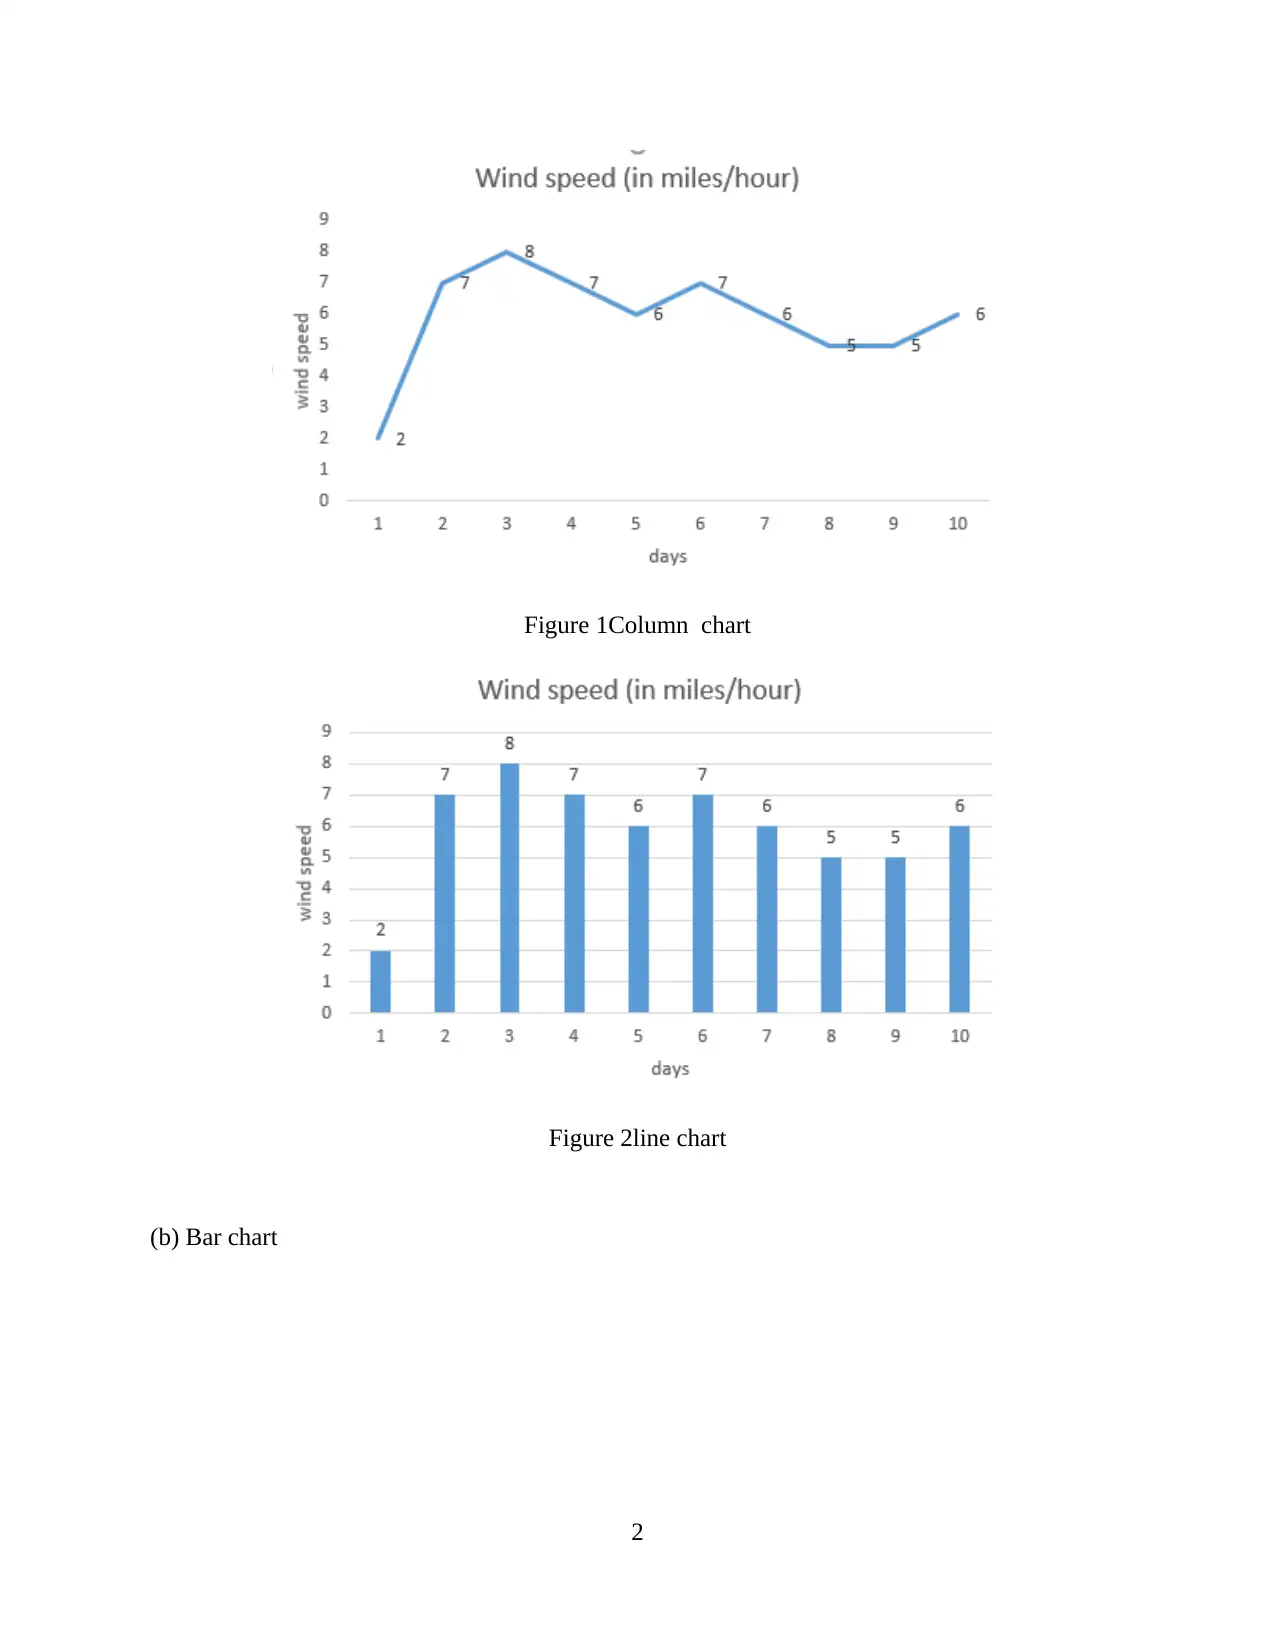
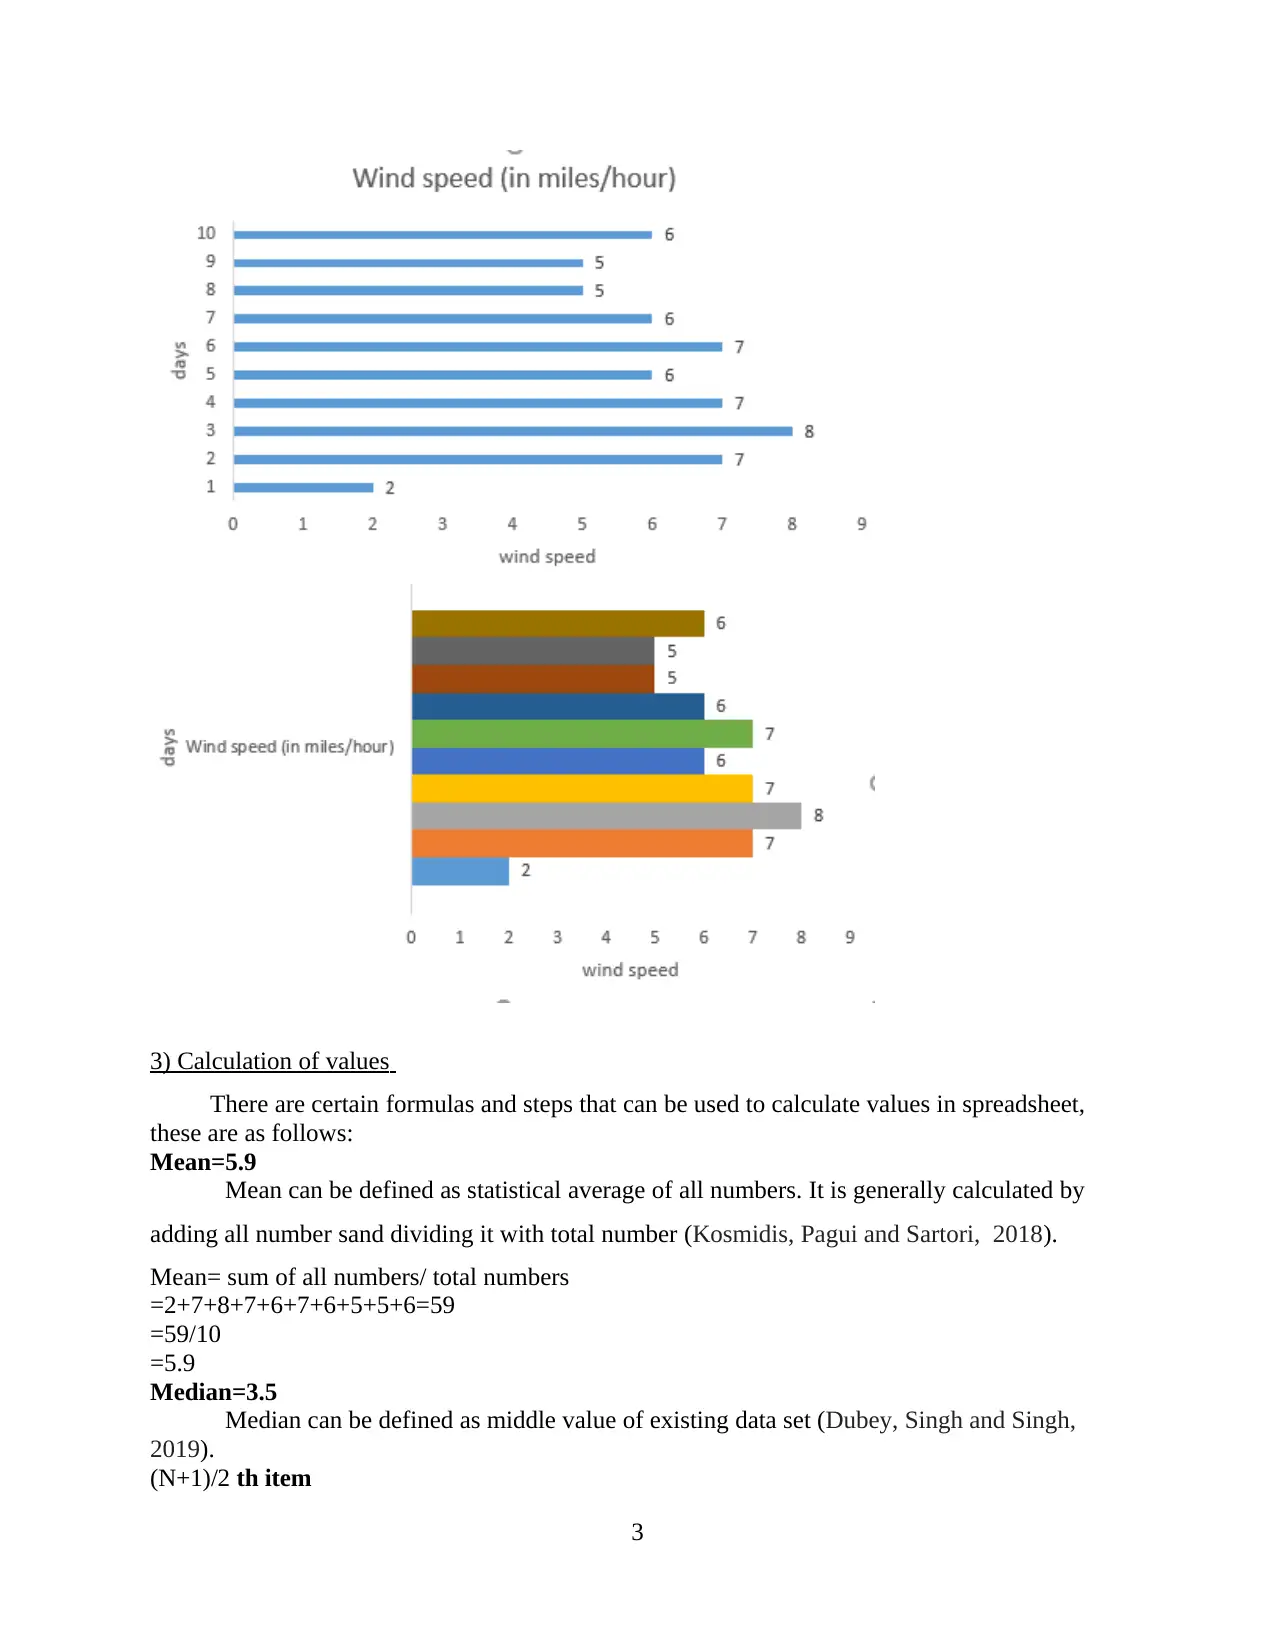
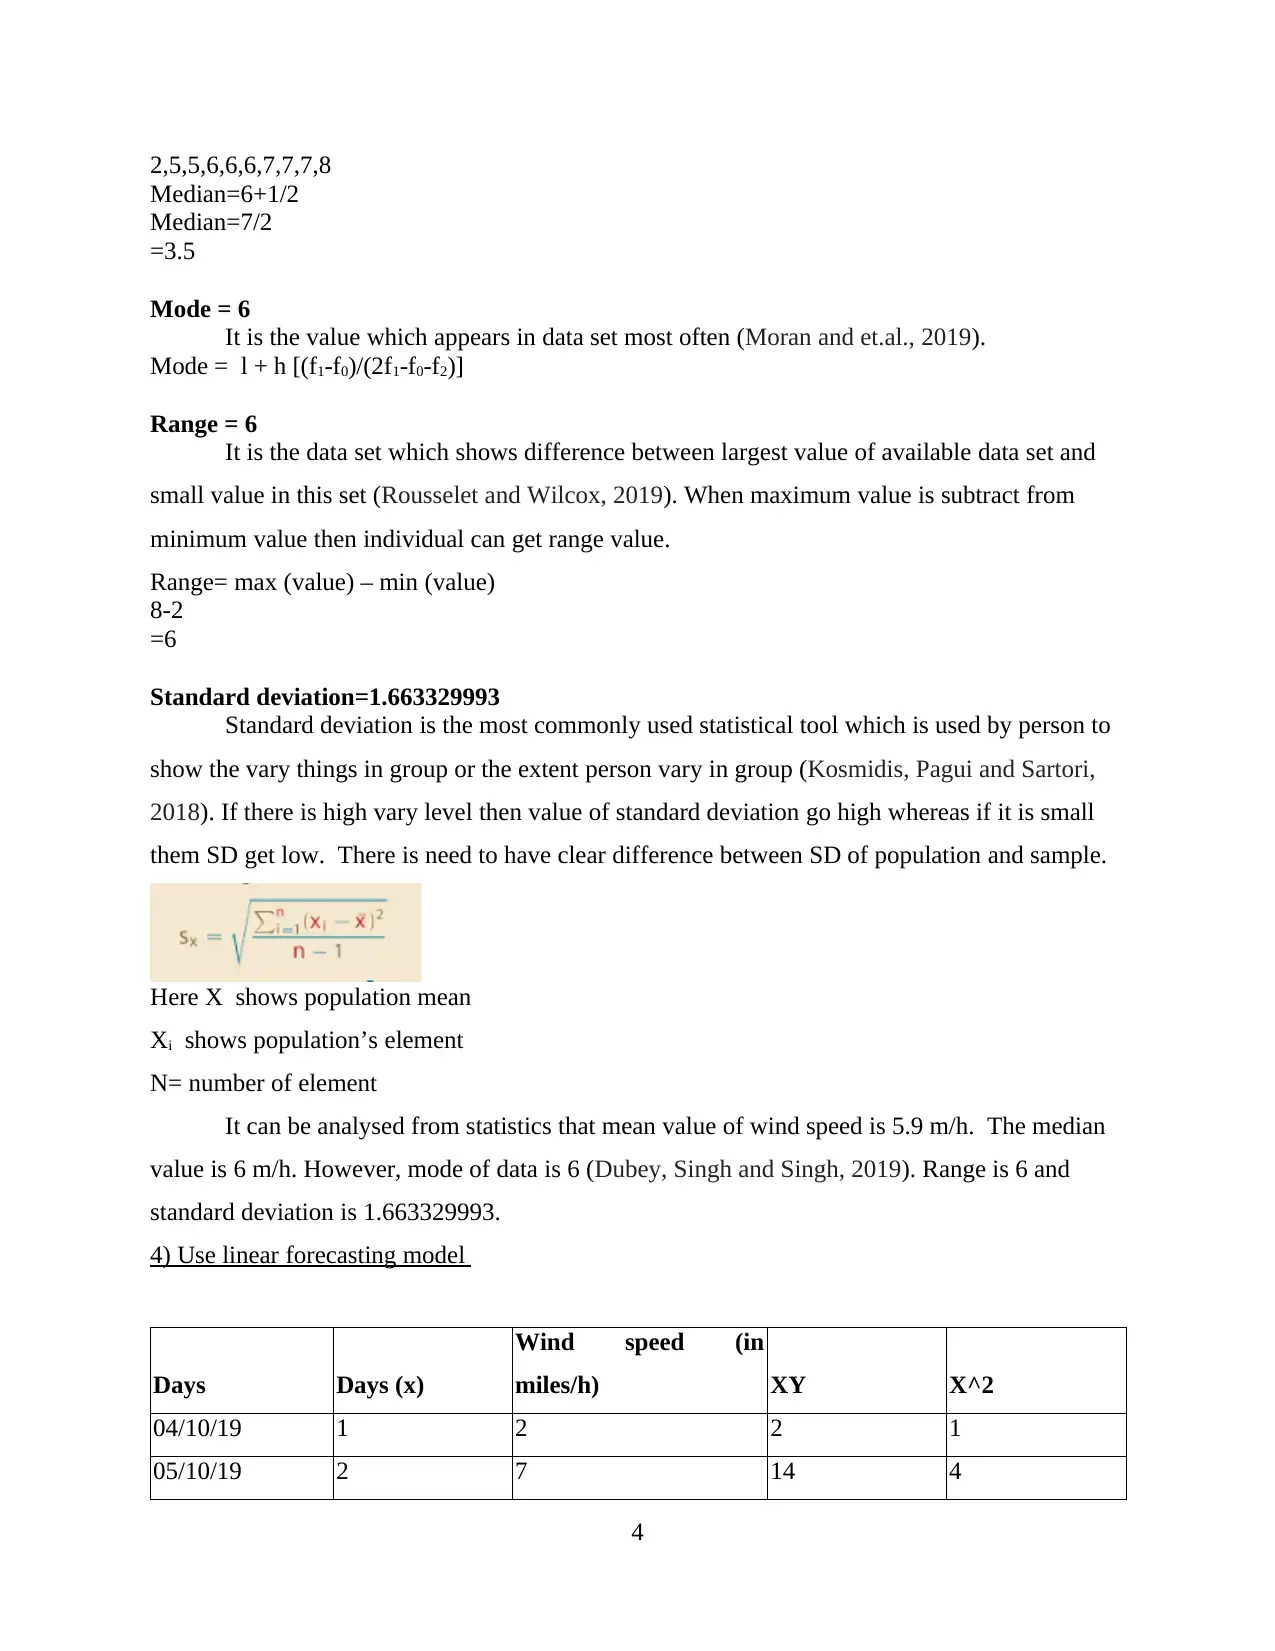
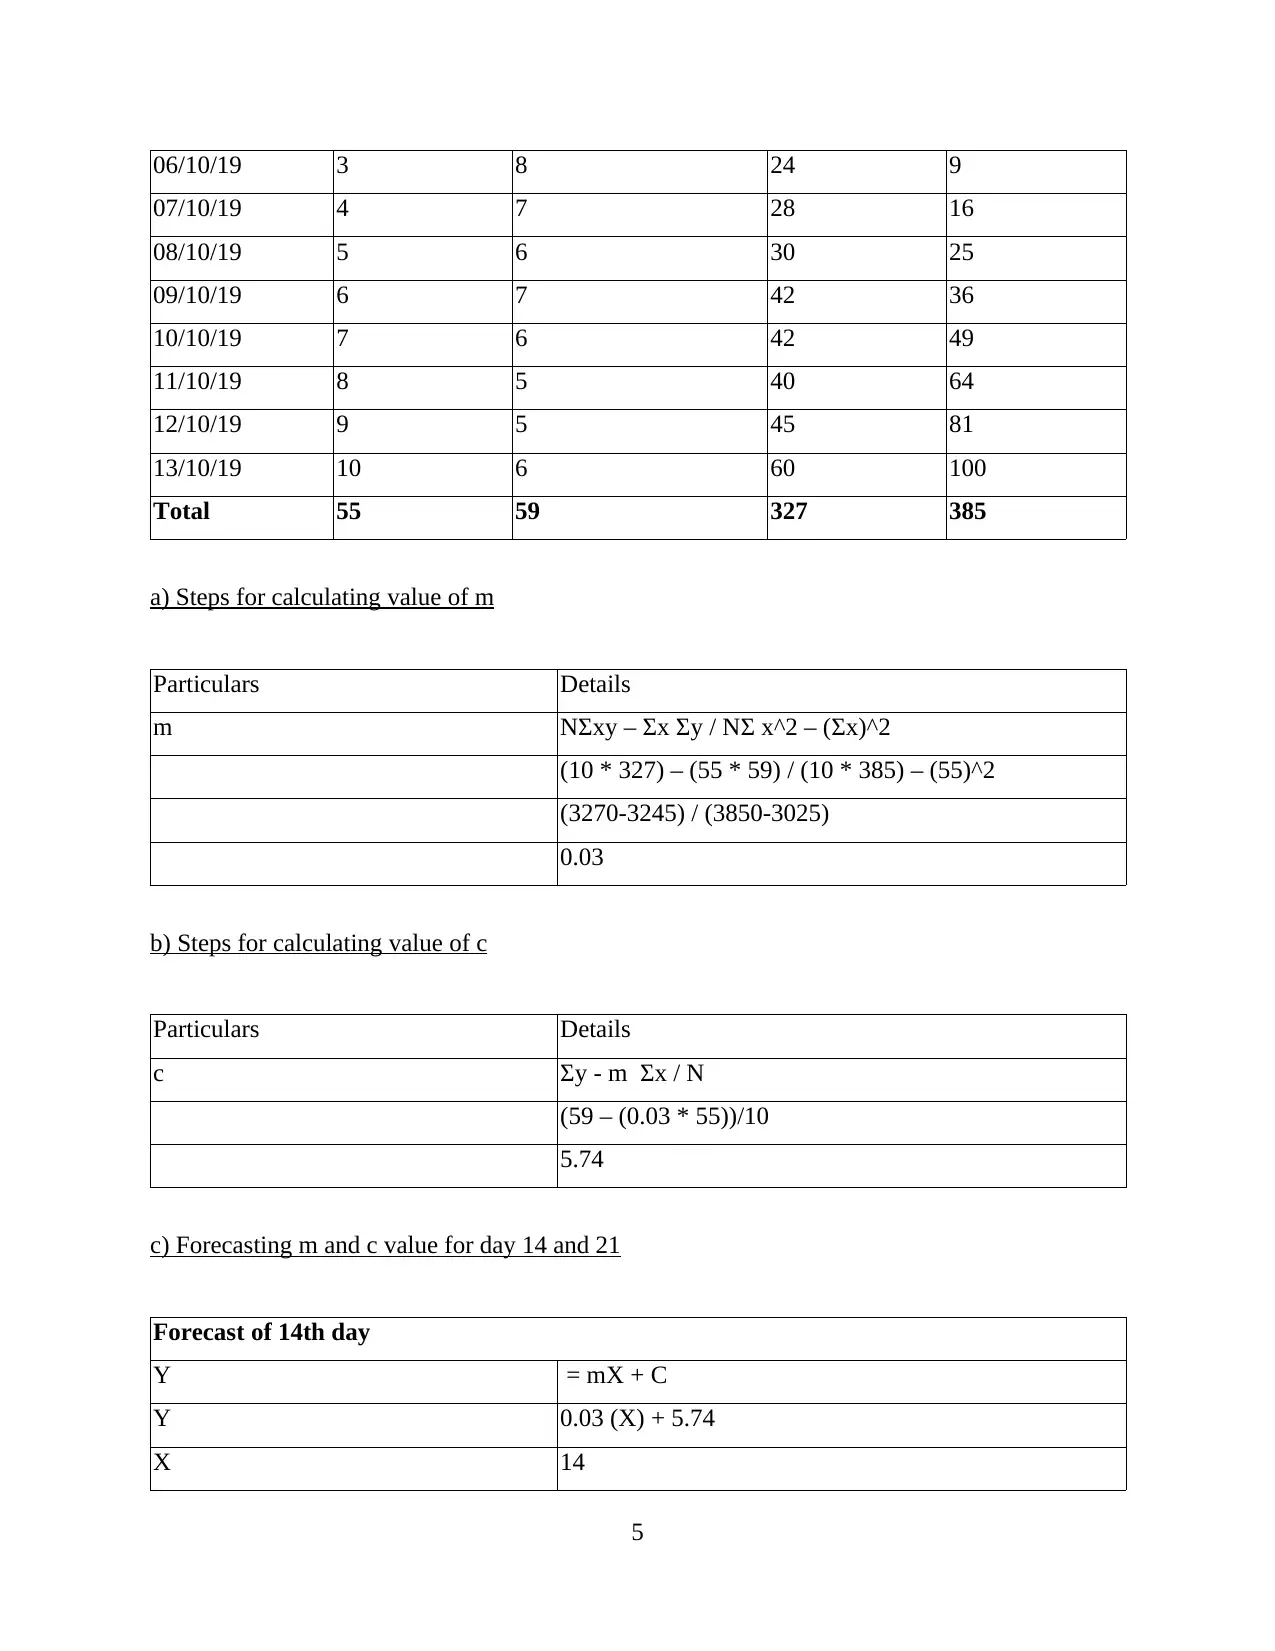
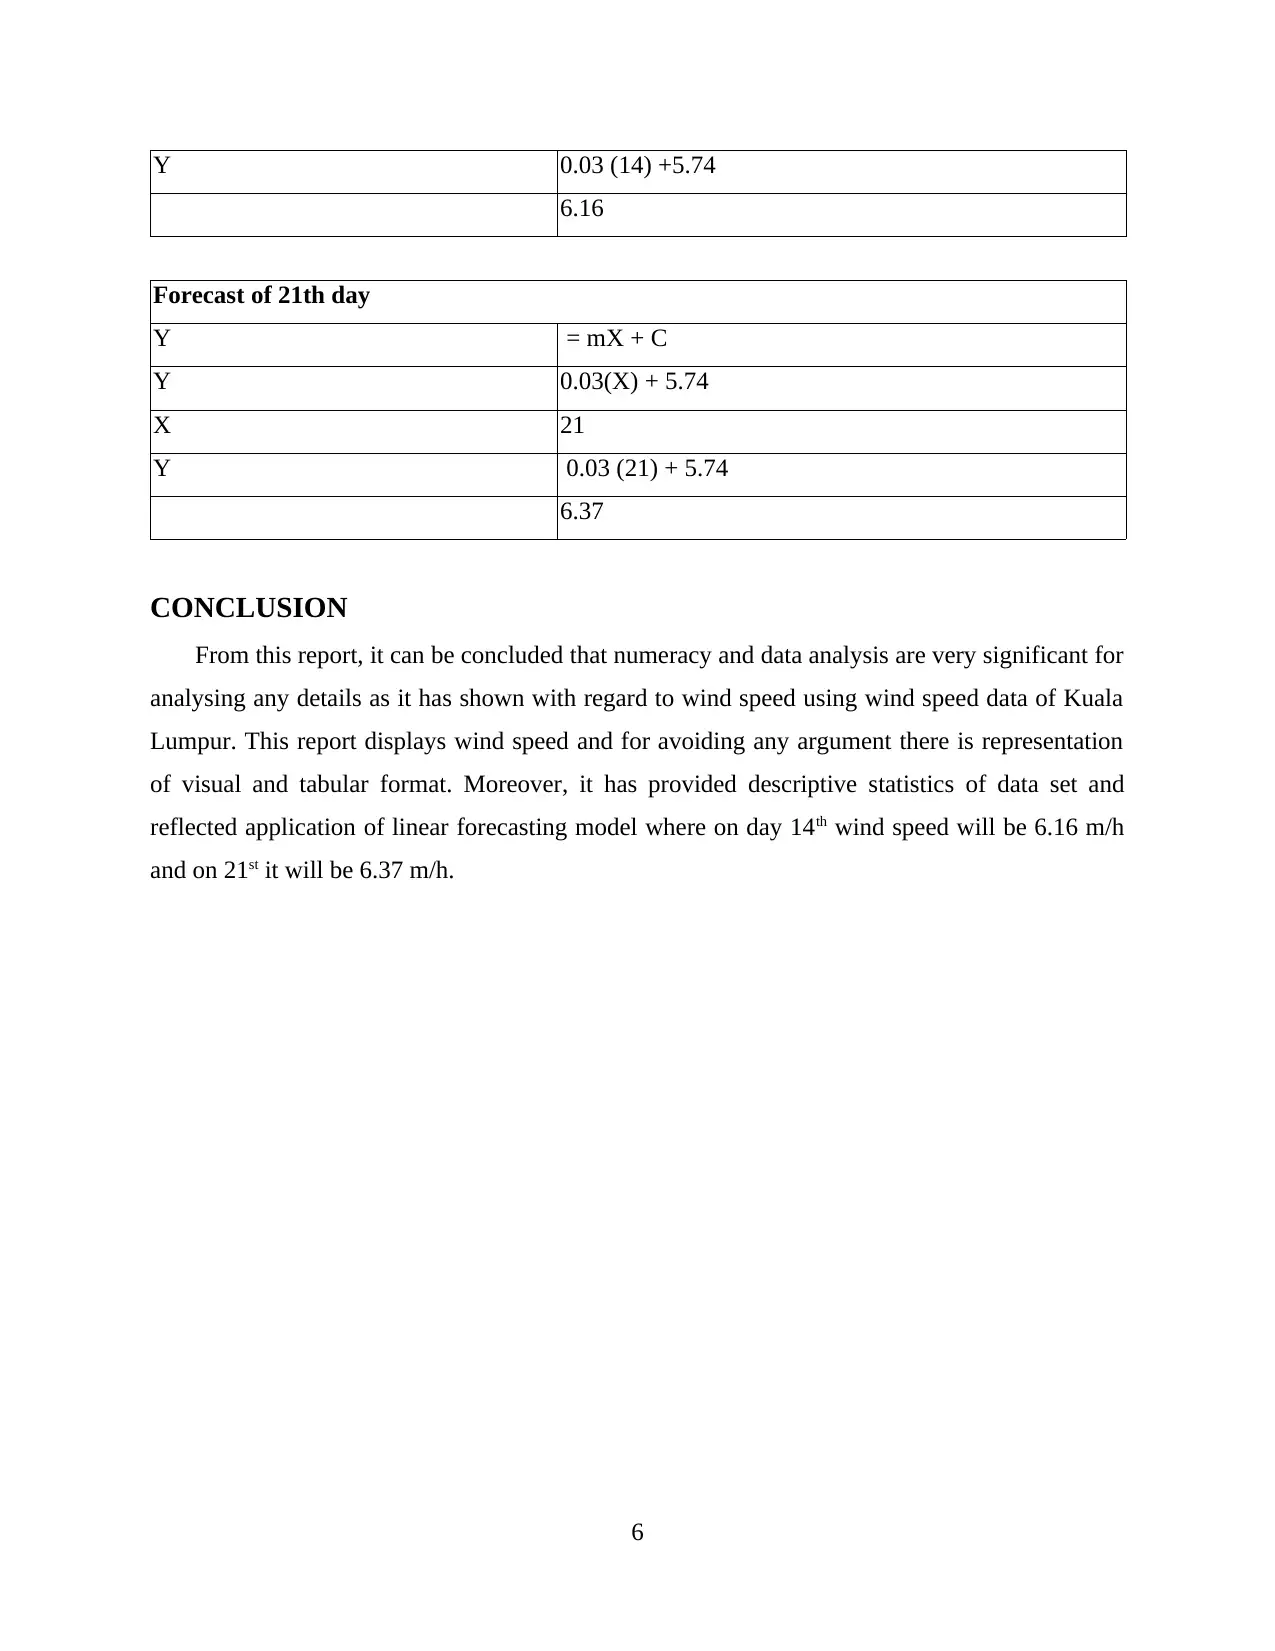
This project analyzes wind speed data from Kuala Lumpur over a 10-day period. The analysis begins with presenting the data in tabular format and is followed by various chart presentations, including column, line, and bar charts for visual representation. Descriptive statistics such as mean, median, mode, range, and standard deviation are calculated to provide insights into the data. The project then employs a linear forecasting model (Y=mX+c) to forecast wind speeds for days 14 and 21. The steps for calculating the values of 'm' and 'c' are detailed, and the predicted wind speeds for the specified days are provided. The report concludes that data analysis and numeracy are crucial for analyzing and forecasting data, as demonstrated by the wind speed analysis project, offering visual and tabular representations. The project provides a comprehensive approach to data analysis, incorporating various statistical techniques and forecasting models to predict future wind speeds.


1 out of 11
Related Documents


Your All-in-One AI-Powered Toolkit for Academic Success.
+13062052269
info@desklib.com
Available 24*7 on WhatsApp / Email
![[object Object]](/_next/static/media/star-bottom.7253800d.svg)
Copyright © 2020–2026 A2Z Services. All Rights Reserved. Developed and managed by ZUCOL.