BABS Foundation: Data Analysis and Forecasting Report (Numeracy)
VerifiedAdded on 2023/01/17
|9
|1472
|59
Report
AI Summary
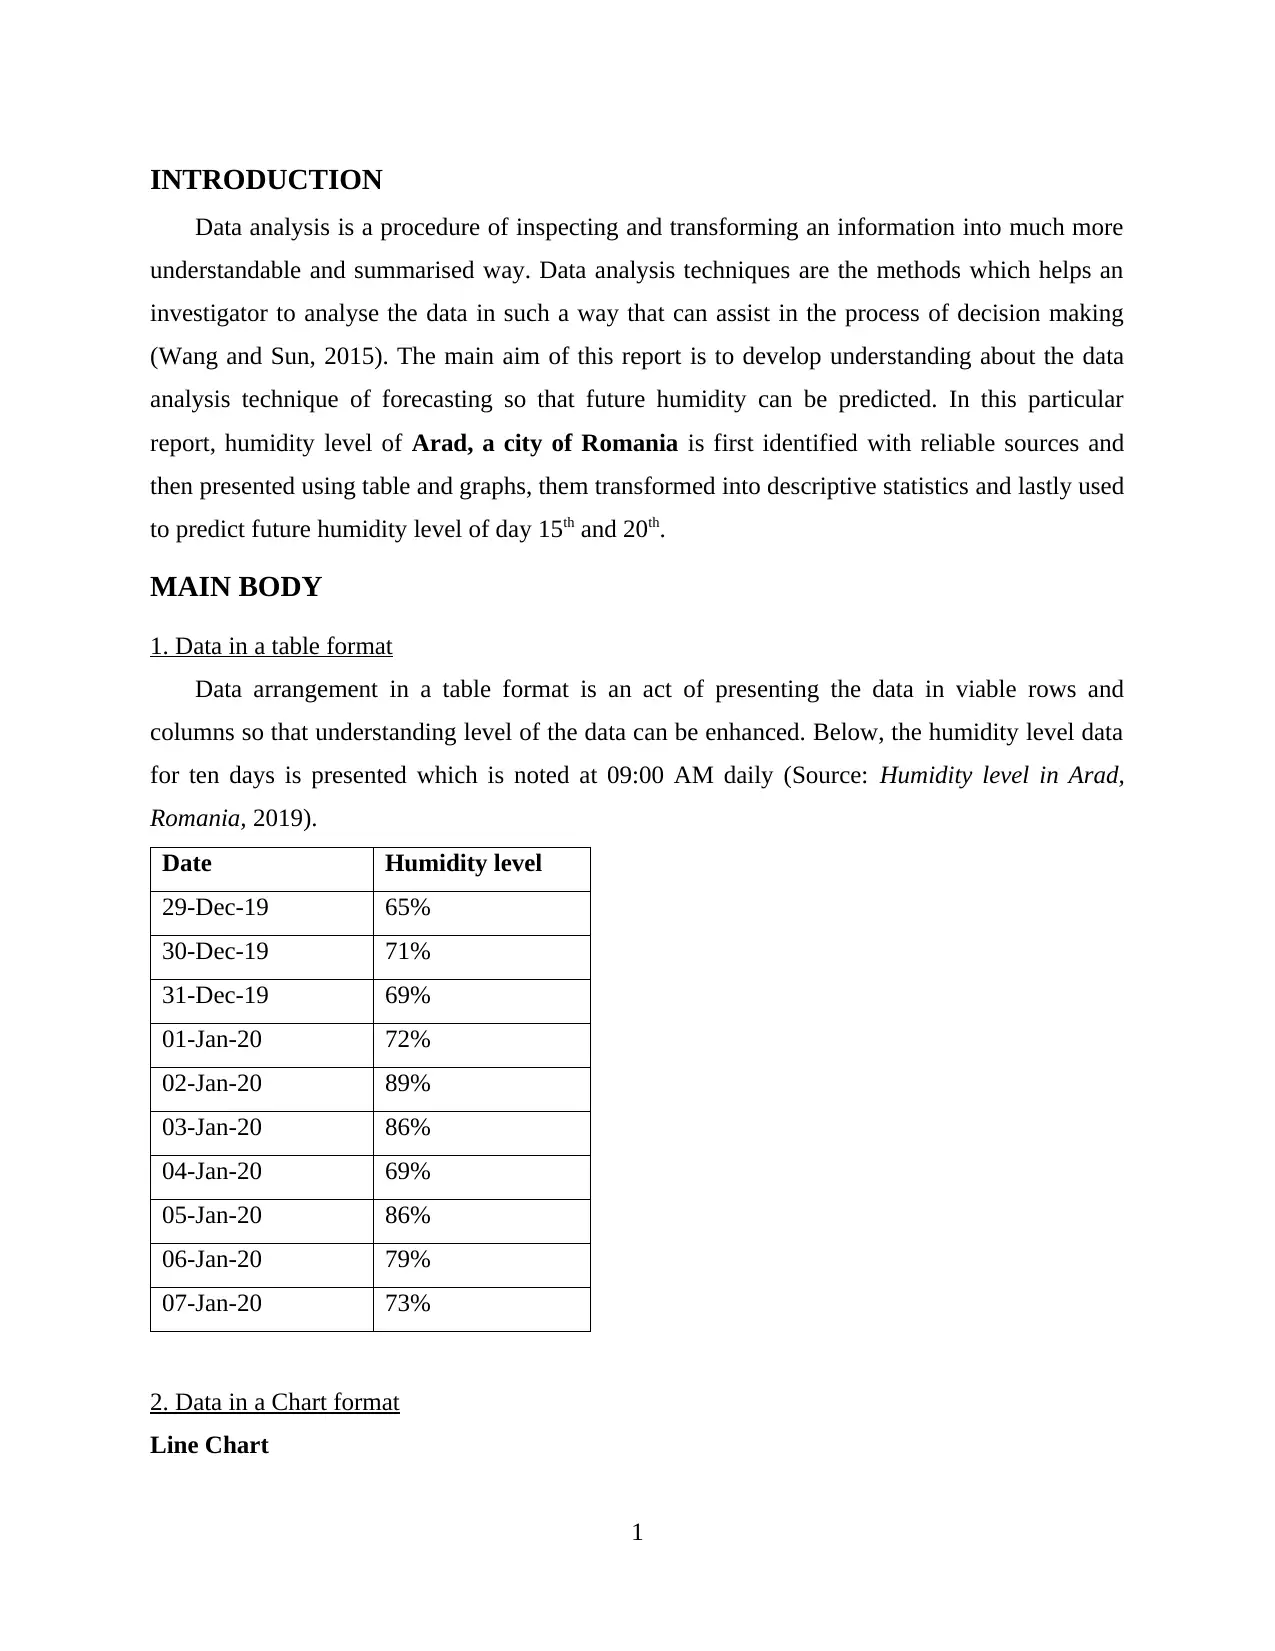
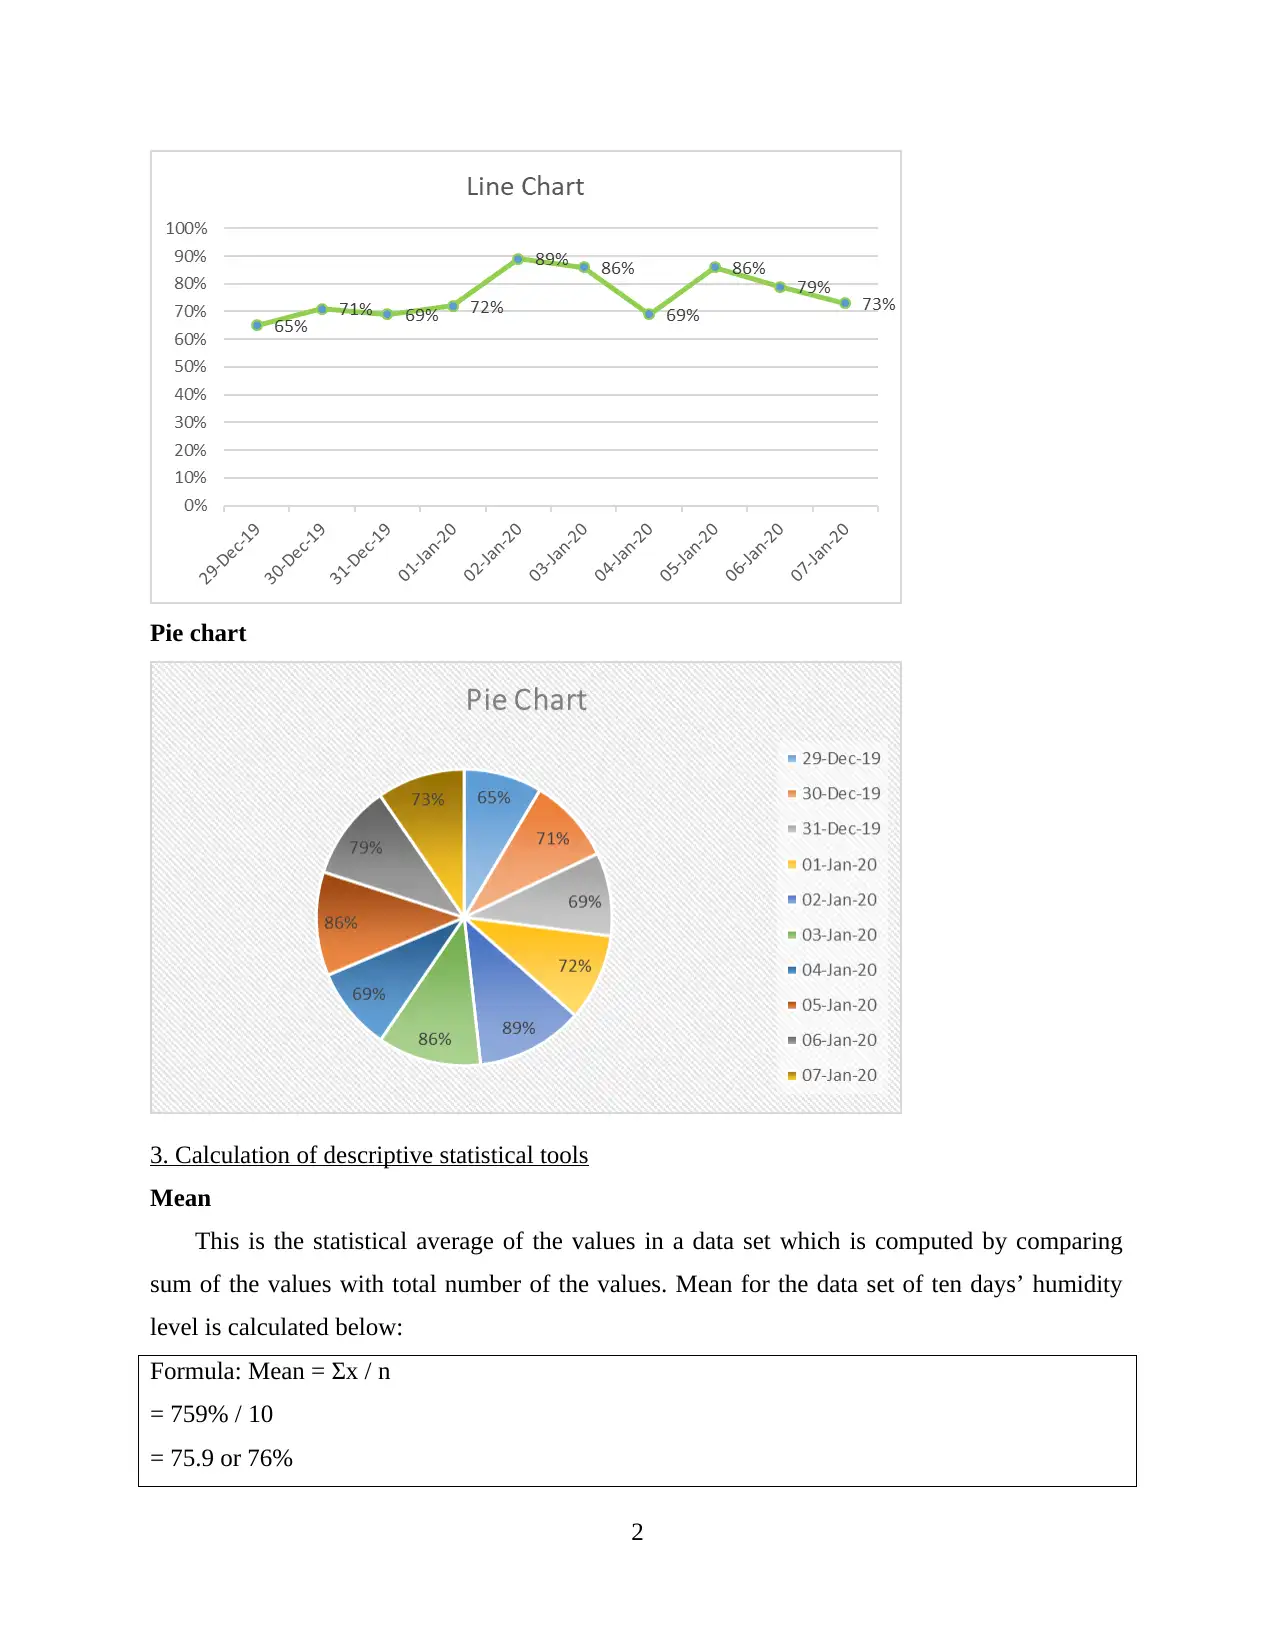
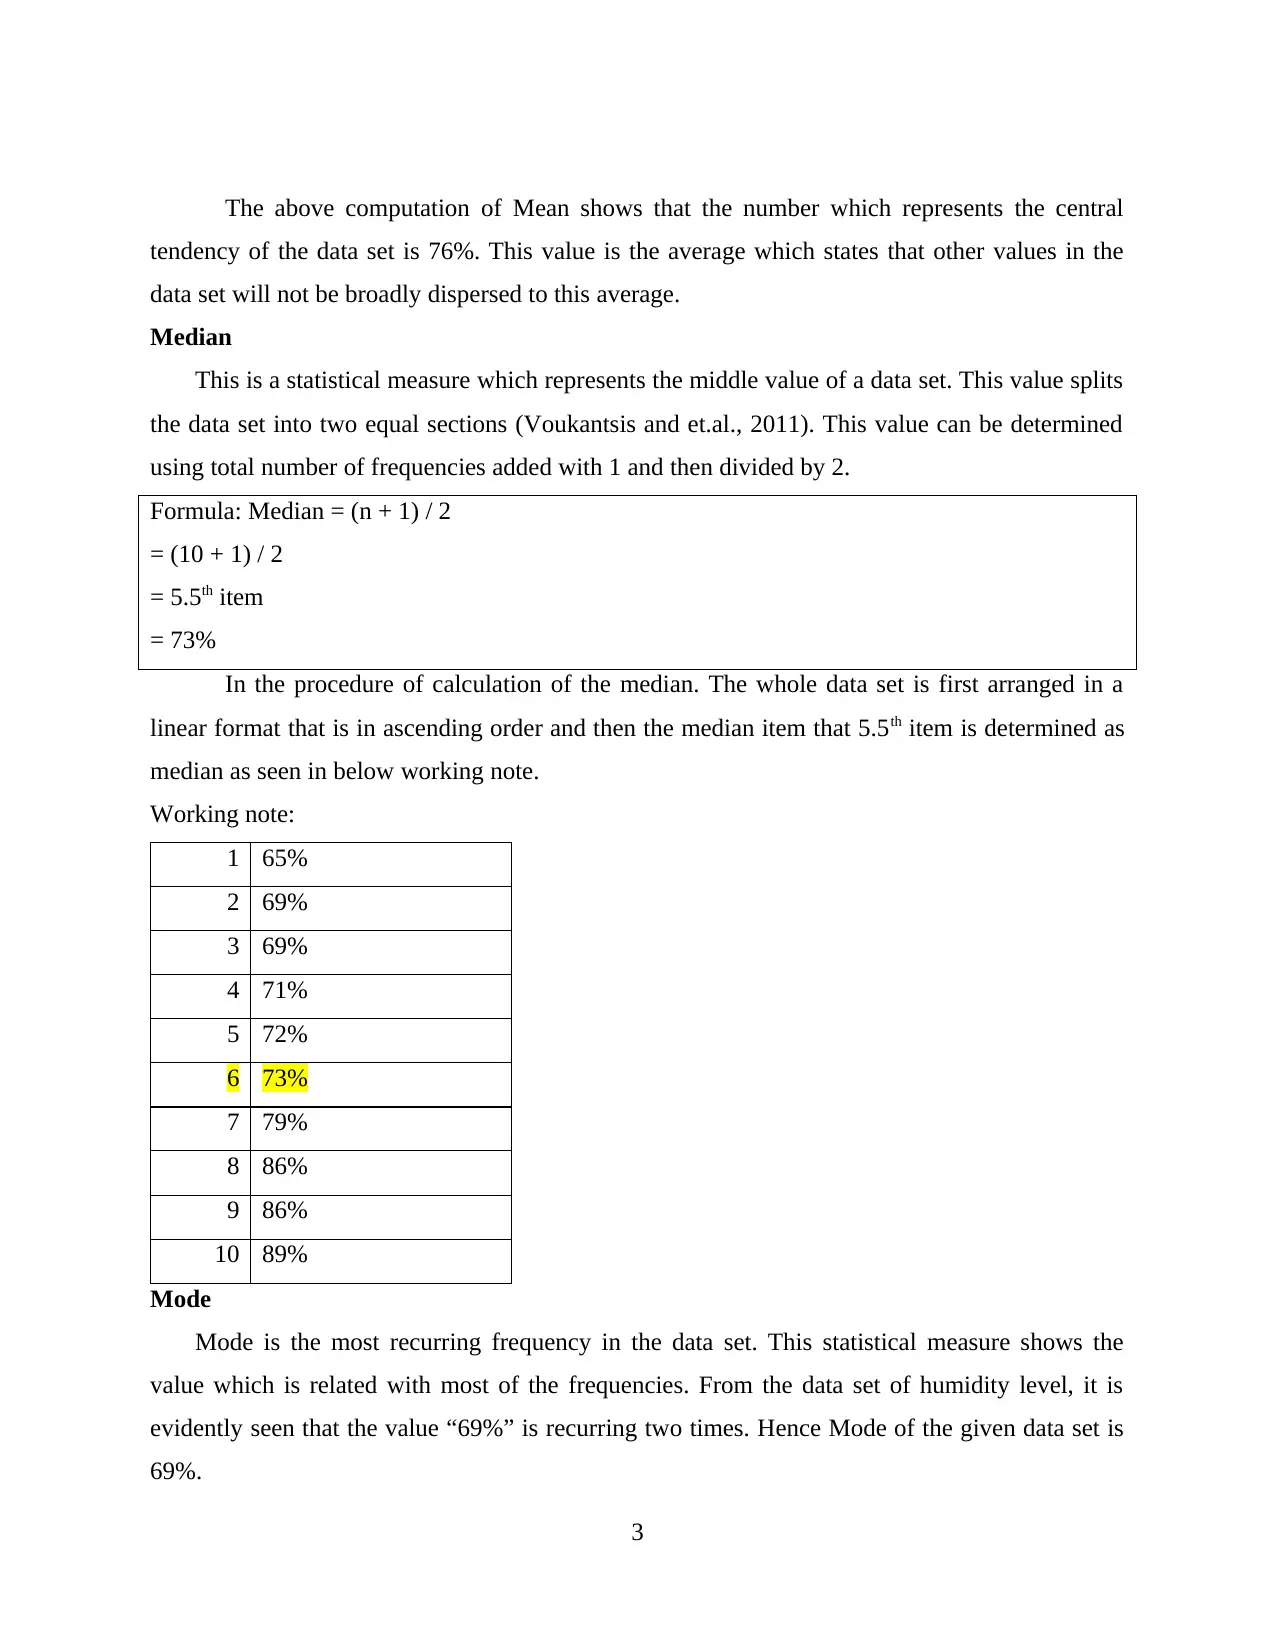
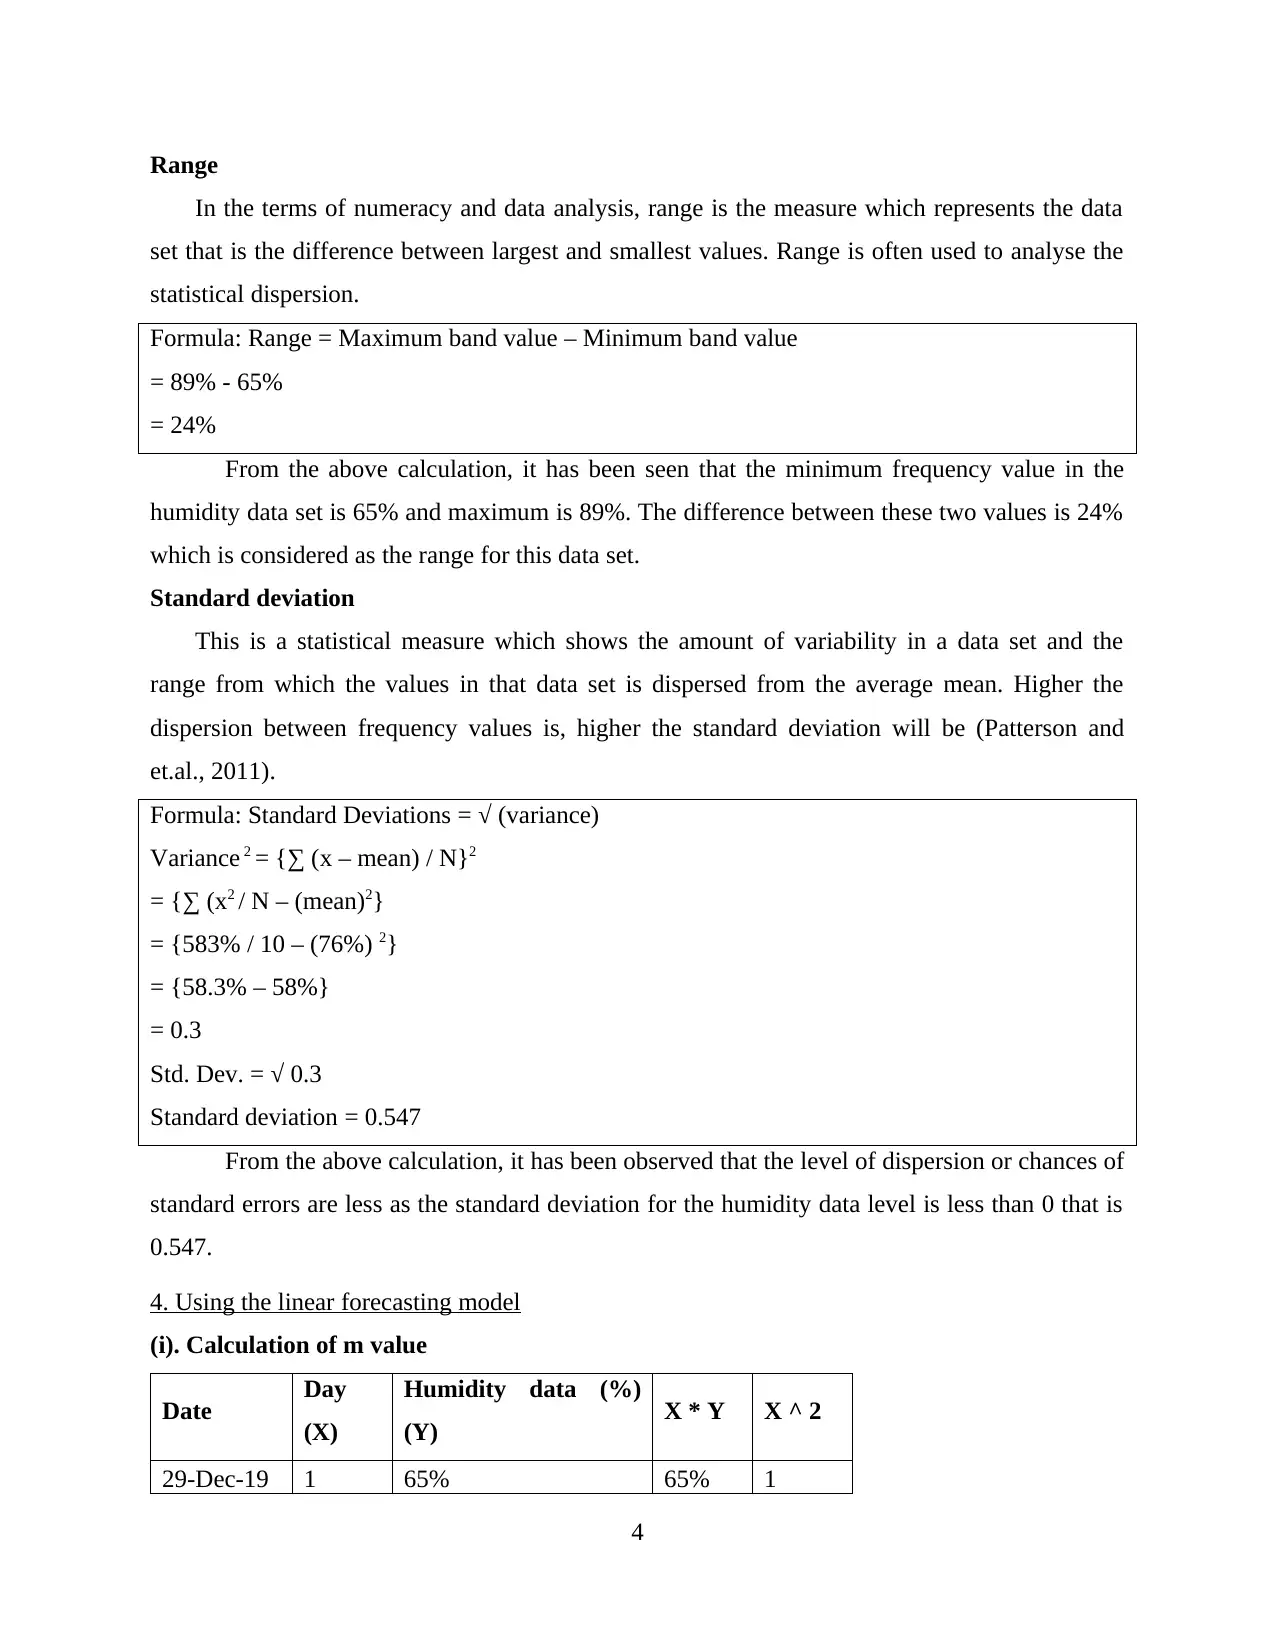
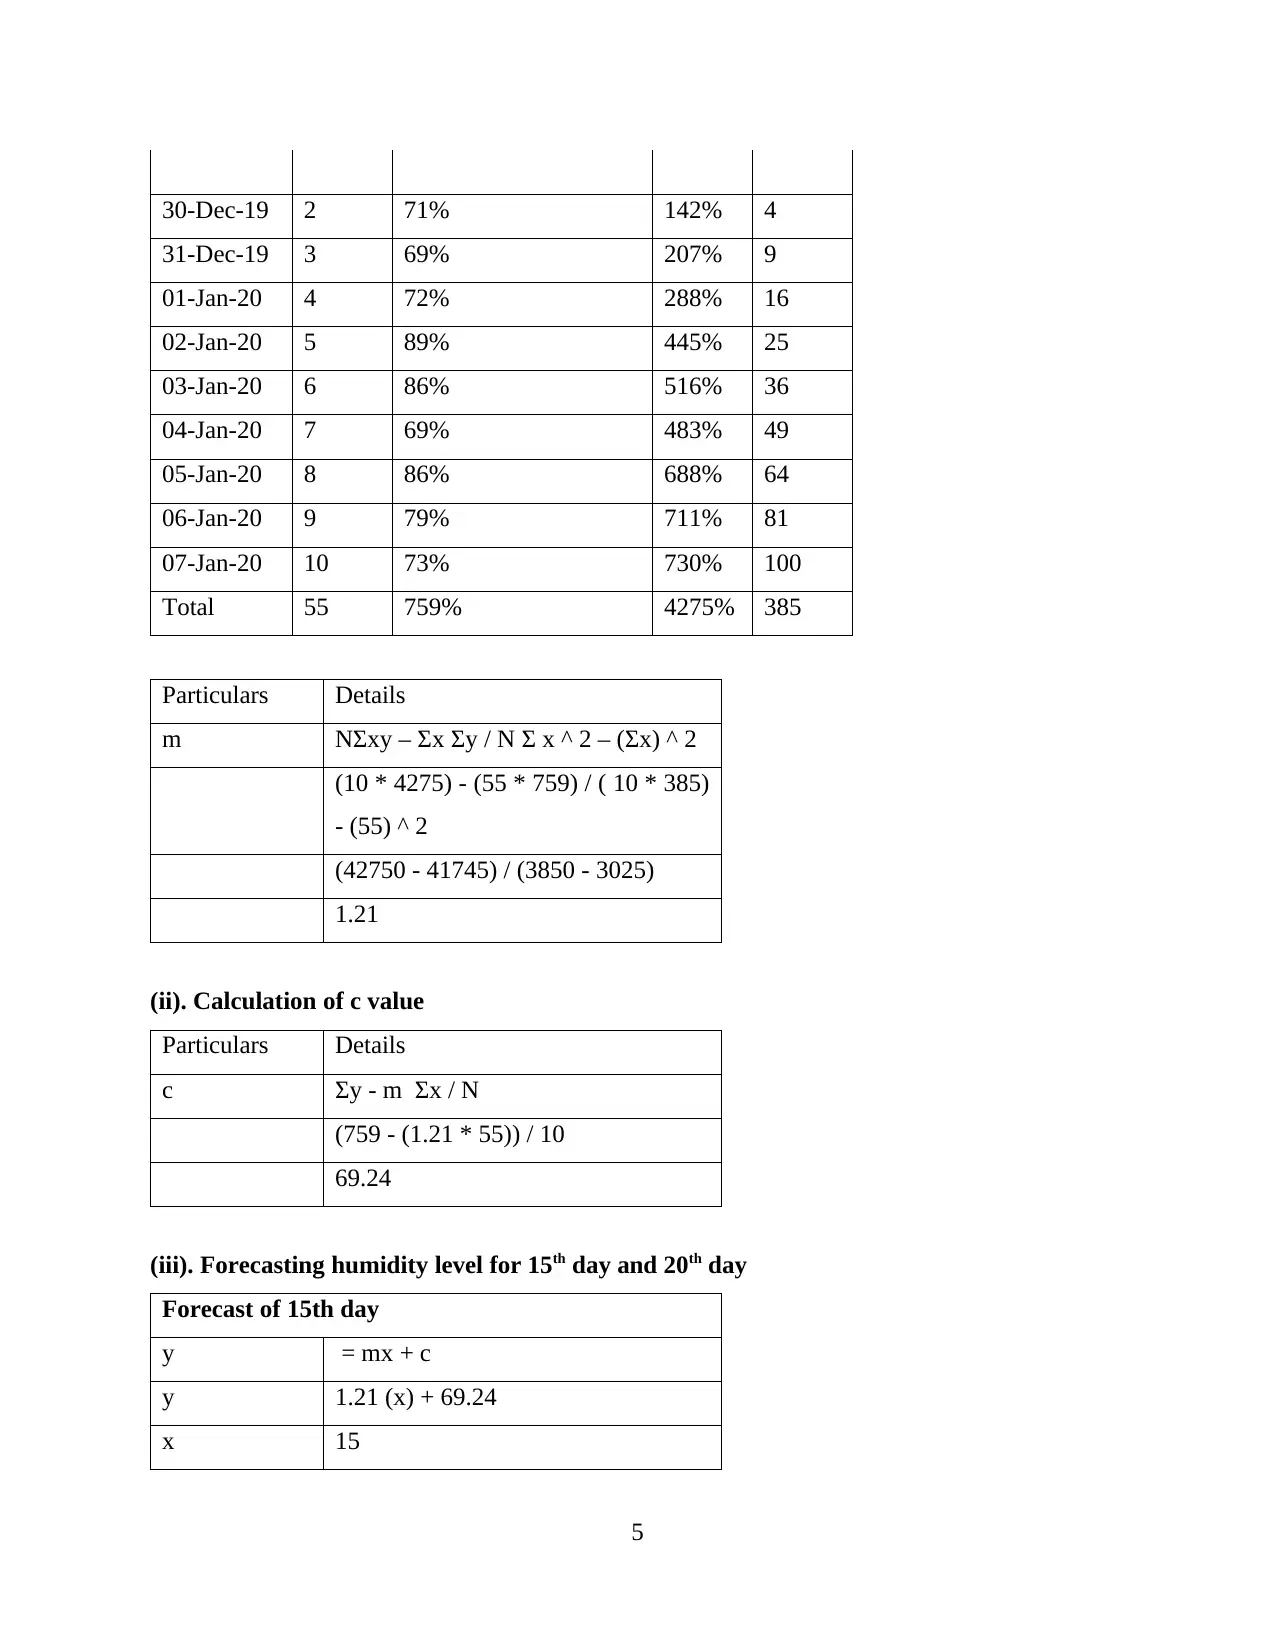
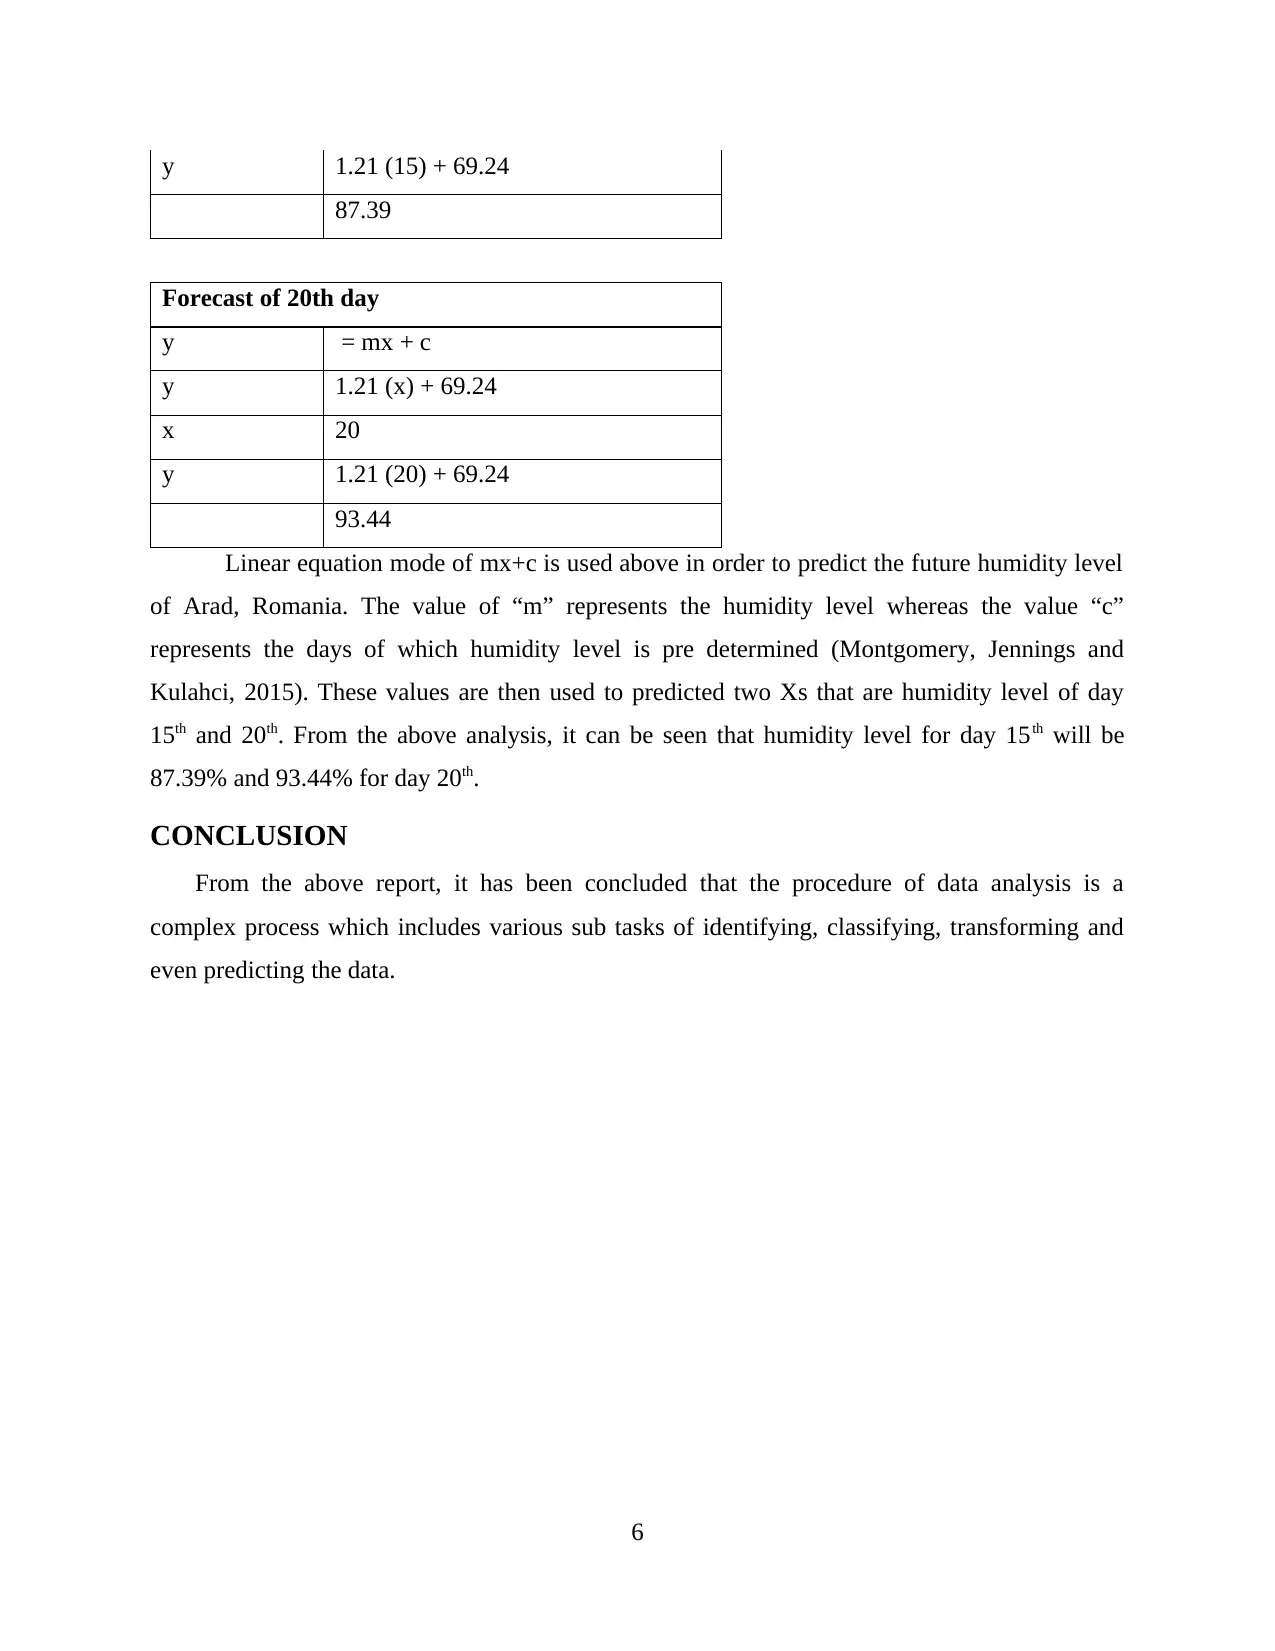
This report presents a comprehensive analysis of humidity data collected from Arad, Romania, over a ten-day period. The data is initially presented in both table and chart formats to facilitate understanding. The report then calculates descriptive statistical tools, including mean, median, mode, range, and standard deviation, to summarize the data's central tendencies and dispersion. A linear forecasting model is then applied to predict humidity levels for the 15th and 20th days, demonstrating the practical application of data analysis techniques. The report concludes with a summary of findings and a list of references.
1 out of 9
Related Documents


Your All-in-One AI-Powered Toolkit for Academic Success.
+13062052269
info@desklib.com
Available 24*7 on WhatsApp / Email
![[object Object]](/_next/static/media/star-bottom.7253800d.svg)
Copyright © 2020–2026 A2Z Services. All Rights Reserved. Developed and managed by ZUCOL.