Data Analysis and Forecasting
VerifiedAdded on 2023/01/09
|9
|1379
|30
AI Summary
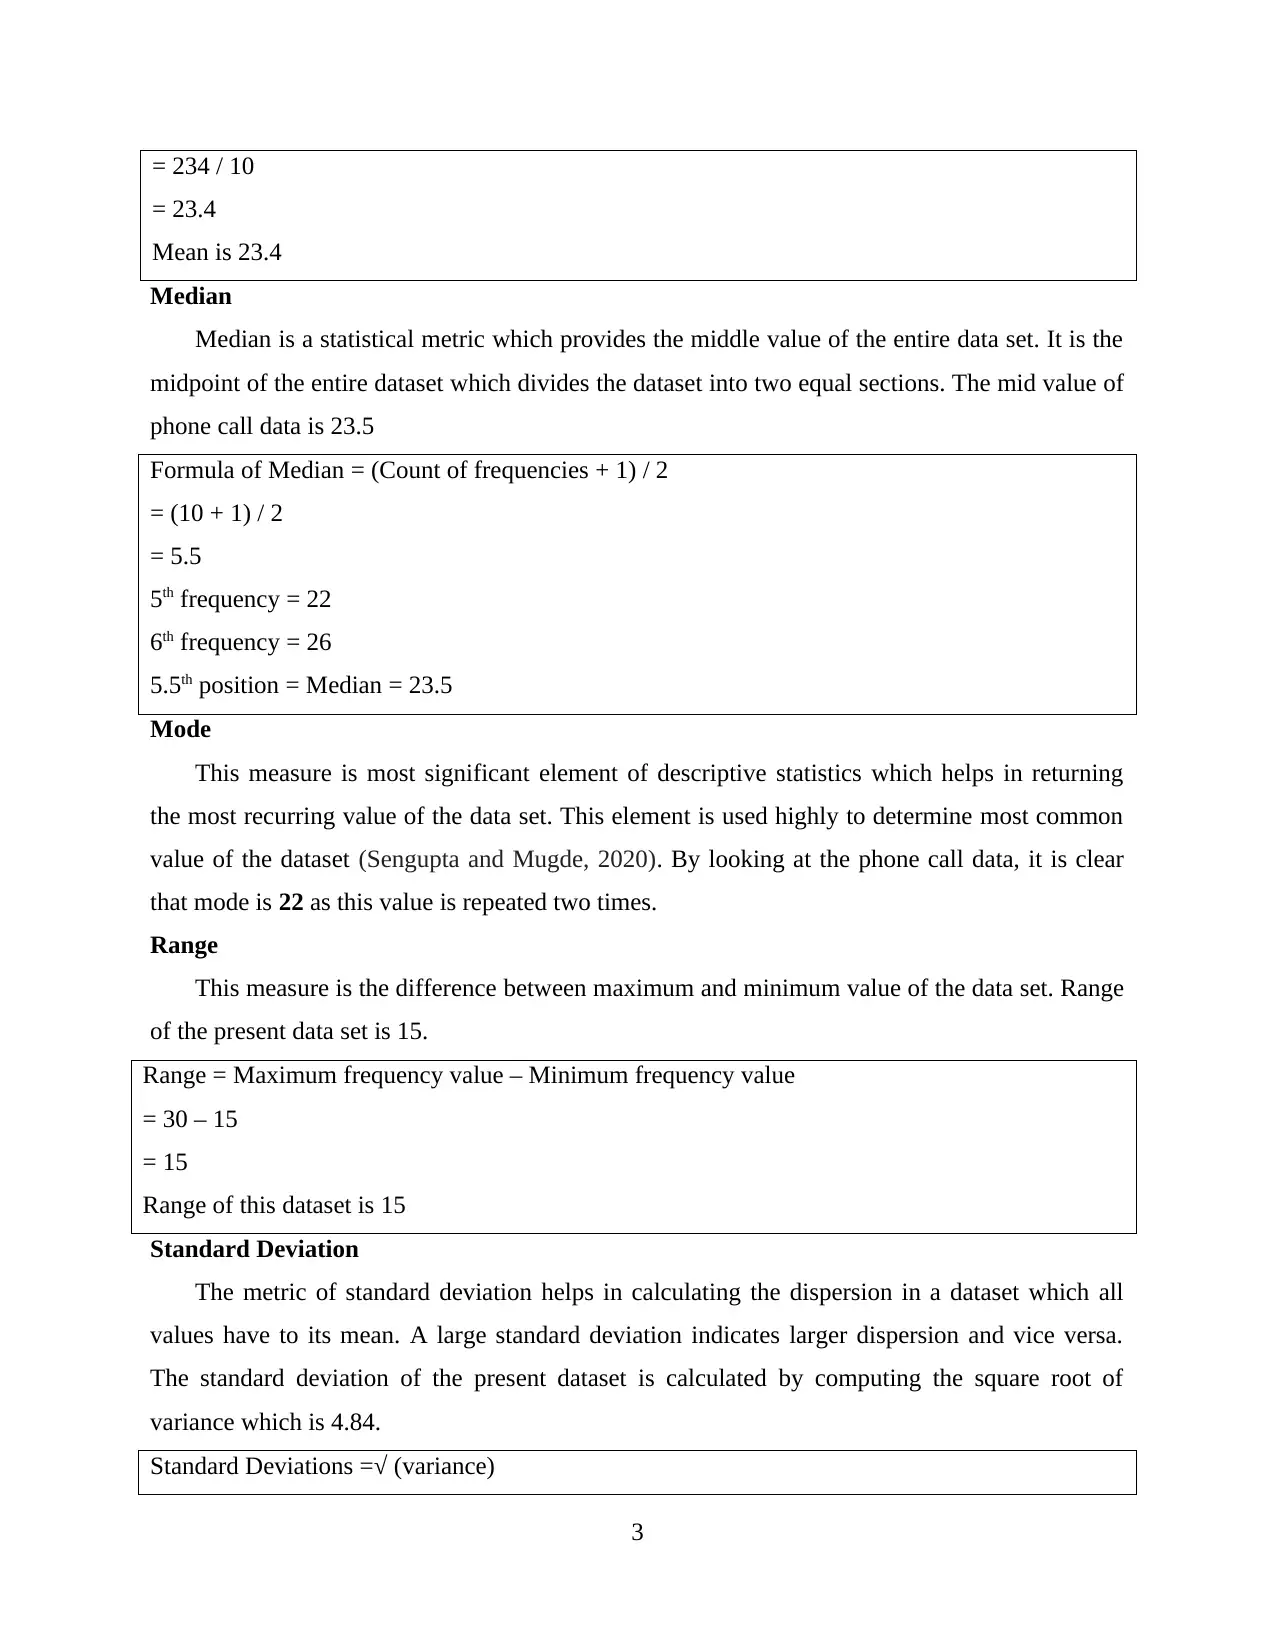
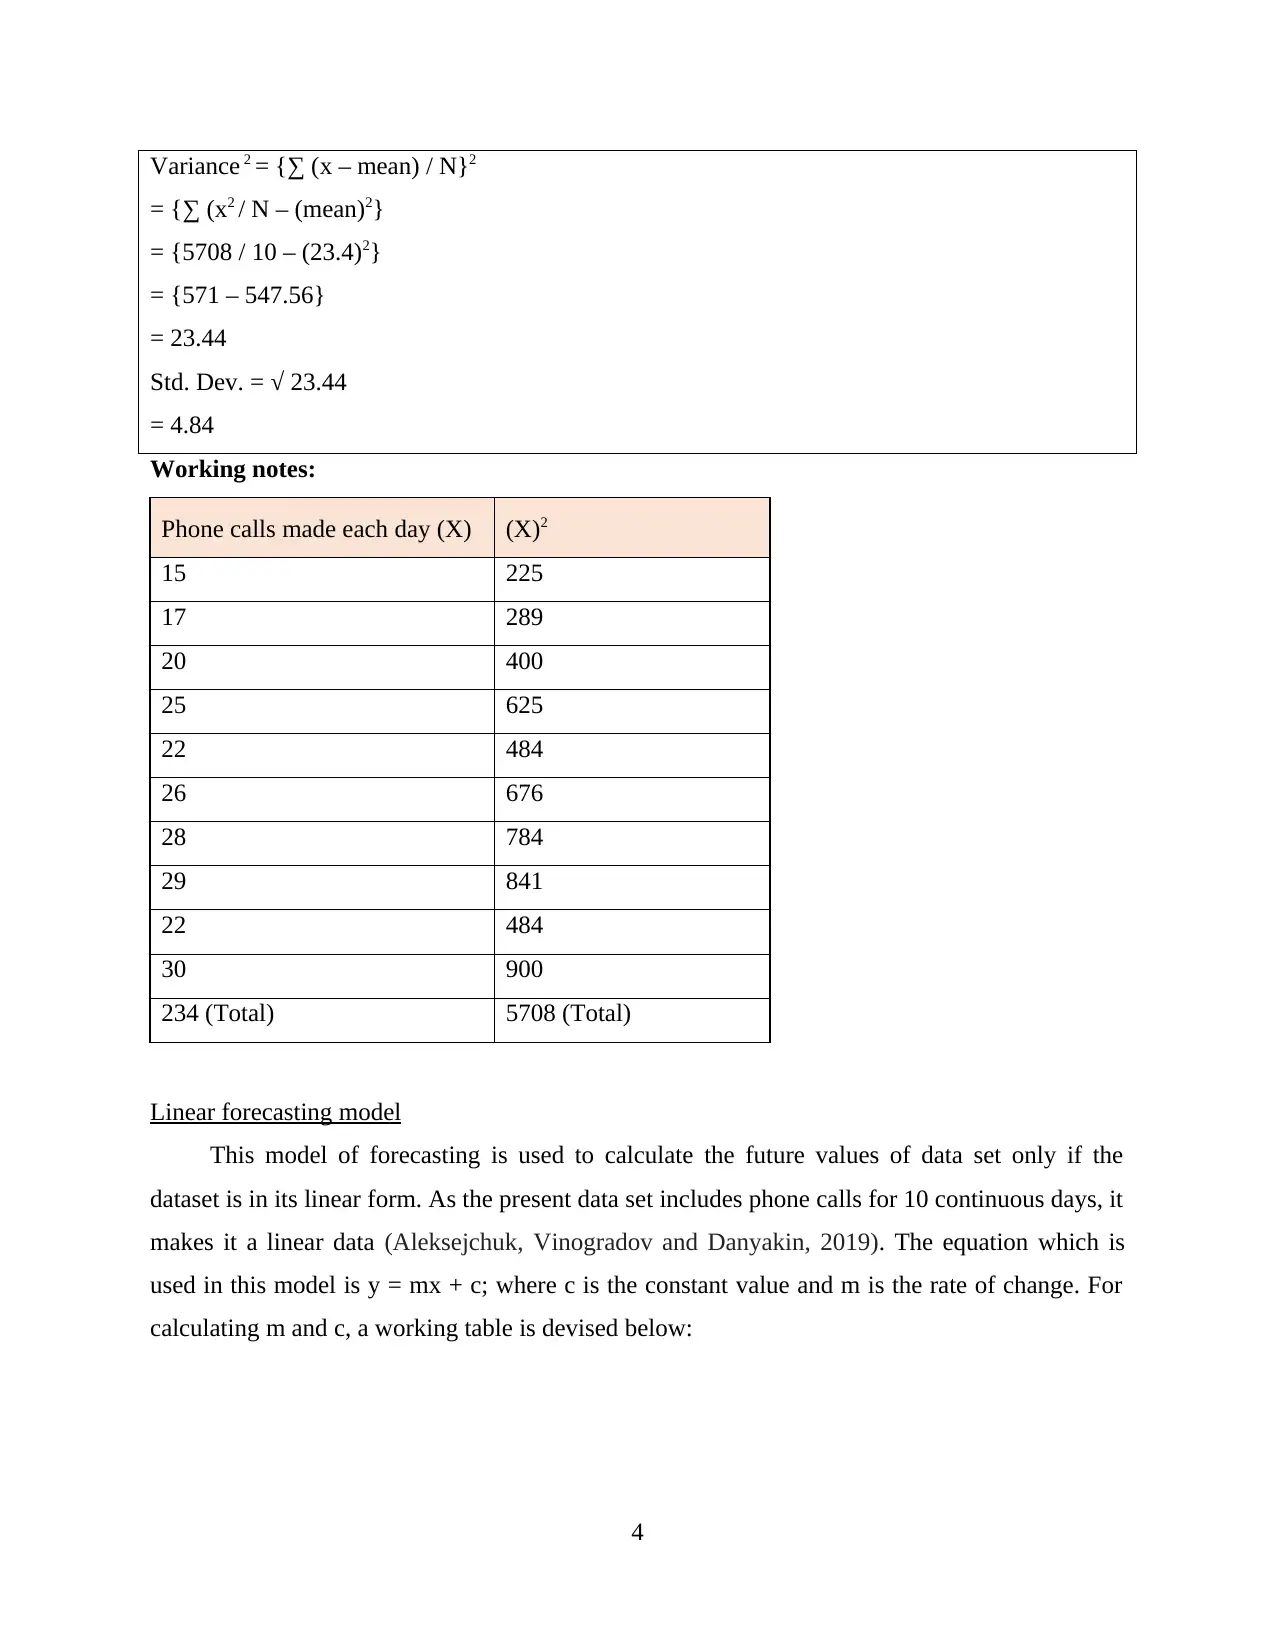
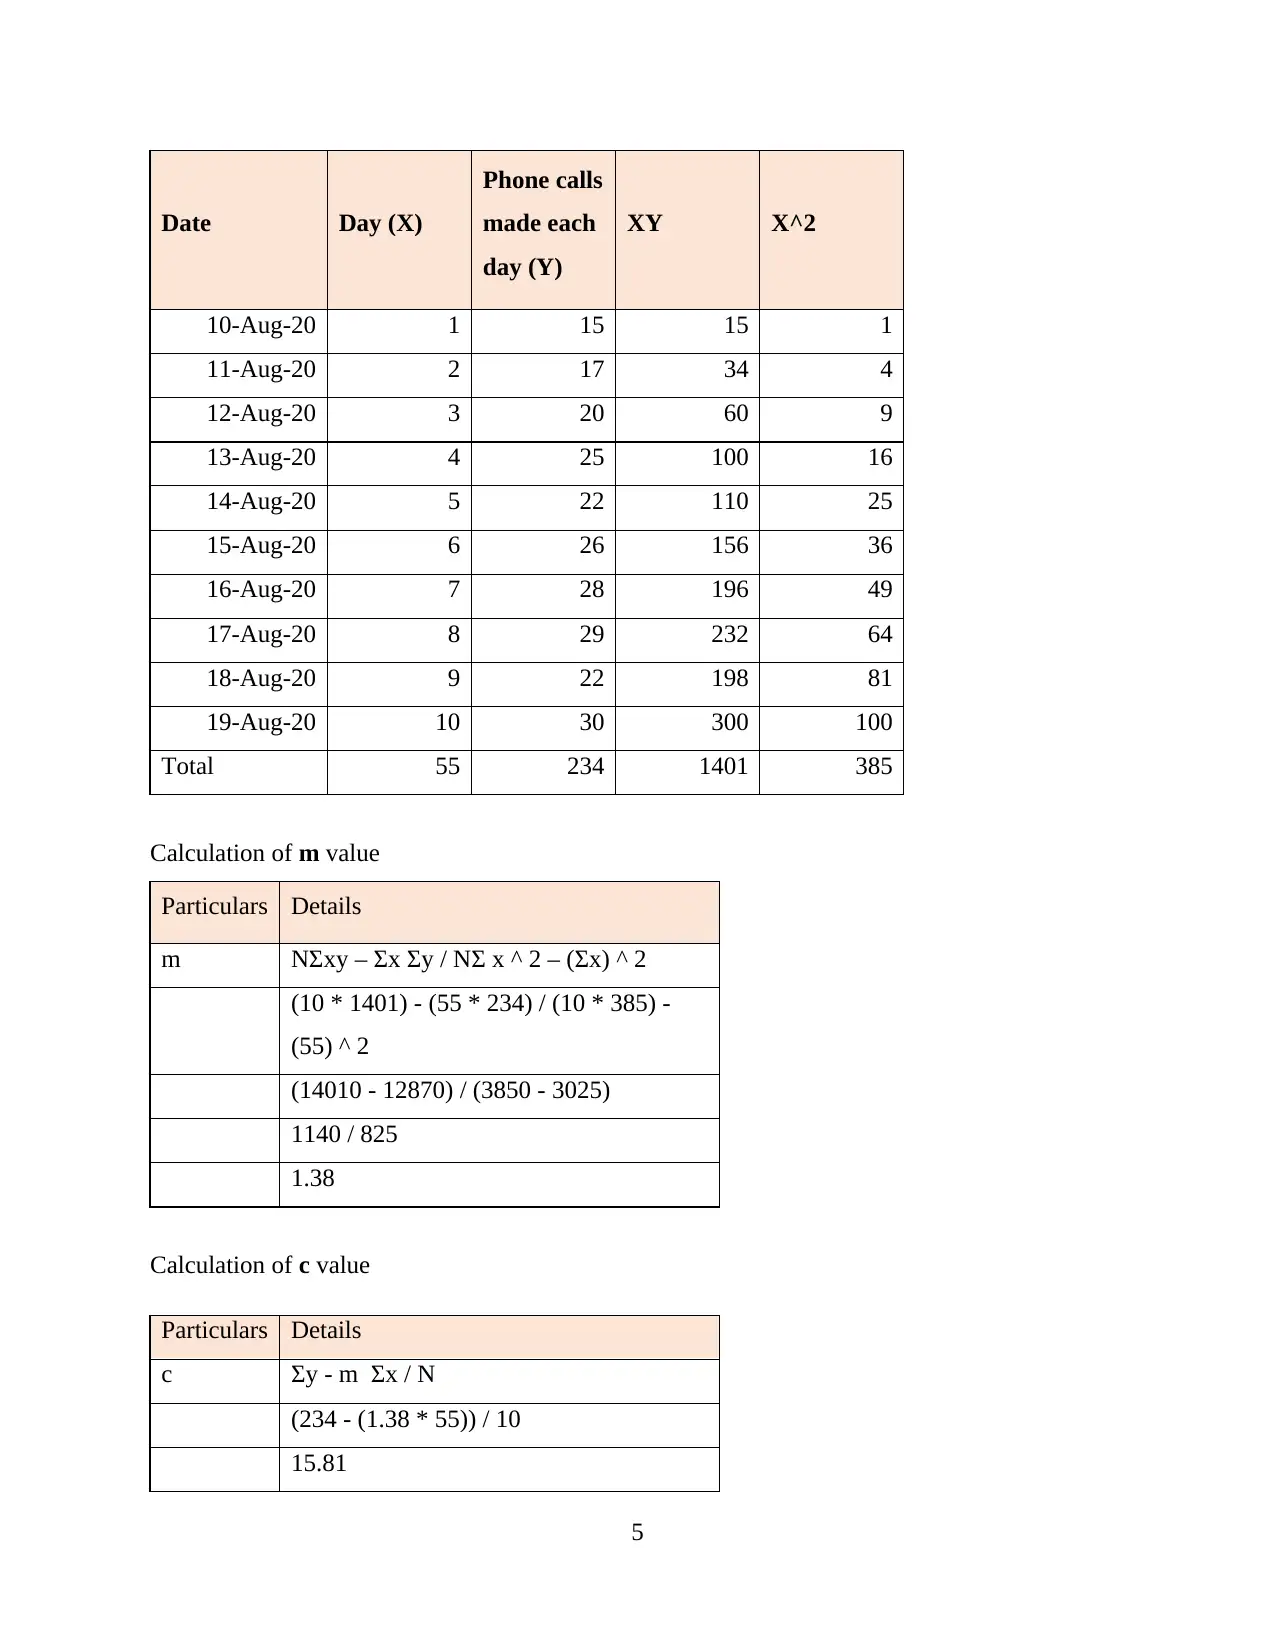
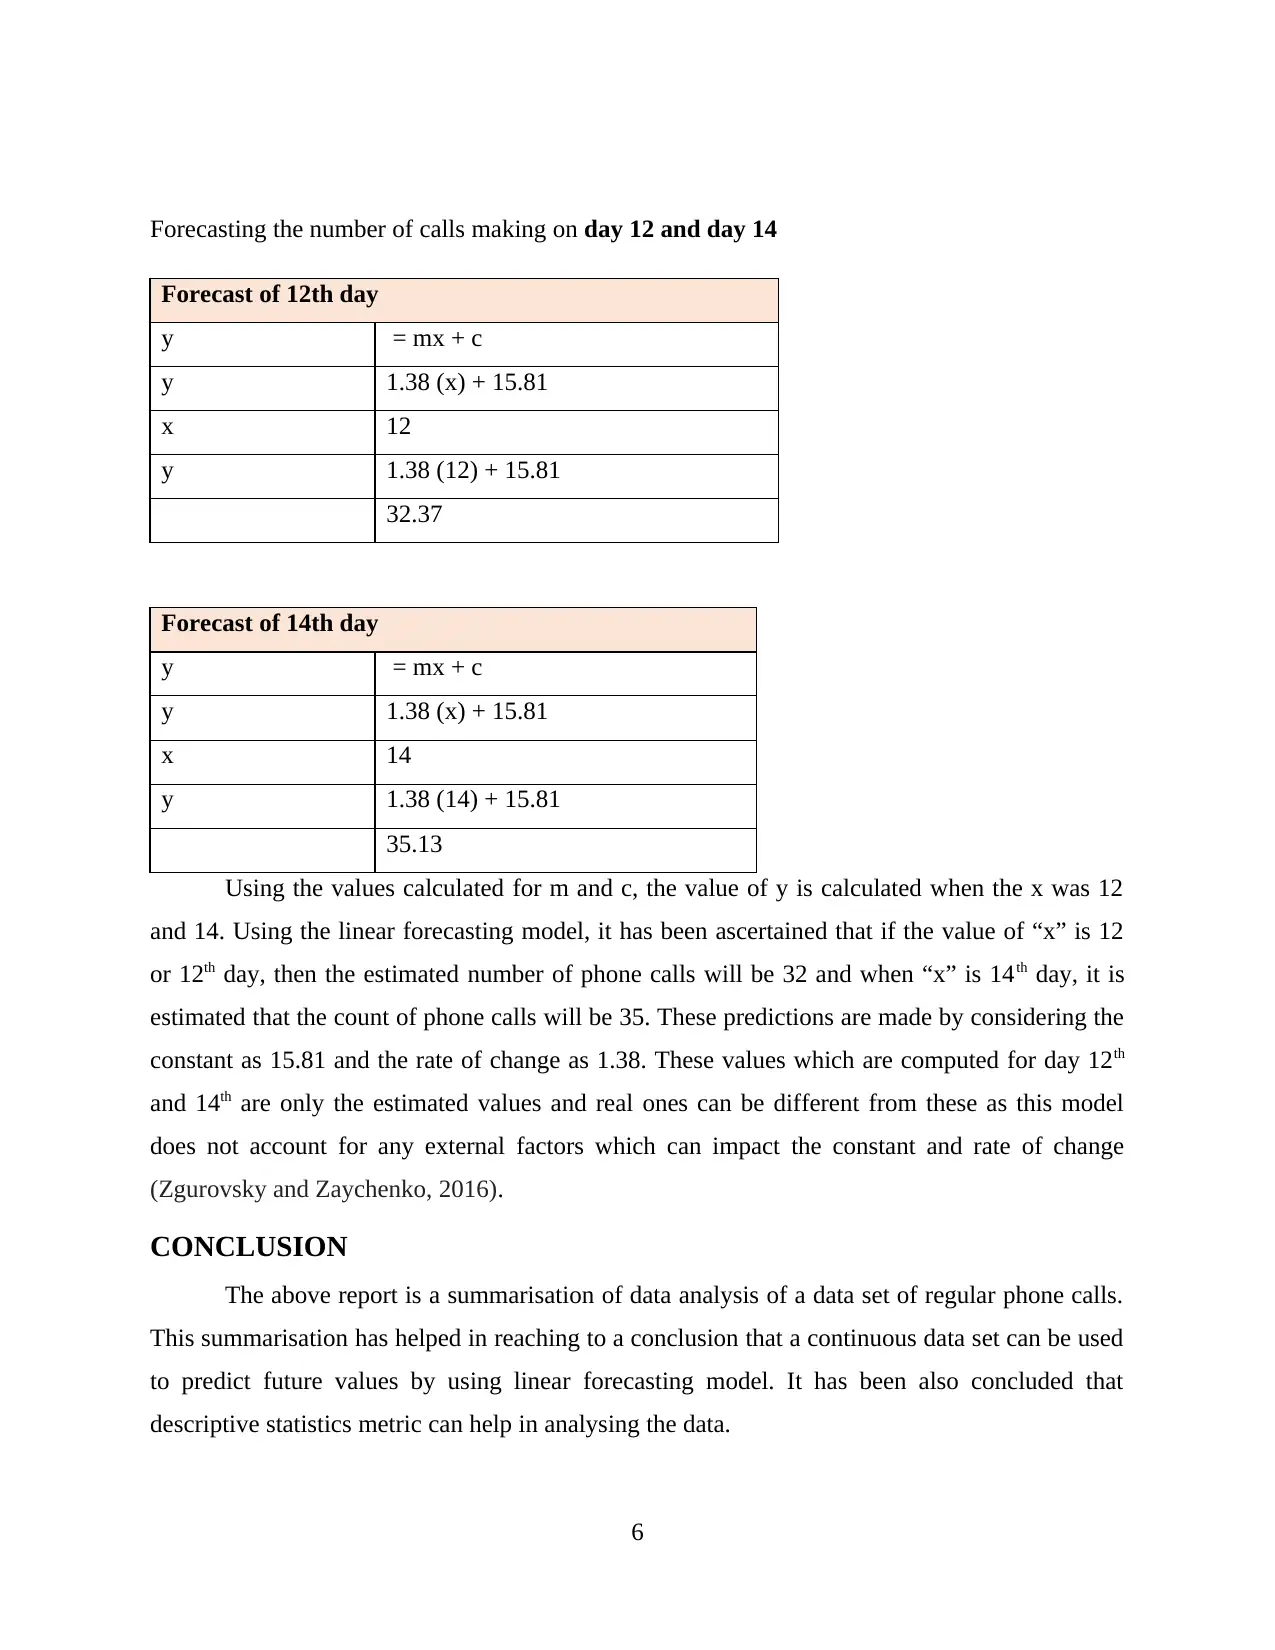
This report provides an understanding of data analysis and forecasting techniques. It covers tabular and graphical representation, descriptive analysis, and a linear forecasting model. The report also discusses the process of predicting future values based on present data.
Contribute Materials
Your contribution can guide someone’s learning journey. Share your
documents today.
1 out of 9
Related Documents


Your All-in-One AI-Powered Toolkit for Academic Success.
+13062052269
info@desklib.com
Available 24*7 on WhatsApp / Email
![[object Object]](/_next/static/media/star-bottom.7253800d.svg)
© 2024 | Zucol Services PVT LTD | All rights reserved.