BSc Cloud Computing: Data Analysis and Visualization Report
VerifiedAdded on 2022/12/29
|16
|2397
|97
Report
AI Summary
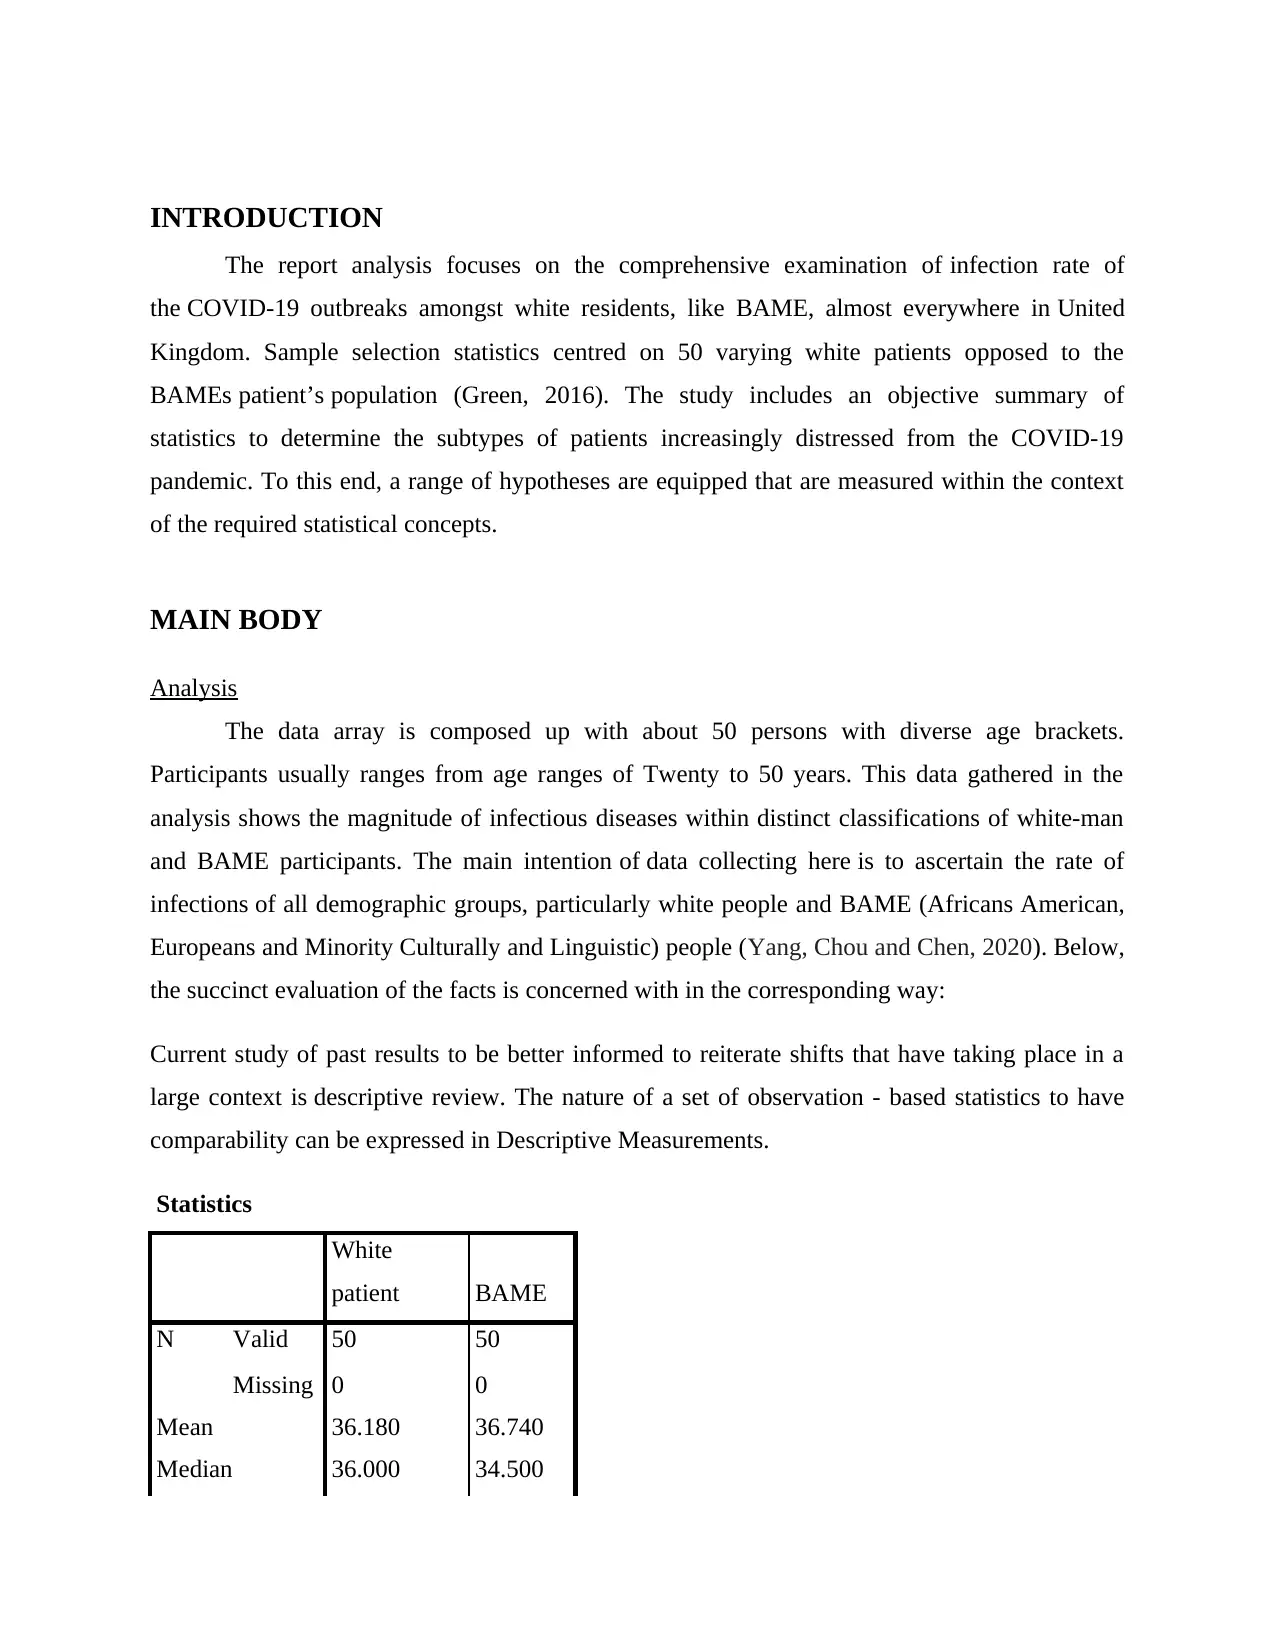
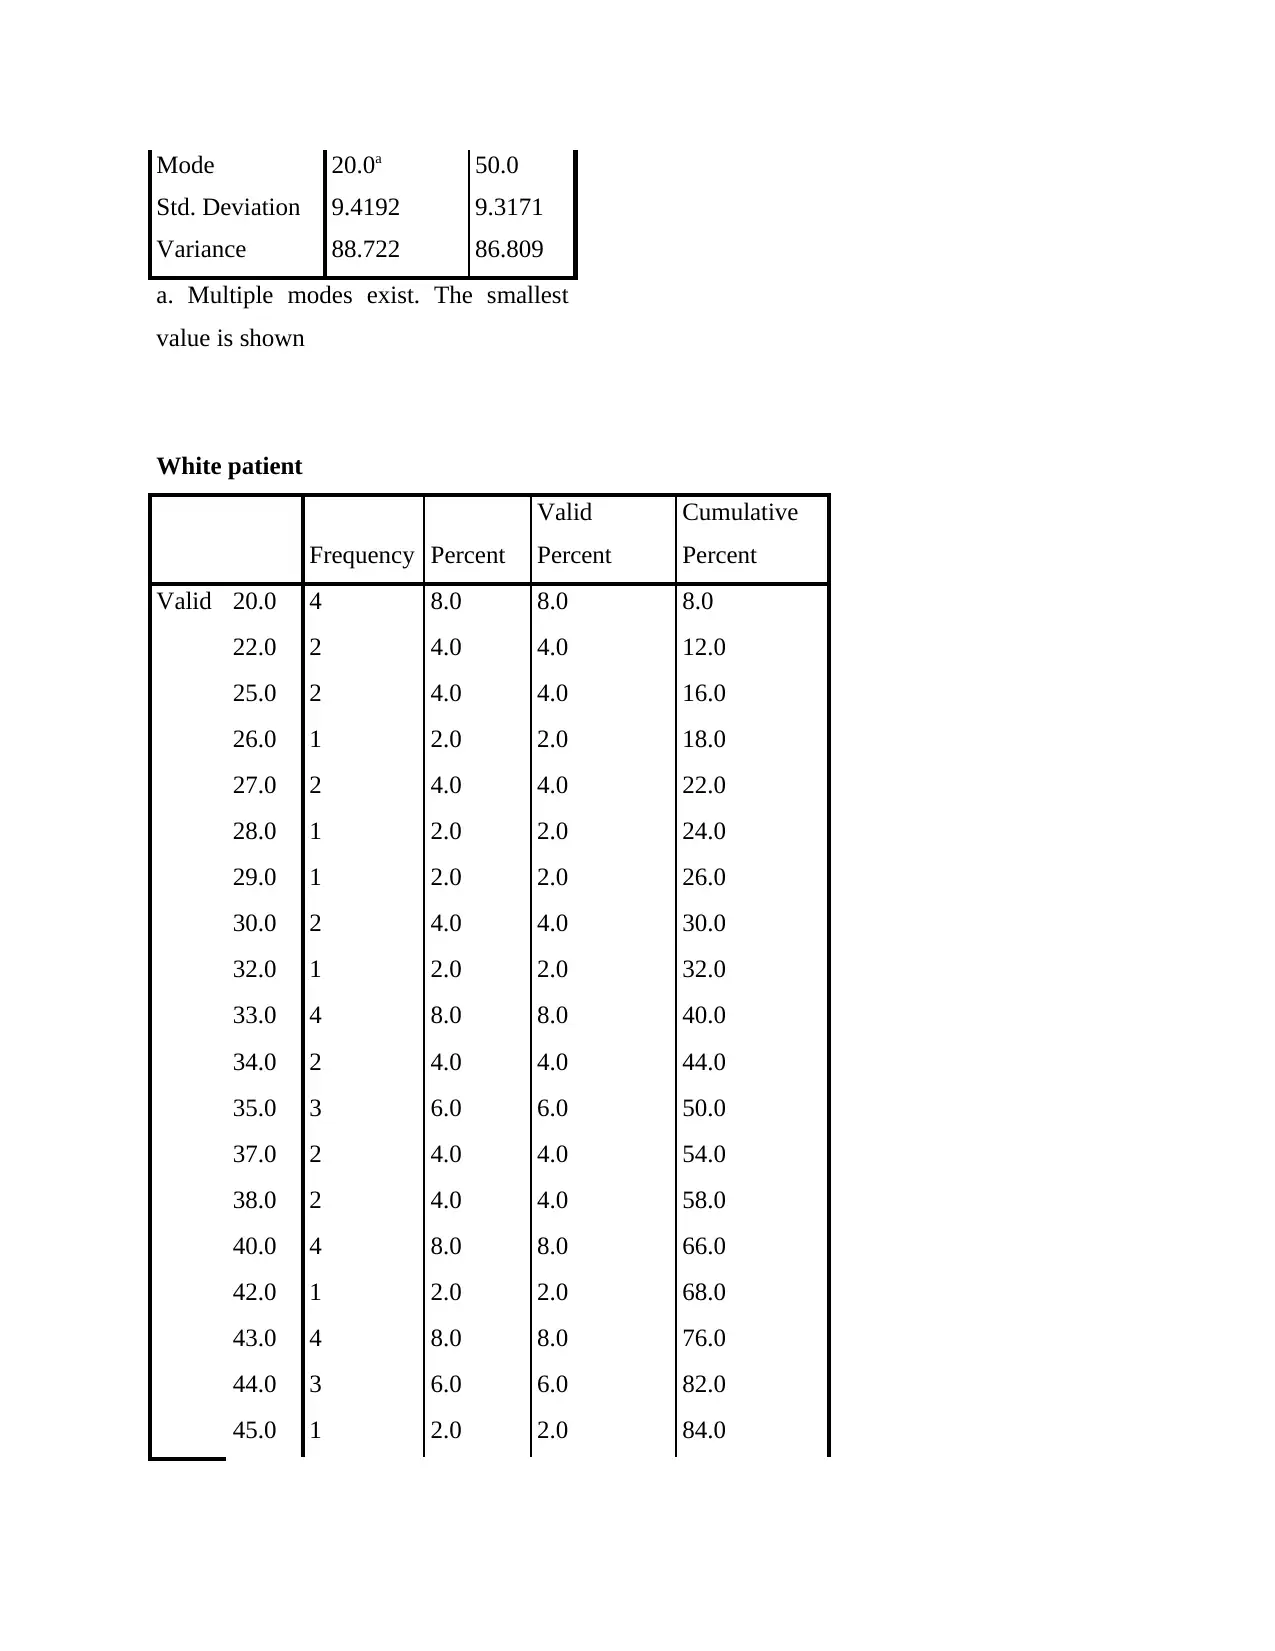
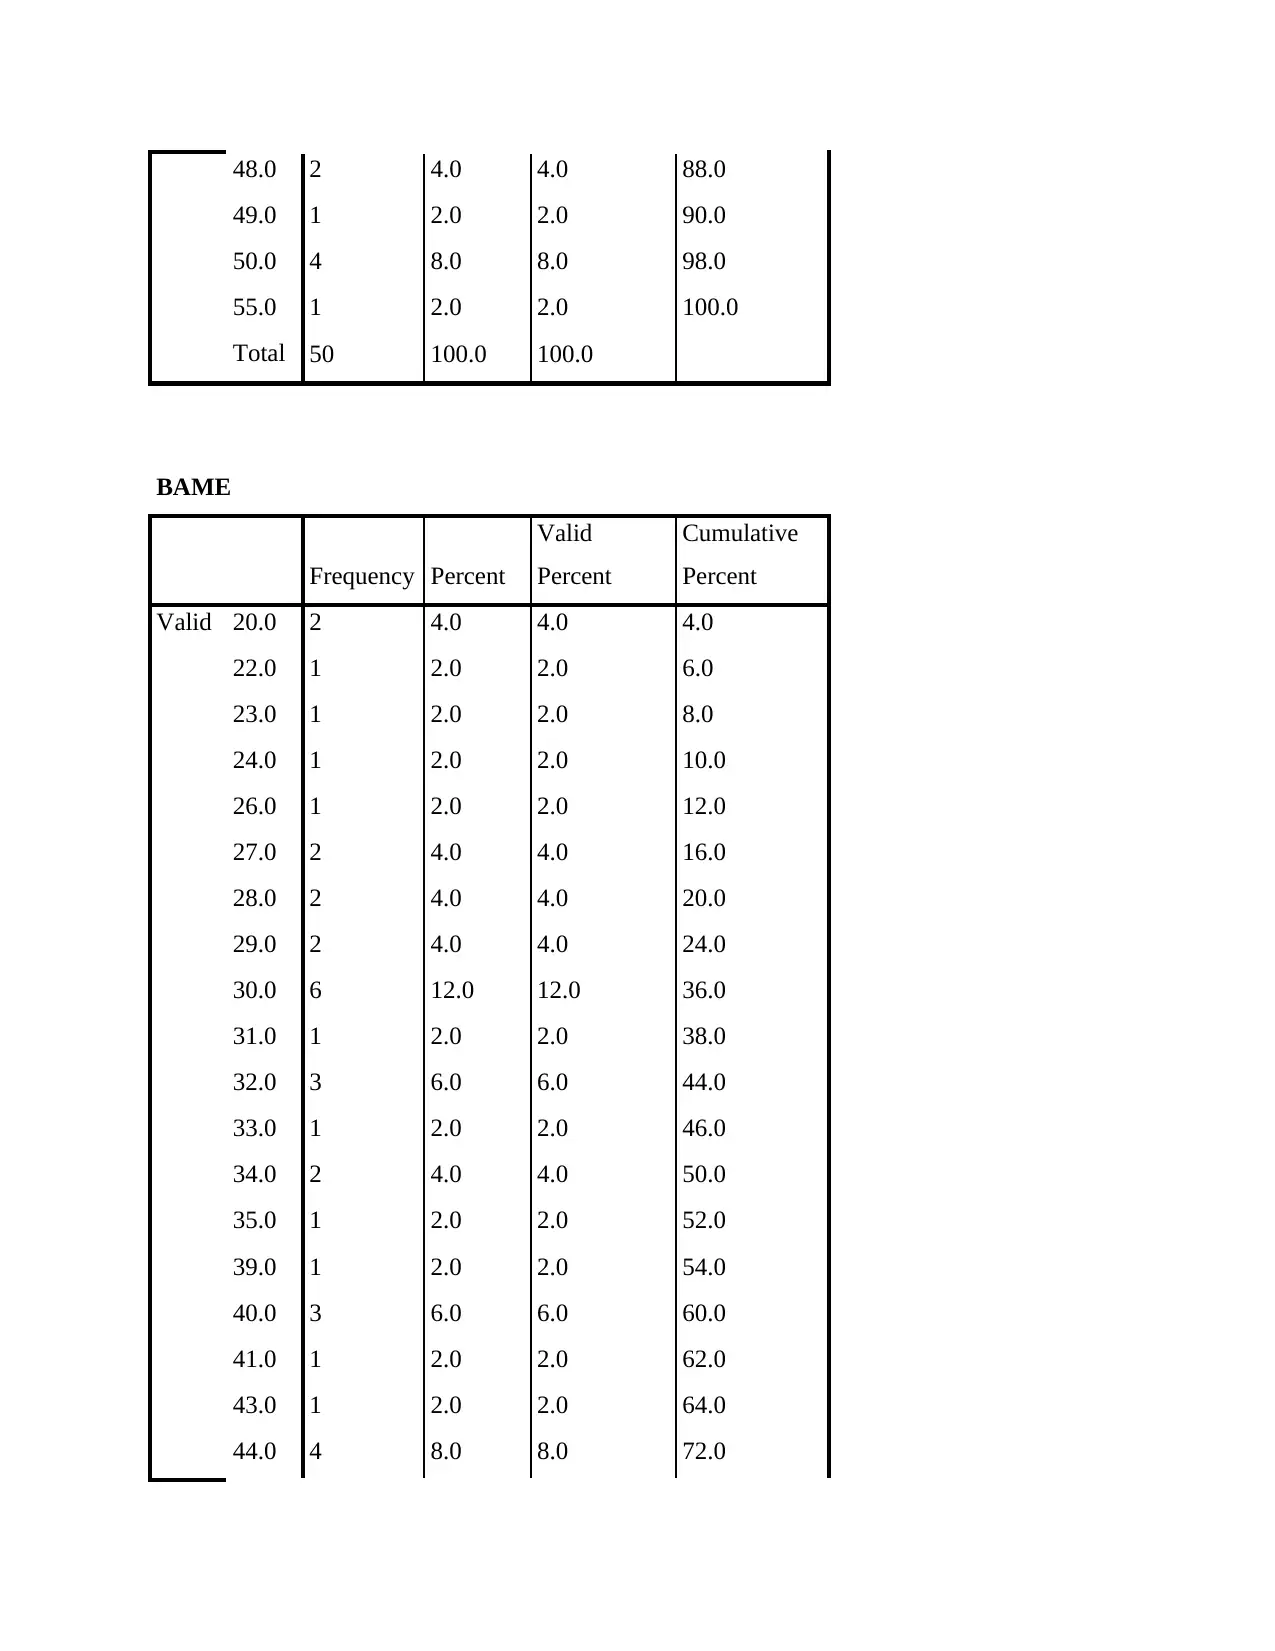
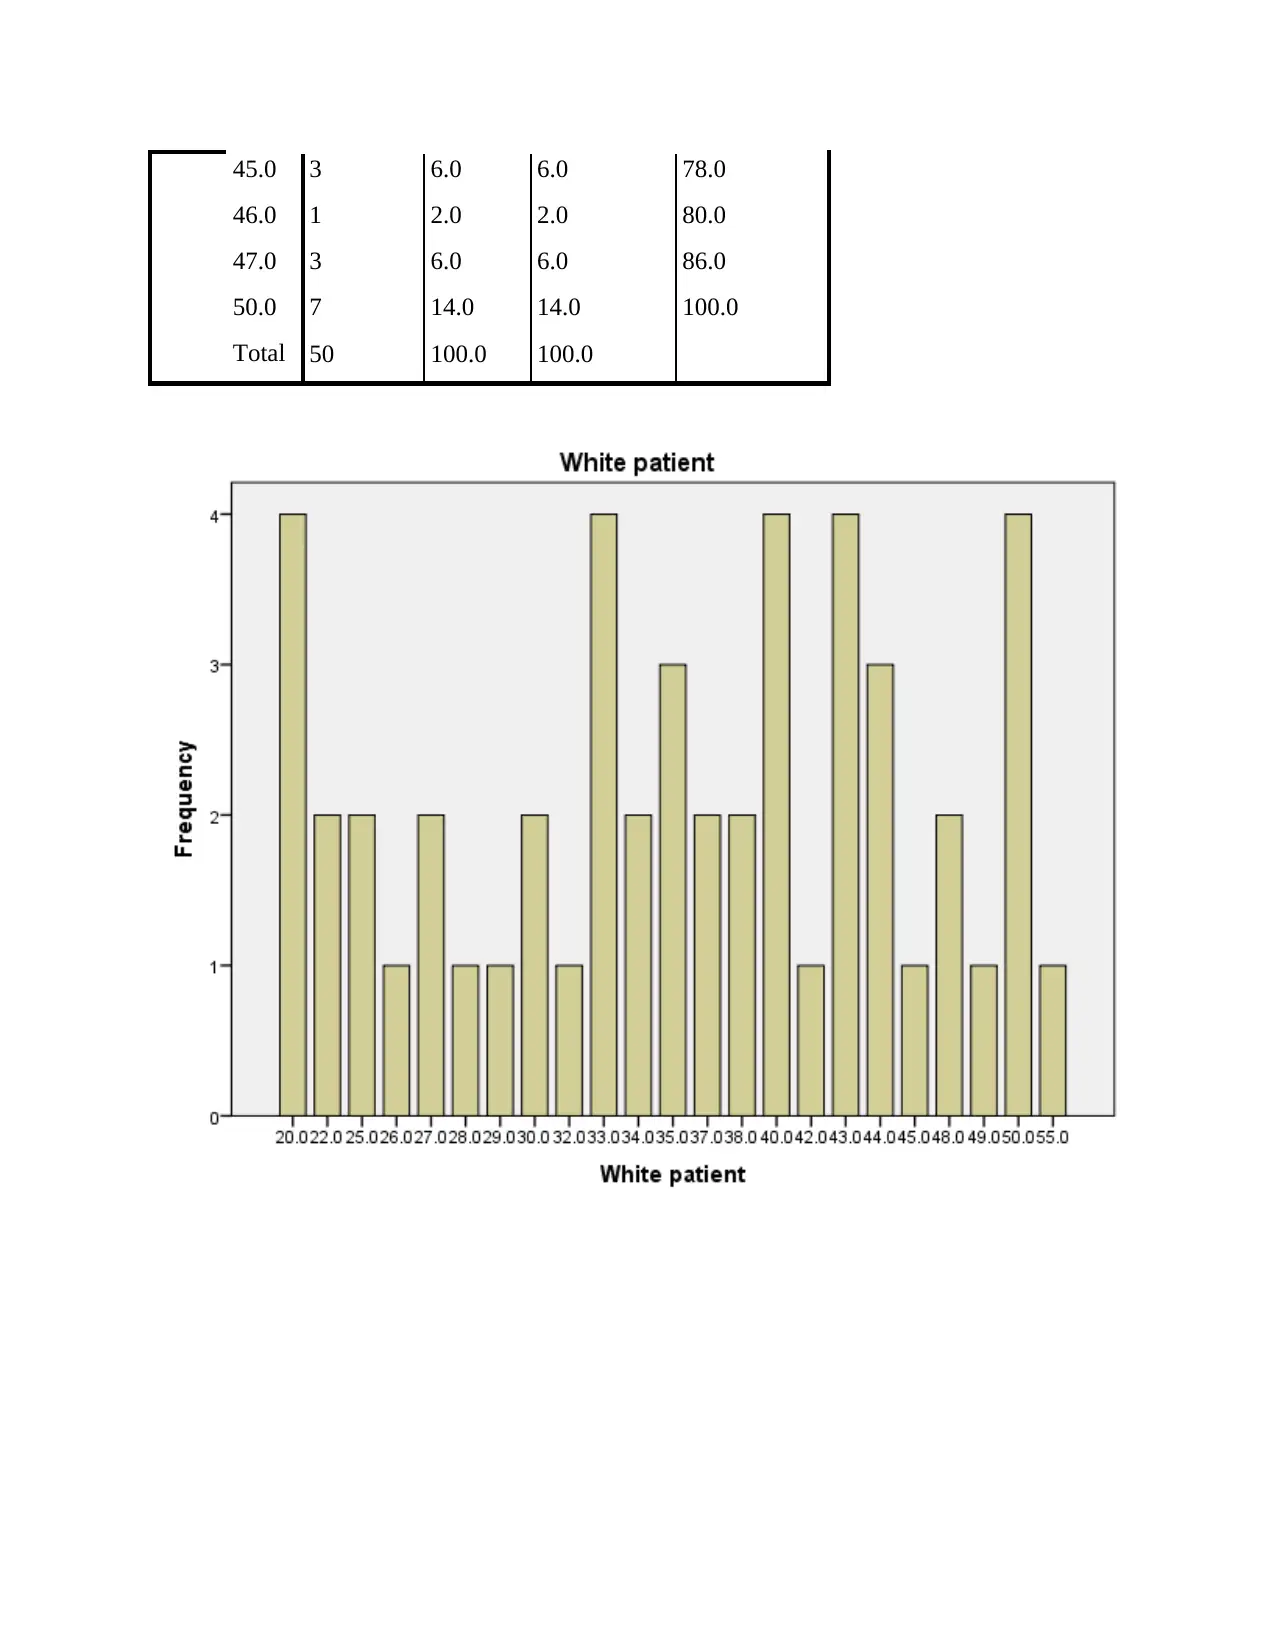
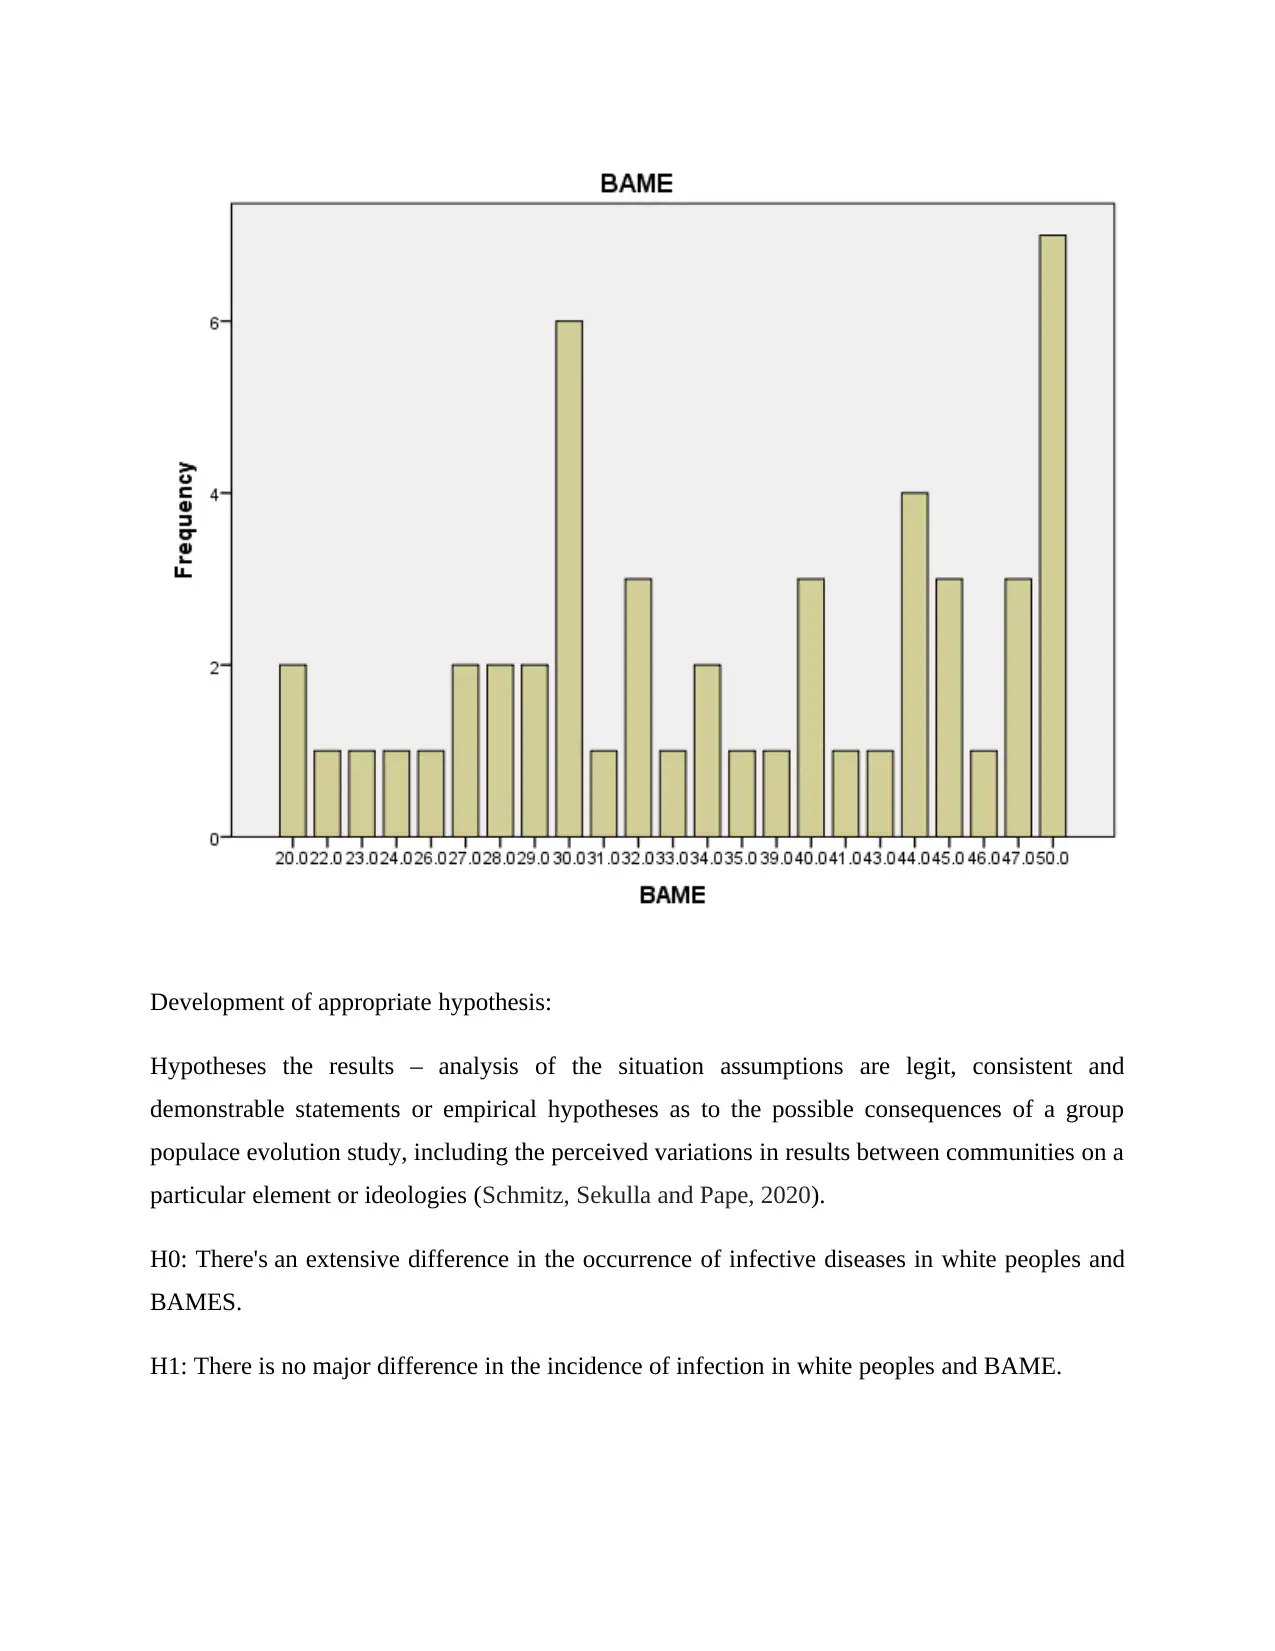
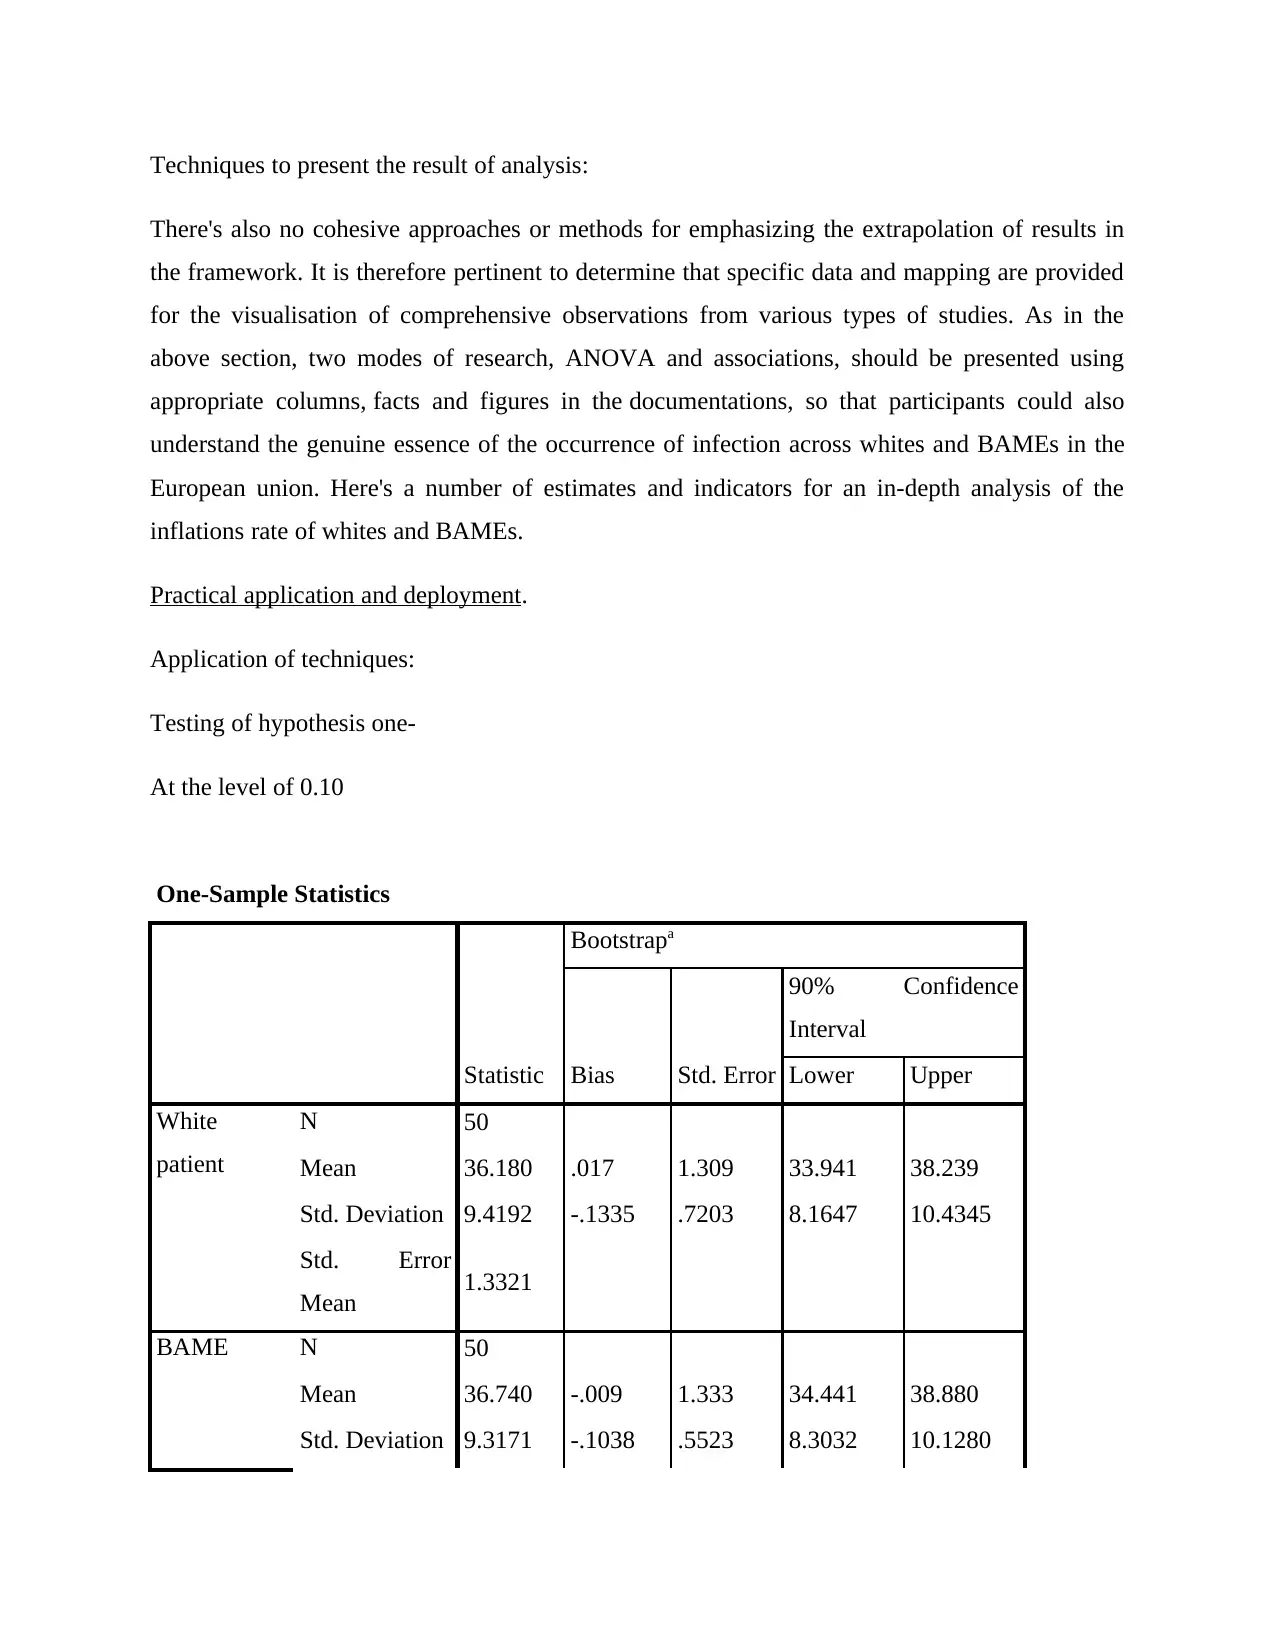
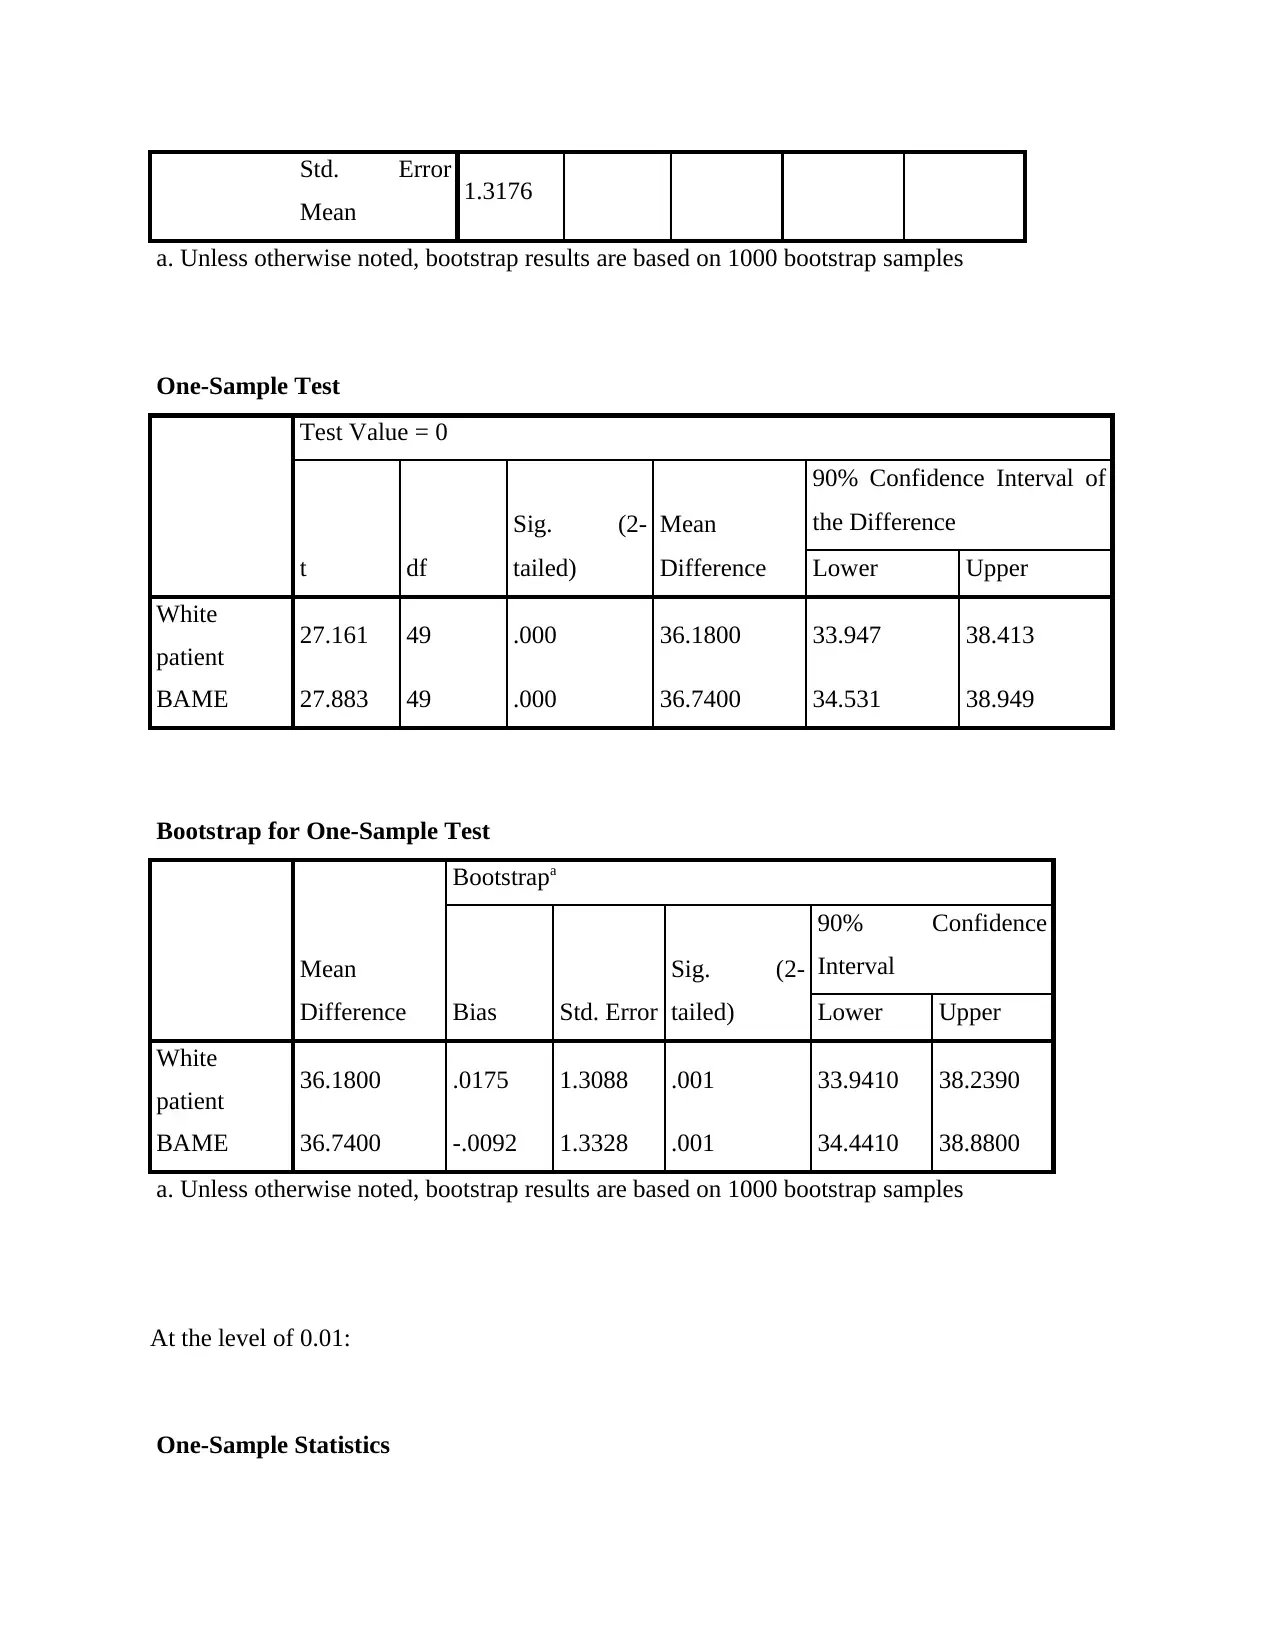
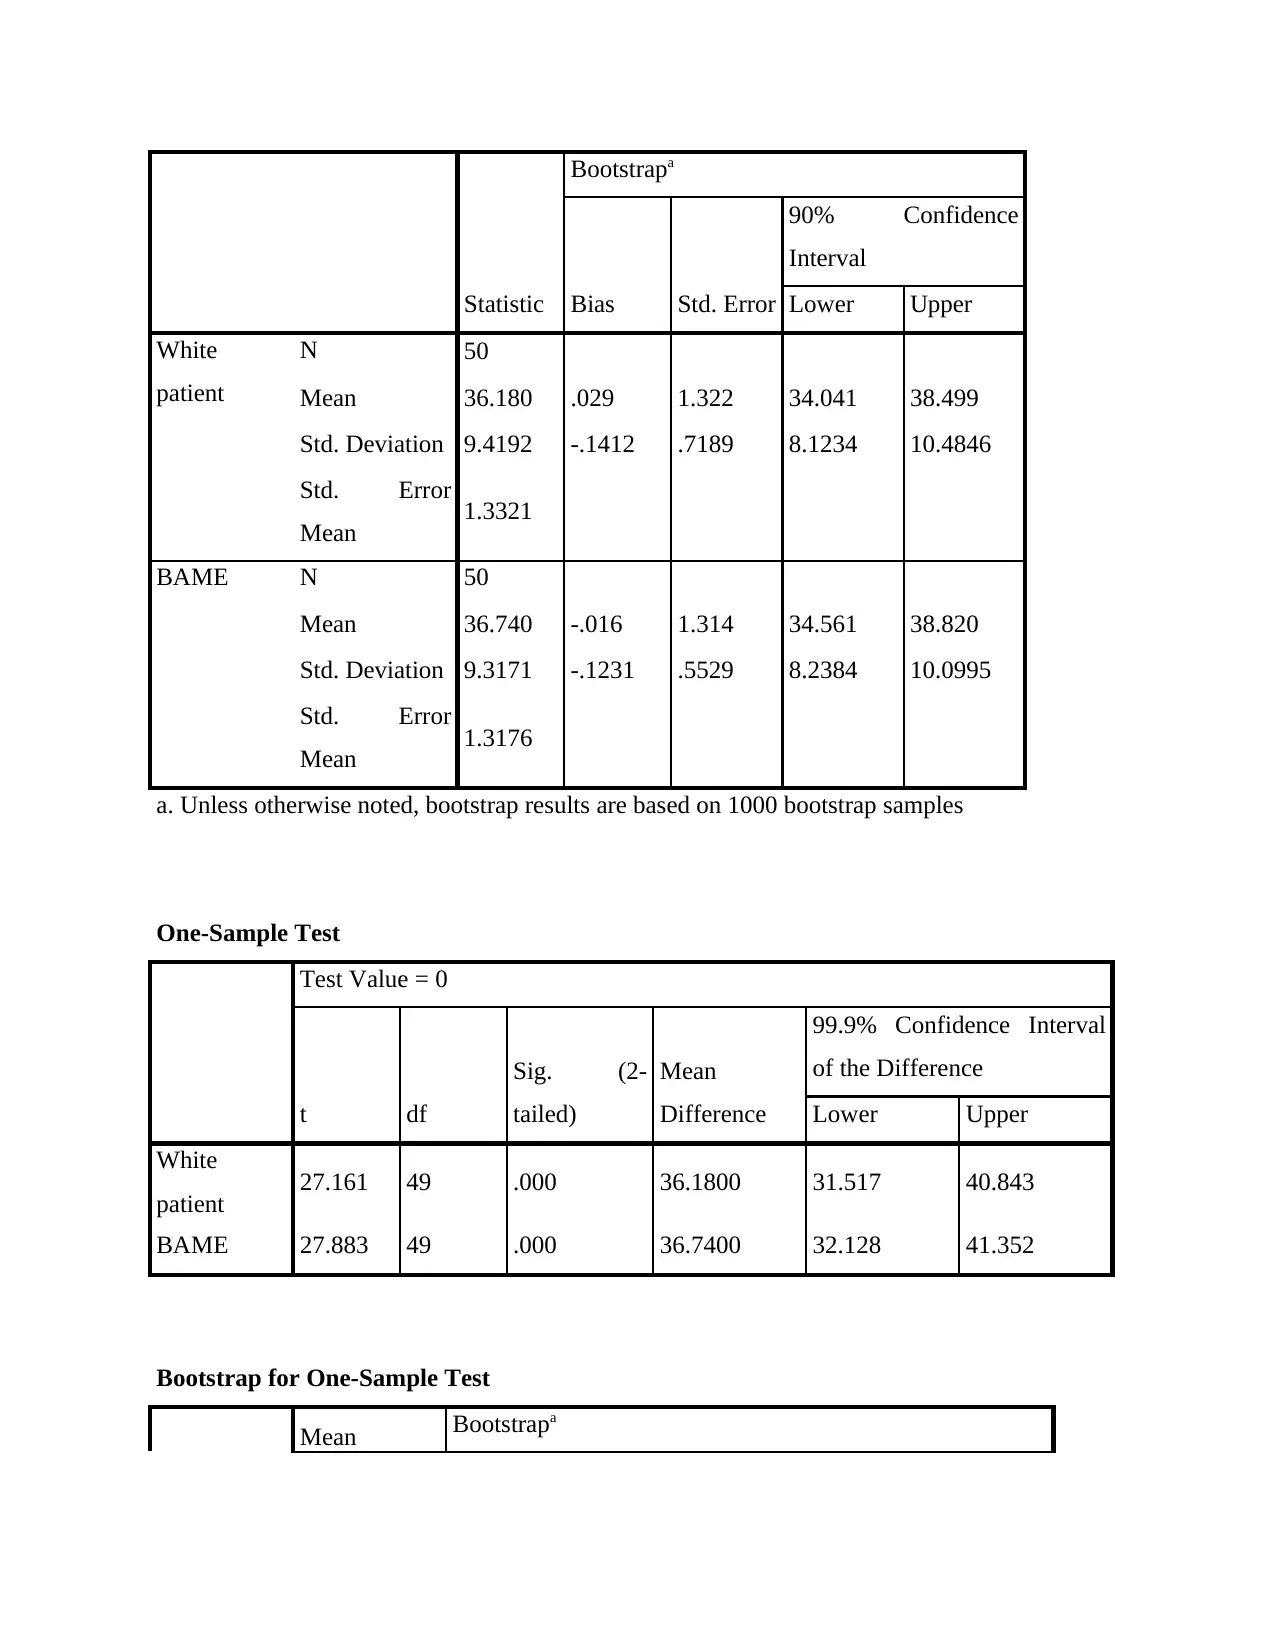
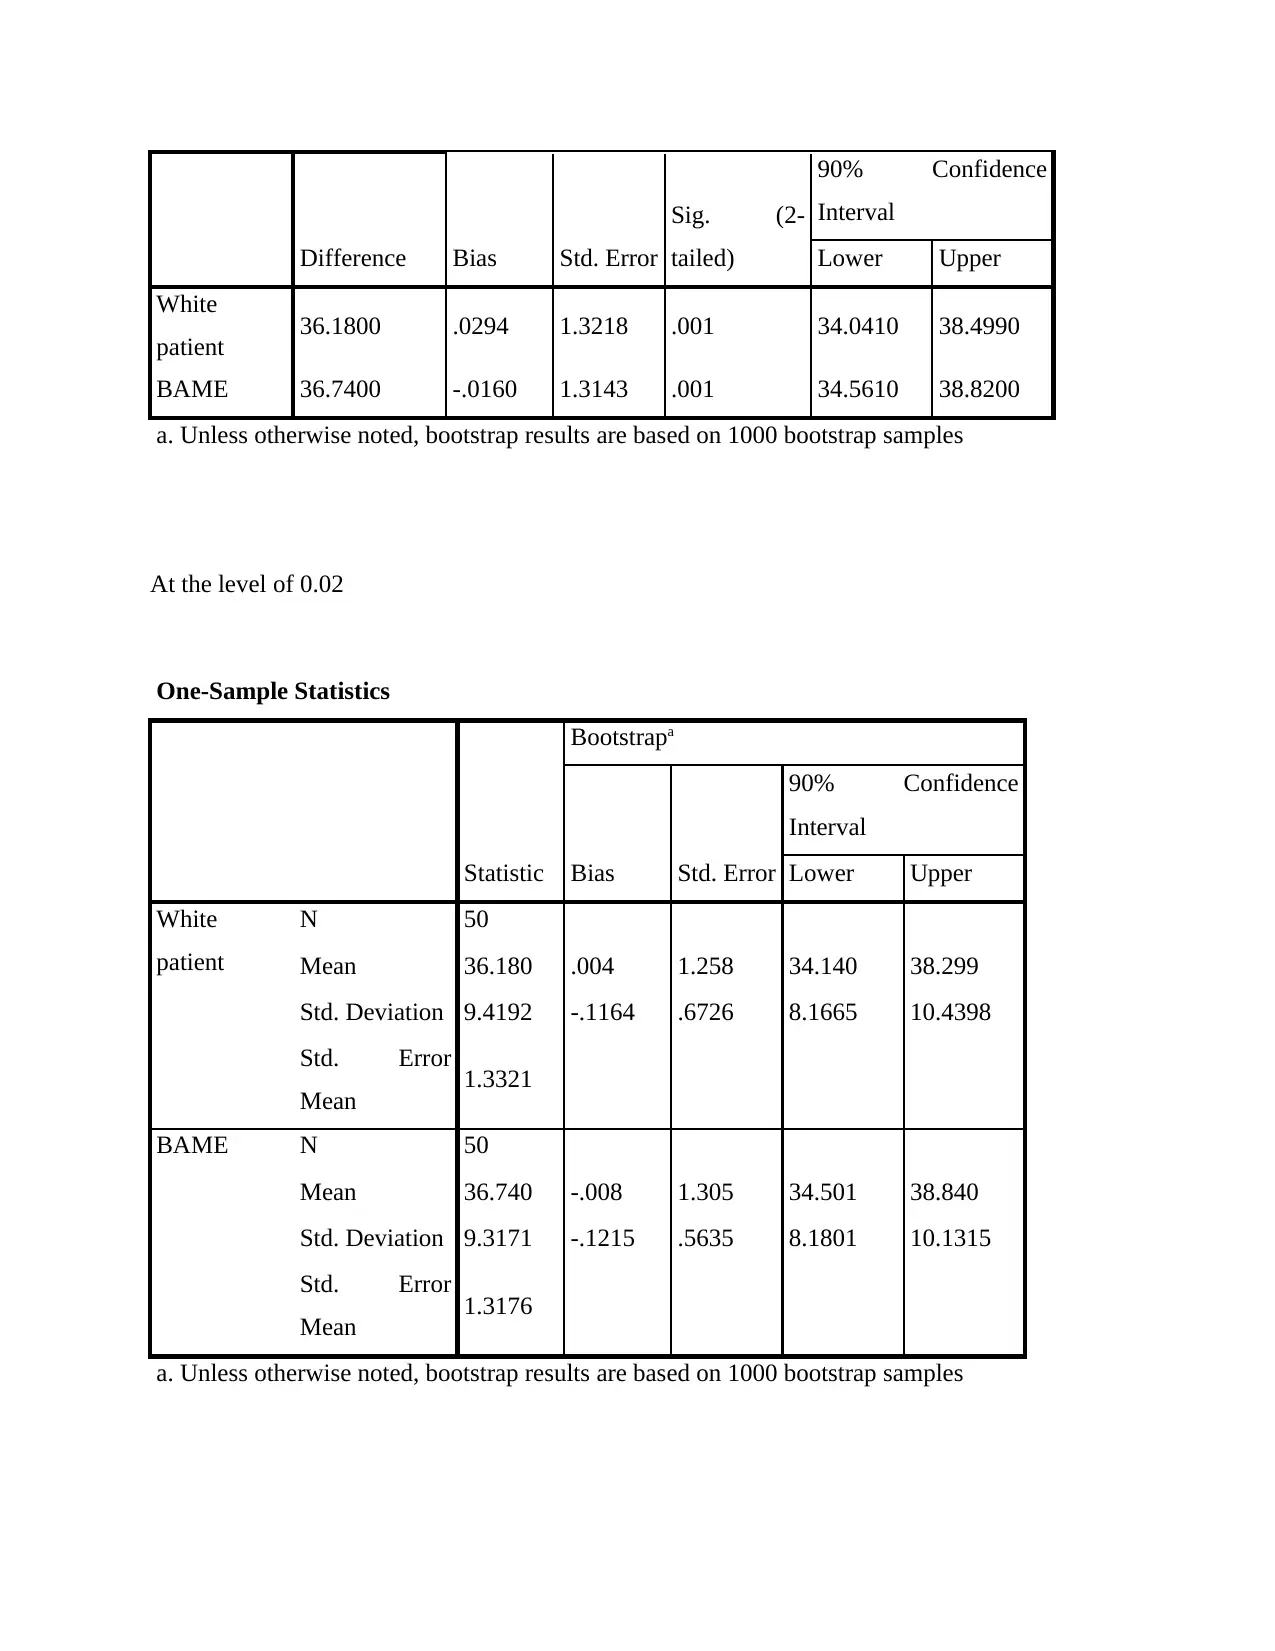
This report presents a data analysis of COVID-19 infection rates in the United Kingdom, comparing white residents and BAME populations. The analysis uses a dataset of 50 individuals from each group to determine the subtypes of patients most affected by the pandemic. It includes descriptive statistics, hypothesis testing (including one-sample t-tests), and correlation analysis to evaluate the differences in infection rates. The study sets up hypotheses to assess the variations in outcomes between communities and uses techniques like ANOVA and correlation to present the results. The practical application involves testing hypotheses at different significance levels and interpreting the results, concluding that there are major disparities between the infection rates of white and BAME populations, although there is a link between infection prevalence in both groups.

1 out of 16
Related Documents


Your All-in-One AI-Powered Toolkit for Academic Success.
+13062052269
info@desklib.com
Available 24*7 on WhatsApp / Email
![[object Object]](/_next/static/media/star-bottom.7253800d.svg)
Copyright © 2020–2026 A2Z Services. All Rights Reserved. Developed and managed by ZUCOL.