Statistics and Probability: Data Analysis Assignment

Verified

Added on  2022/09/13

|5
|534
|15
Homework Assignment
AI Summary
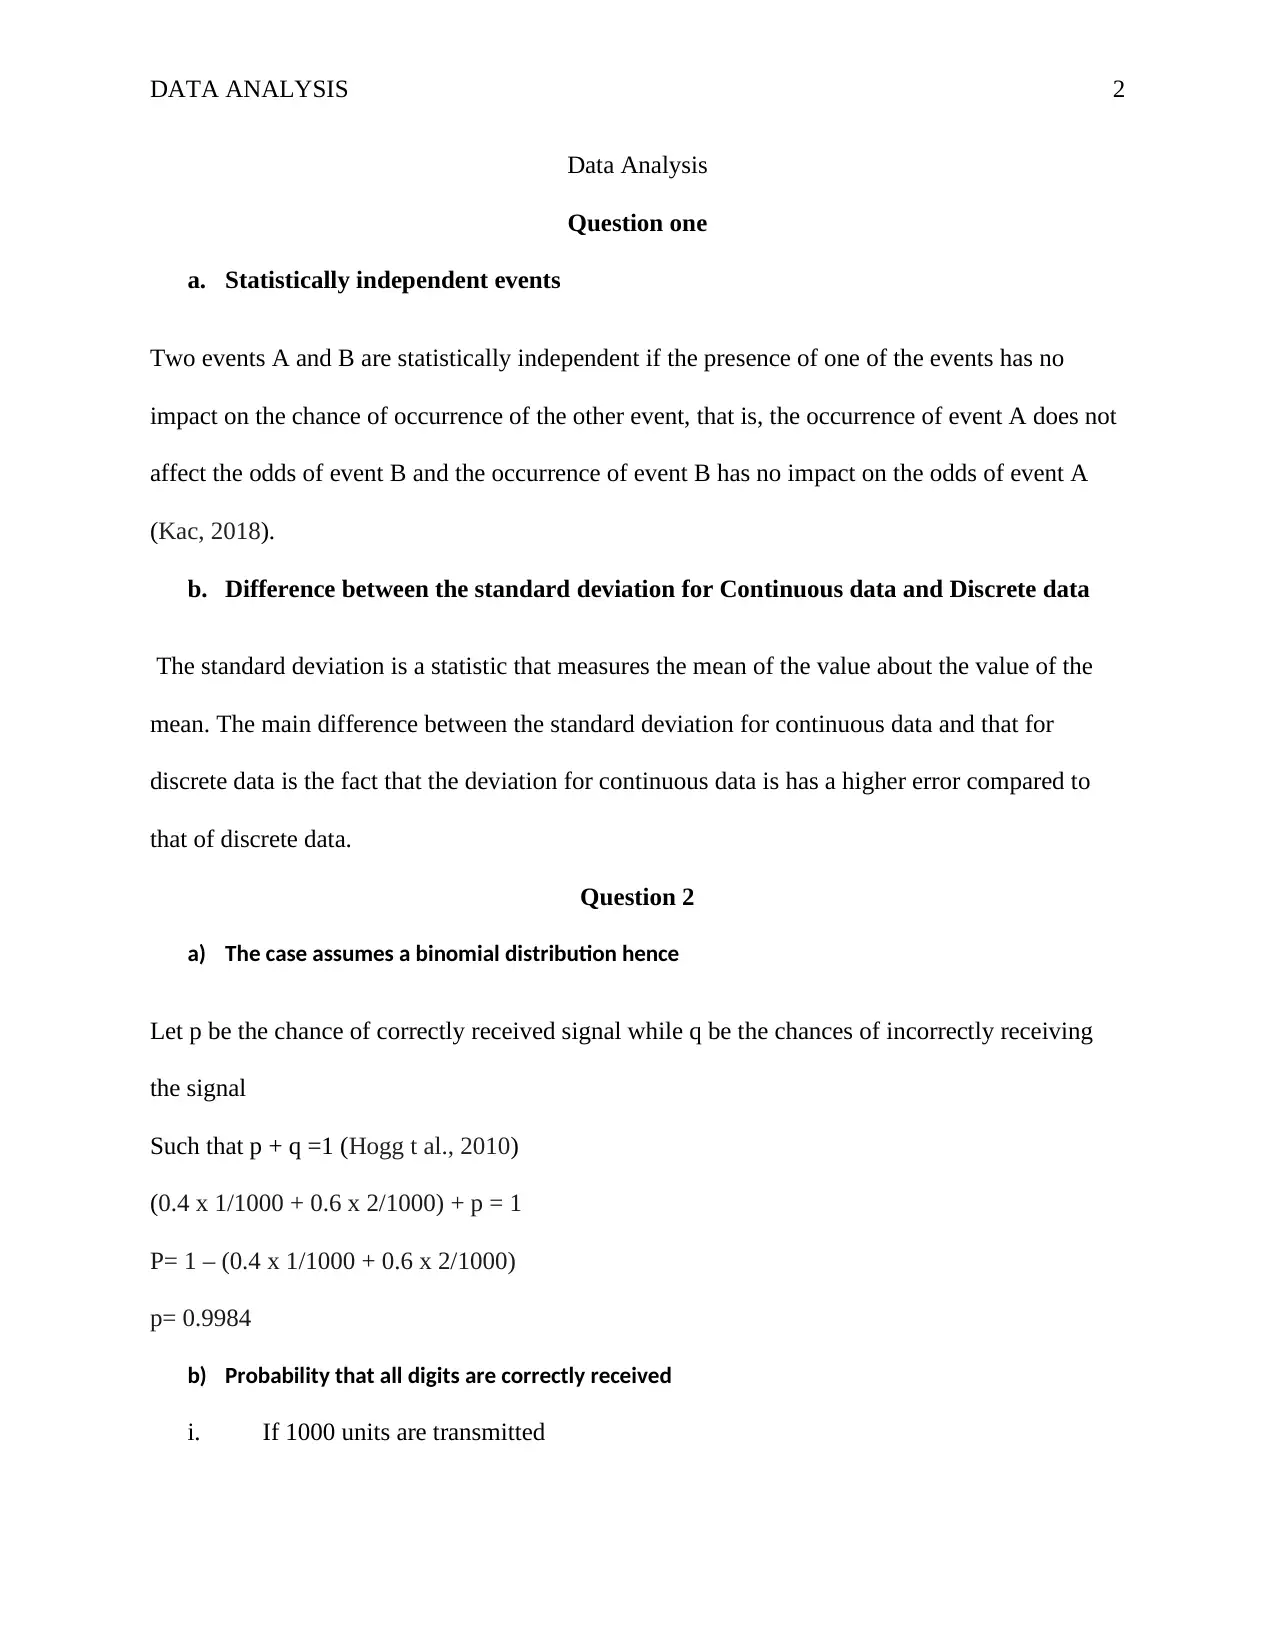
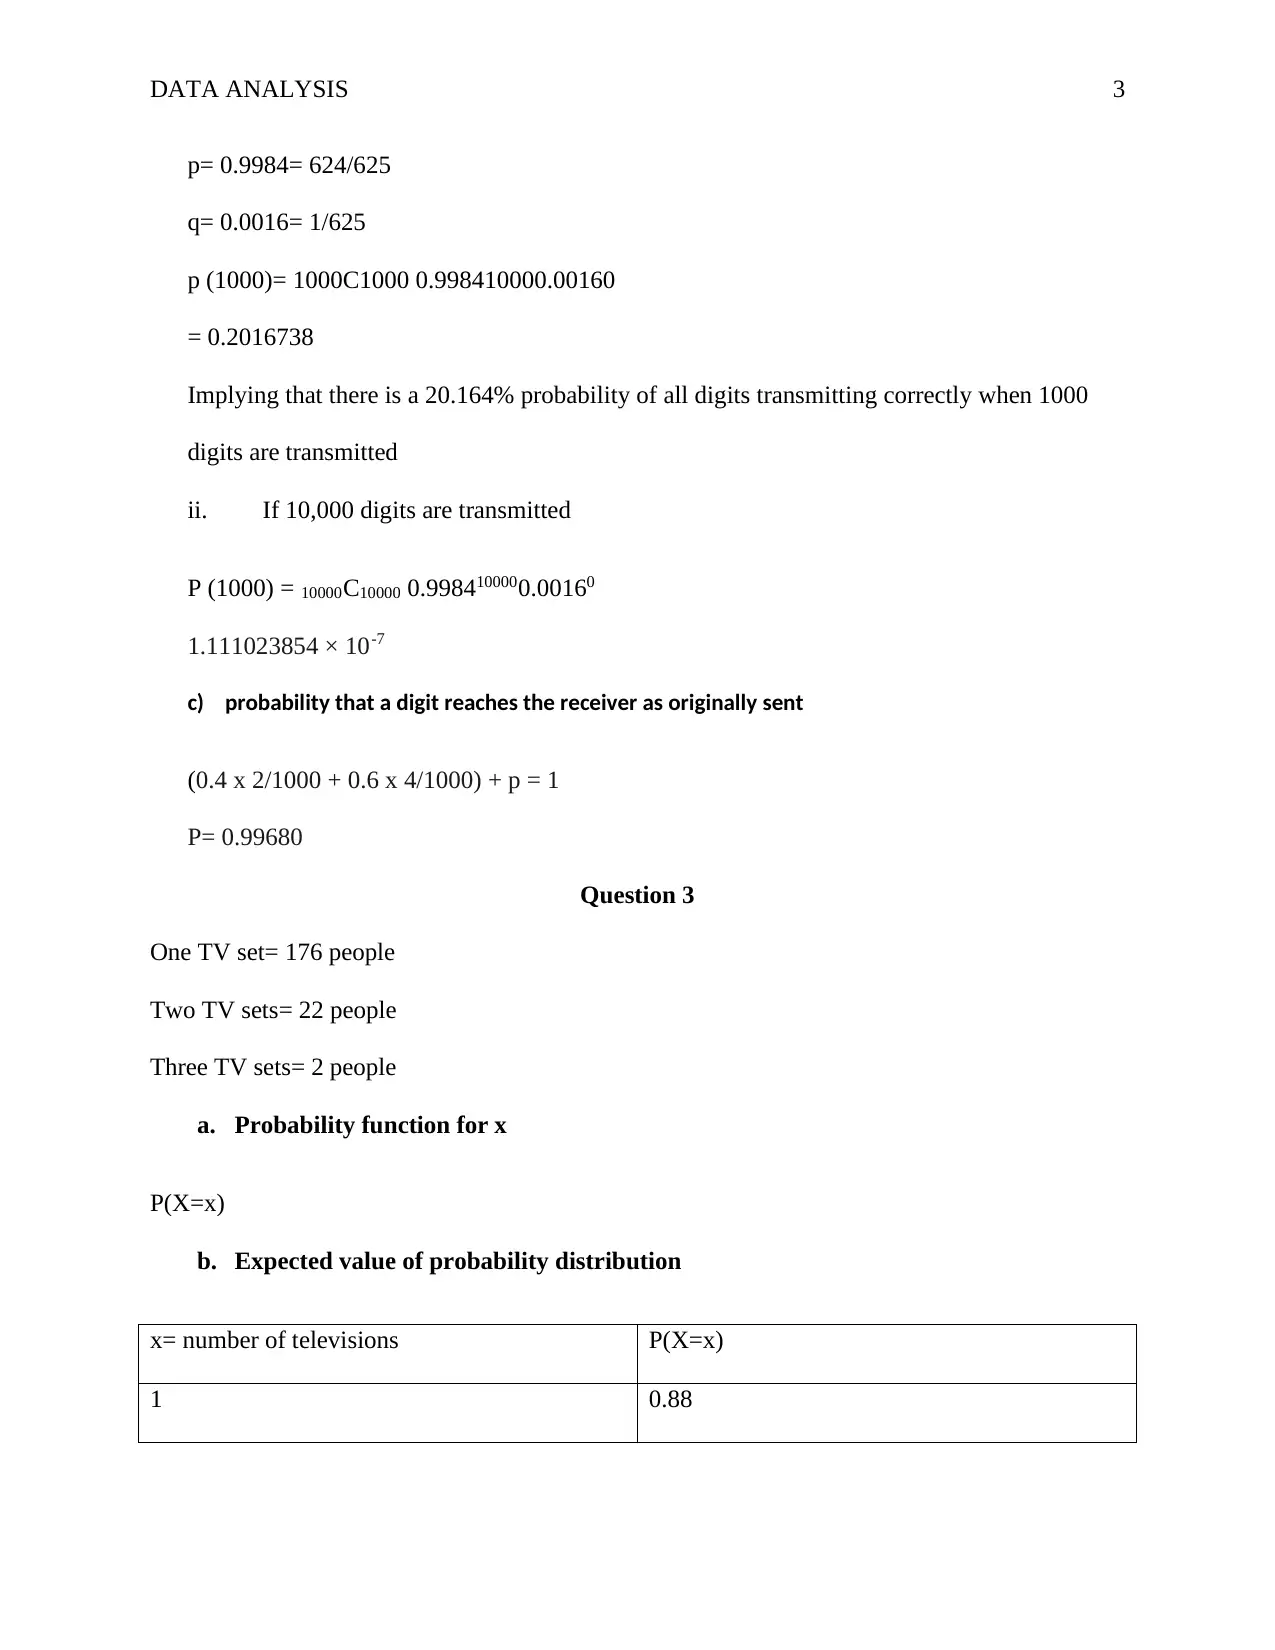
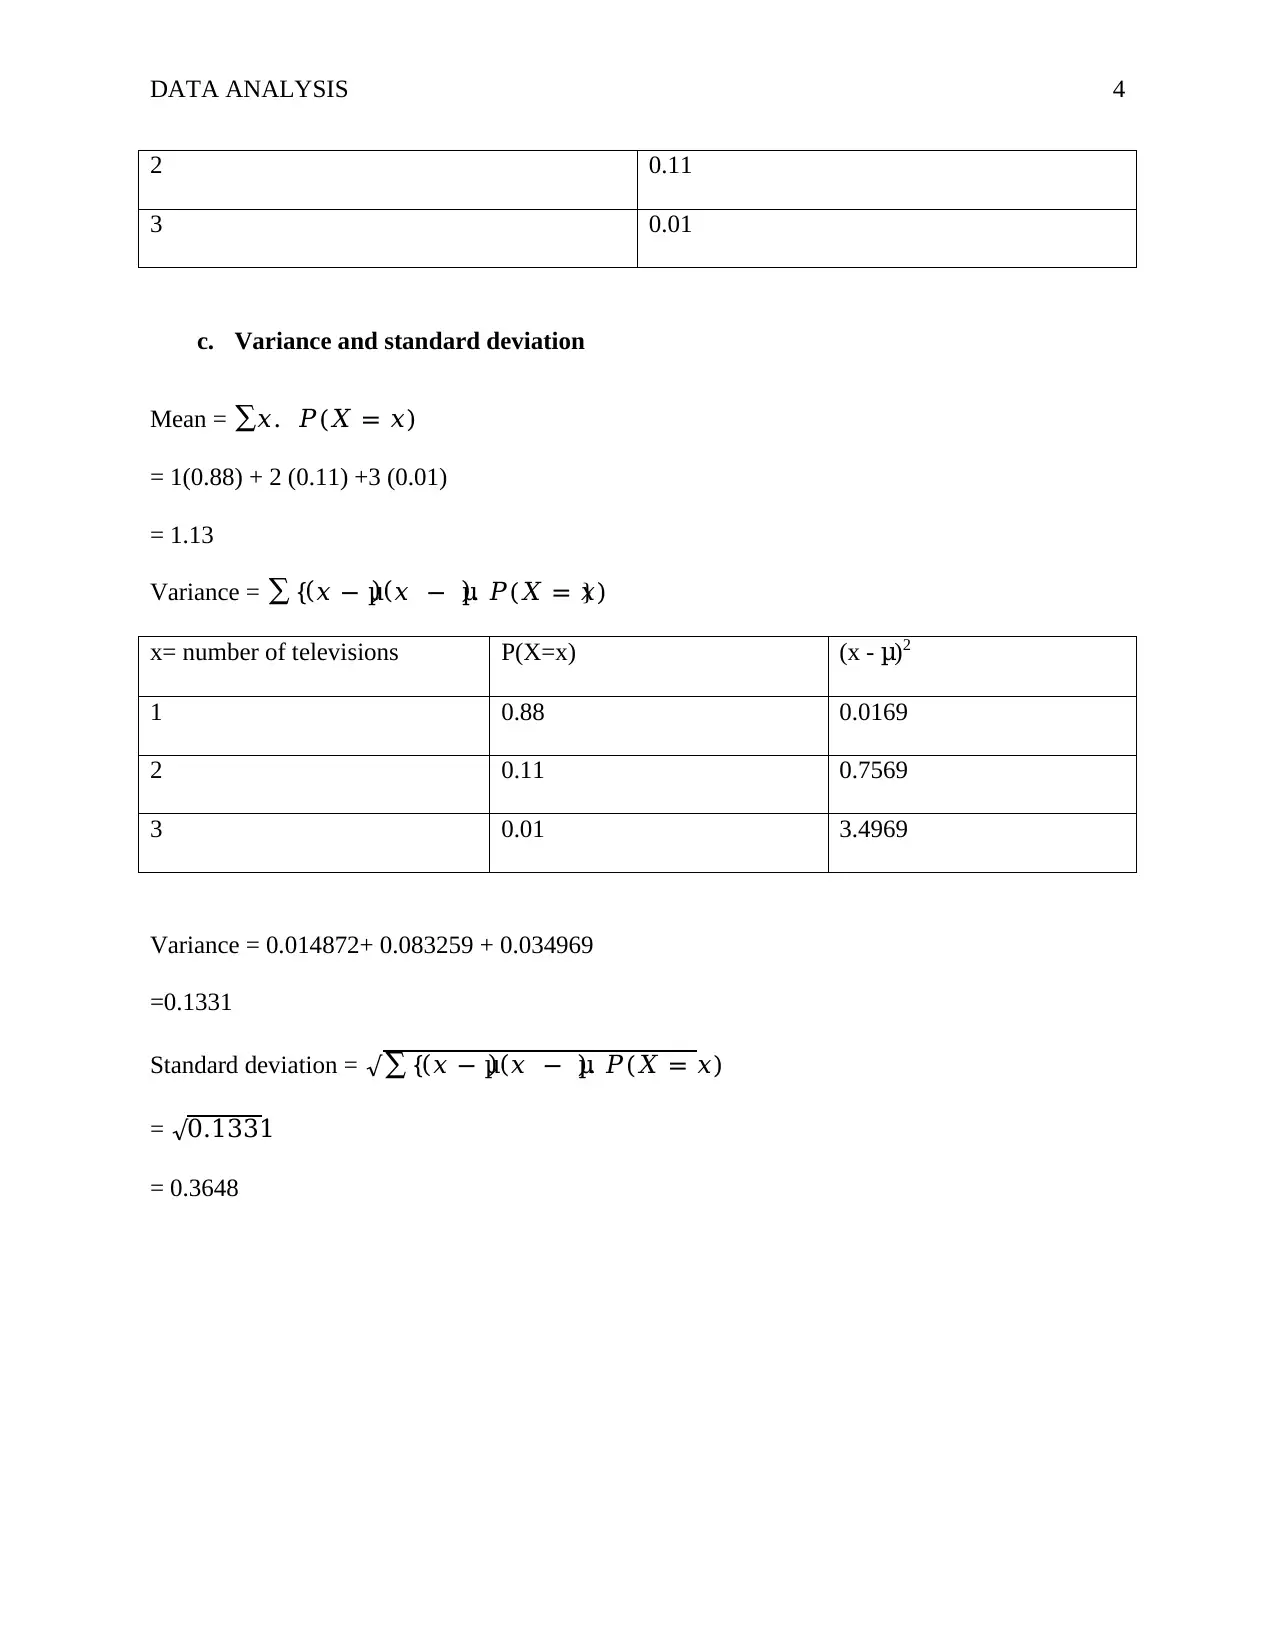
This document provides a complete solution to a data analysis assignment, addressing key concepts in probability and statistics. The assignment includes questions on statistical independence, the difference between standard deviations for continuous and discrete data, and the application of the binomial distribution to digital data transmission. The solution details the probability of correctly receiving transmitted digits, calculates probabilities for large datasets, and analyzes the probability function, expected value, variance, and standard deviation for a given scenario. The document provides step-by-step workings and explanations, making it a valuable resource for students studying statistics and data analysis.
Document Page
Running head: DATA ANALYSIS 1
Data Analysis
Students Name
Institution Affiliation
tabler-icon-diamond-filled.svg

Paraphrase This Document

Need a fresh take? Get an instant paraphrase of this document with our AI Paraphraser
Document Page
DATA ANALYSIS 2
Data Analysis
Question one
a. Statistically independent events
Two events A and B are statistically independent if the presence of one of the events has no
impact on the chance of occurrence of the other event, that is, the occurrence of event A does not
affect the odds of event B and the occurrence of event B has no impact on the odds of event A
(Kac, 2018).
b. Difference between the standard deviation for Continuous data and Discrete data
The standard deviation is a statistic that measures the mean of the value about the value of the
mean. The main difference between the standard deviation for continuous data and that for
discrete data is the fact that the deviation for continuous data is has a higher error compared to
that of discrete data.
Question 2
a) The case assumes a binomial distribution hence
Let p be the chance of correctly received signal while q be the chances of incorrectly receiving
the signal
Such that p + q =1 (Hogg t al., 2010)
(0.4 x 1/1000 + 0.6 x 2/1000) + p = 1
P= 1 – (0.4 x 1/1000 + 0.6 x 2/1000)
p= 0.9984
b) Probability that all digits are correctly received
i. If 1000 units are transmitted
Document Page
DATA ANALYSIS 3
p= 0.9984= 624/625
q= 0.0016= 1/625
p (1000)= 1000C1000 0.998410000.00160
= 0.2016738
Implying that there is a 20.164% probability of all digits transmitting correctly when 1000
digits are transmitted
ii. If 10,000 digits are transmitted
P (1000) = 10000C10000 0.9984100000.00160
1.111023854 × 10⁻⁷
c) probability that a digit reaches the receiver as originally sent
(0.4 x 2/1000 + 0.6 x 4/1000) + p = 1
P= 0.99680
Question 3
One TV set= 176 people
Two TV sets= 22 people
Three TV sets= 2 people
a. Probability function for x
P(X=x)
b. Expected value of probability distribution
x= number of televisions P(X=x)
1 0.88
Document Page
DATA ANALYSIS 4
2 0.11
3 0.01
c. Variance and standard deviation
Mean = 𝑥. 𝑃(𝑋 = 𝑥)
= 1(0.88) + 2 (0.11) +3 (0.01)
= 1.13
Variance = {(𝑥 − μ)(𝑥 μ). 𝑃(𝑋 = 𝑥)}
x= number of televisions P(X=x) (x - μ)2
1 0.88 0.0169
2 0.11 0.7569
3 0.01 3.4969
Variance = 0.014872+ 0.083259 + 0.034969
=0.1331
Standard deviation = {(𝑥 − μ)(𝑥 μ). 𝑃(𝑋 = 𝑥)
= 0.1331
= 0.3648
tabler-icon-diamond-filled.svg

Paraphrase This Document

Need a fresh take? Get an instant paraphrase of this document with our AI Paraphraser
Document Page
DATA ANALYSIS 5
References
Hogg, R. V., Tanis, E. A., & Zimmerman, D. L. (2010). Probability and statistical inference.
Pearson/Prentice Hall.
Kac, M. (2018). Statistical Independence in Probability, Analysis and Number. Courier Dover
Publications.
chevron_up_icon
1 out of 5
circle_padding
hide_on_mobile
zoom_out_icon
[object Object]