BSB123 Data Analysis: GPA, SES & Other Student Performance Factors
VerifiedAdded on 2023/06/03
|14
|1588
|320
Report
AI Summary
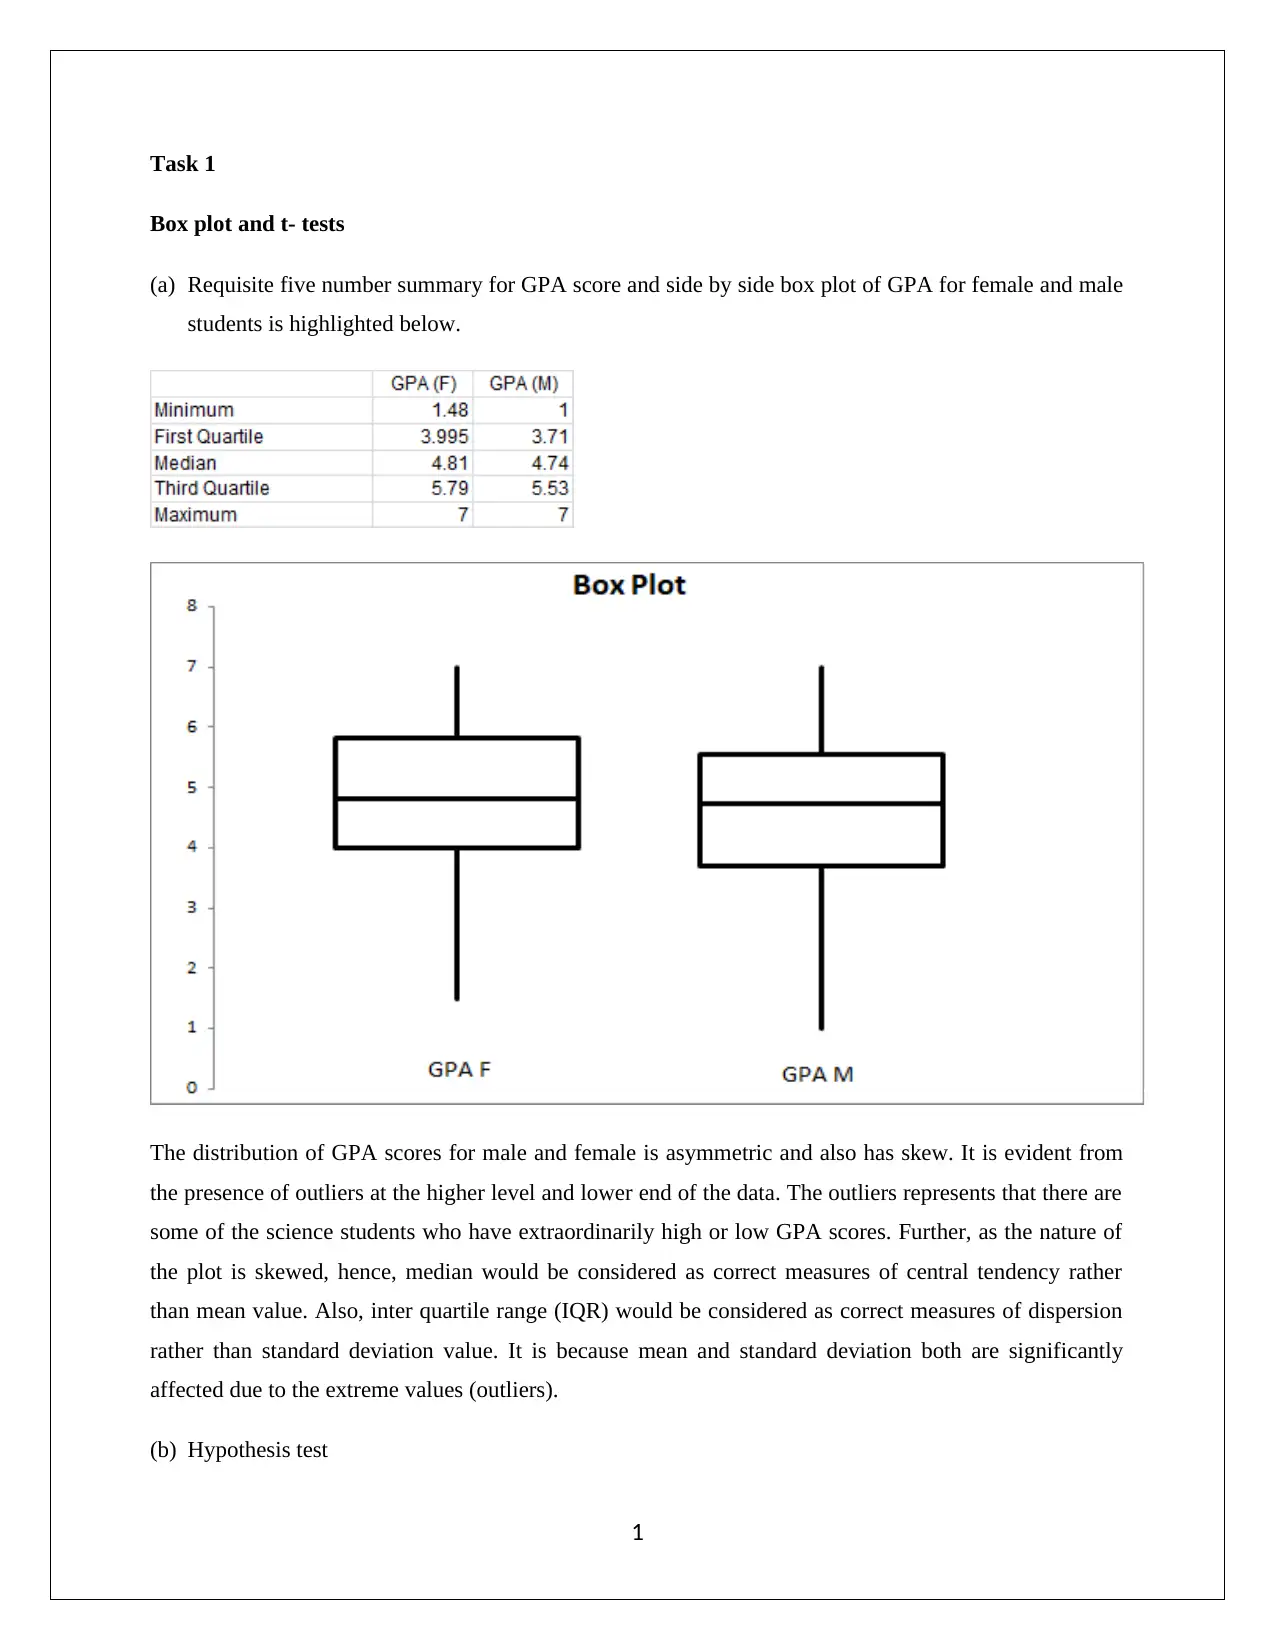
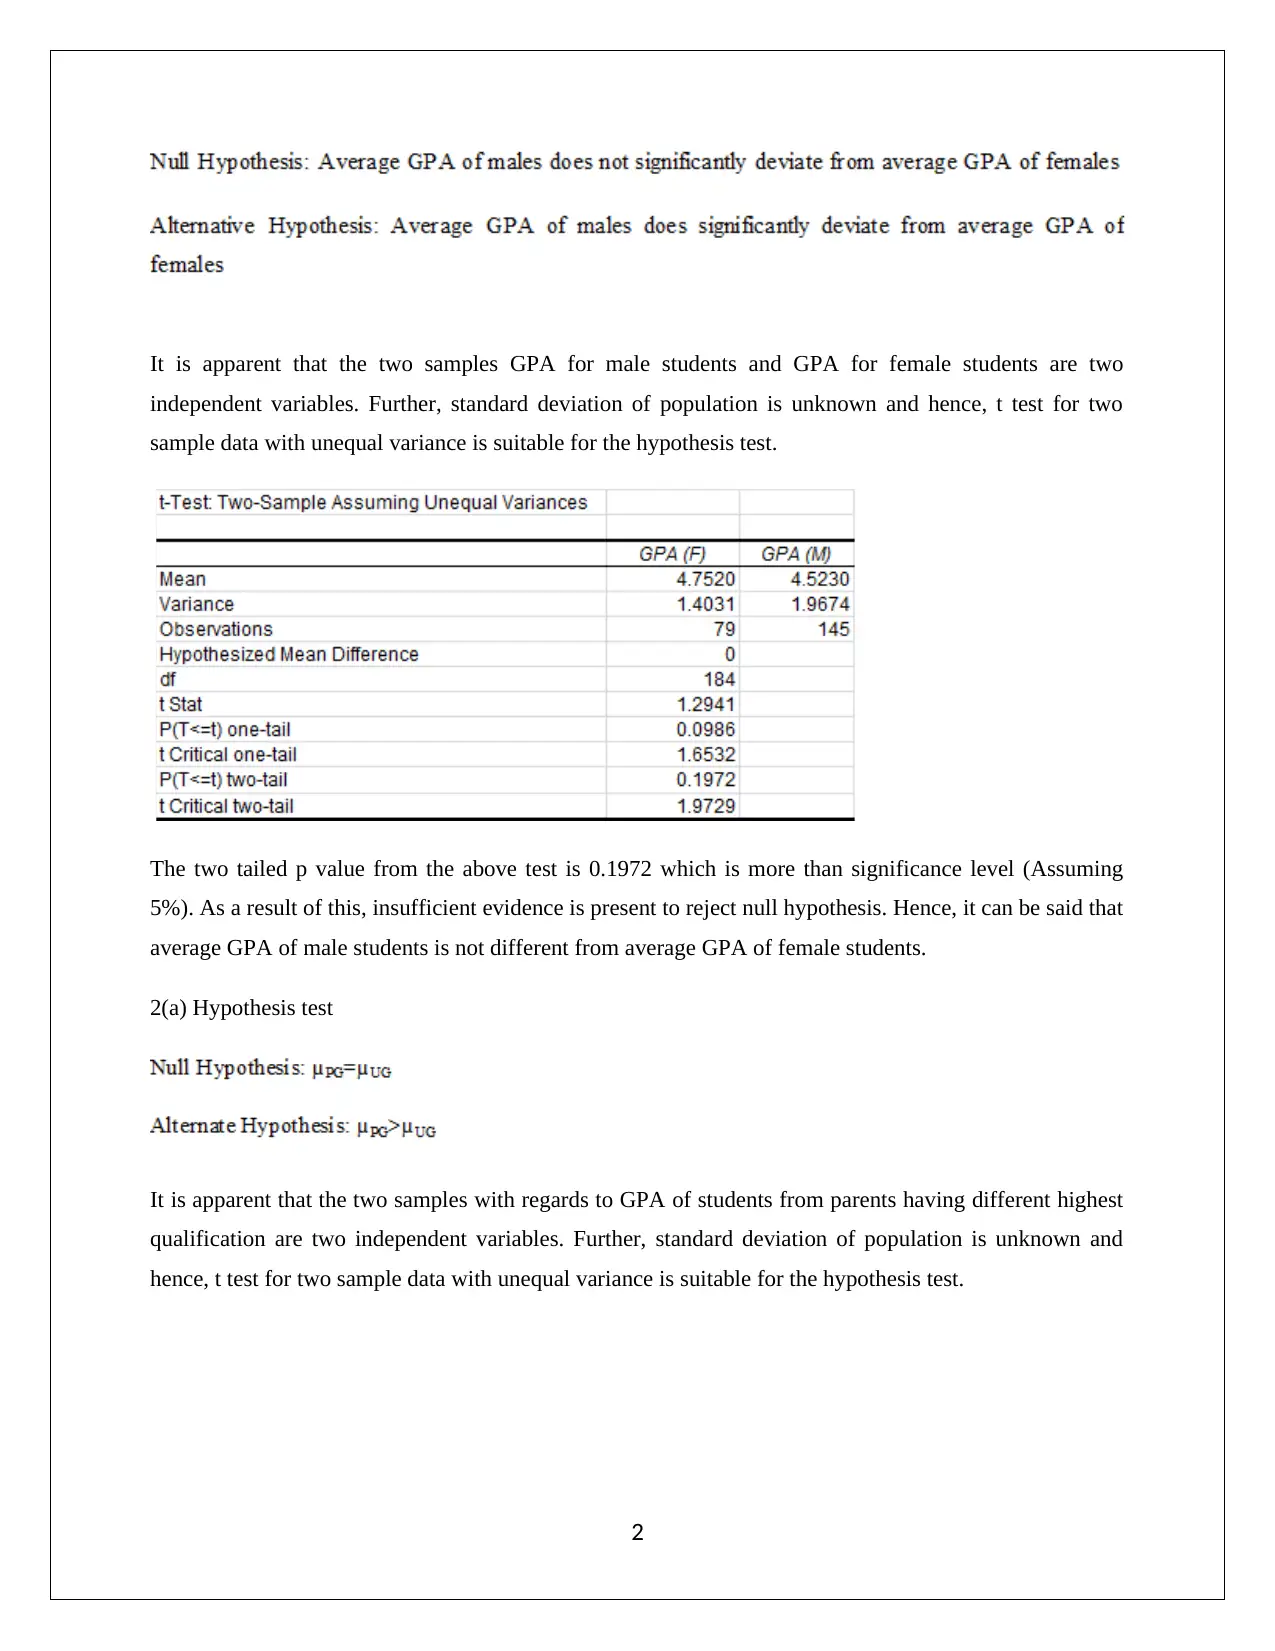
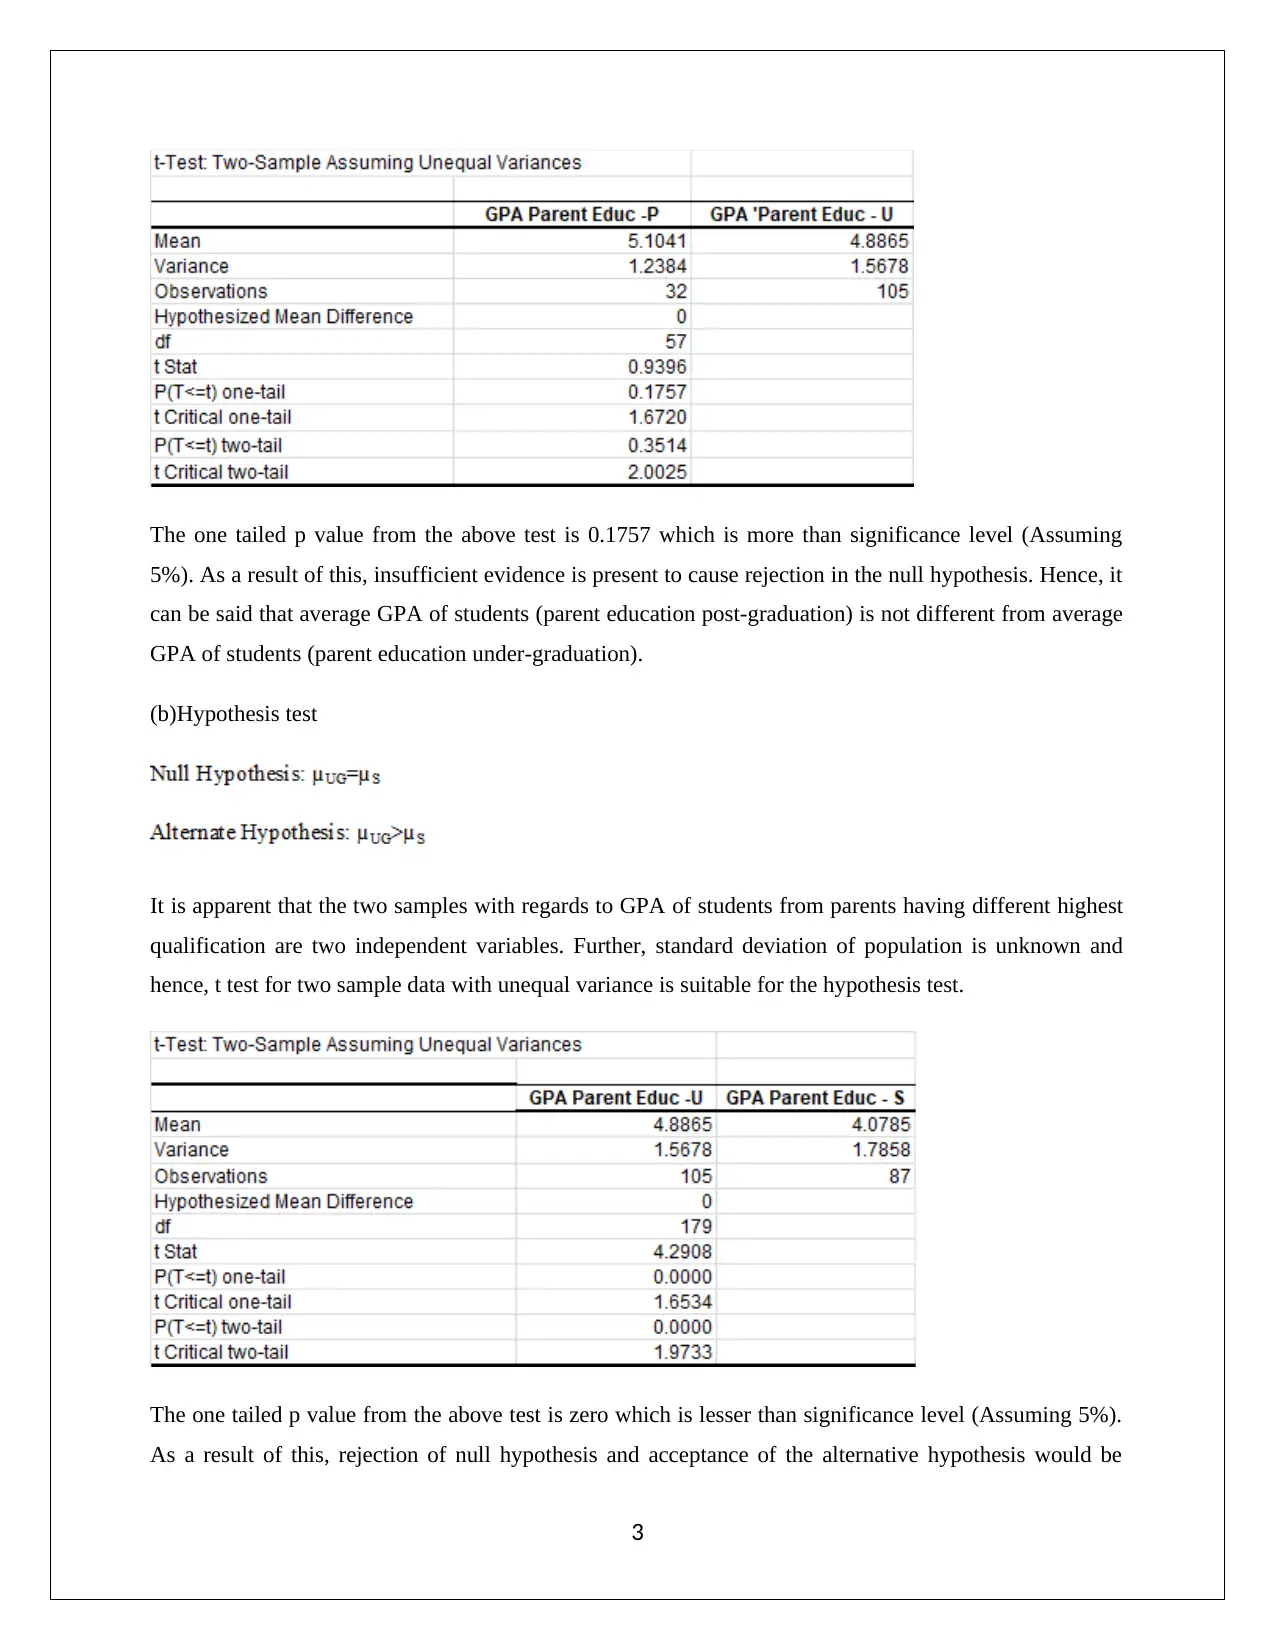
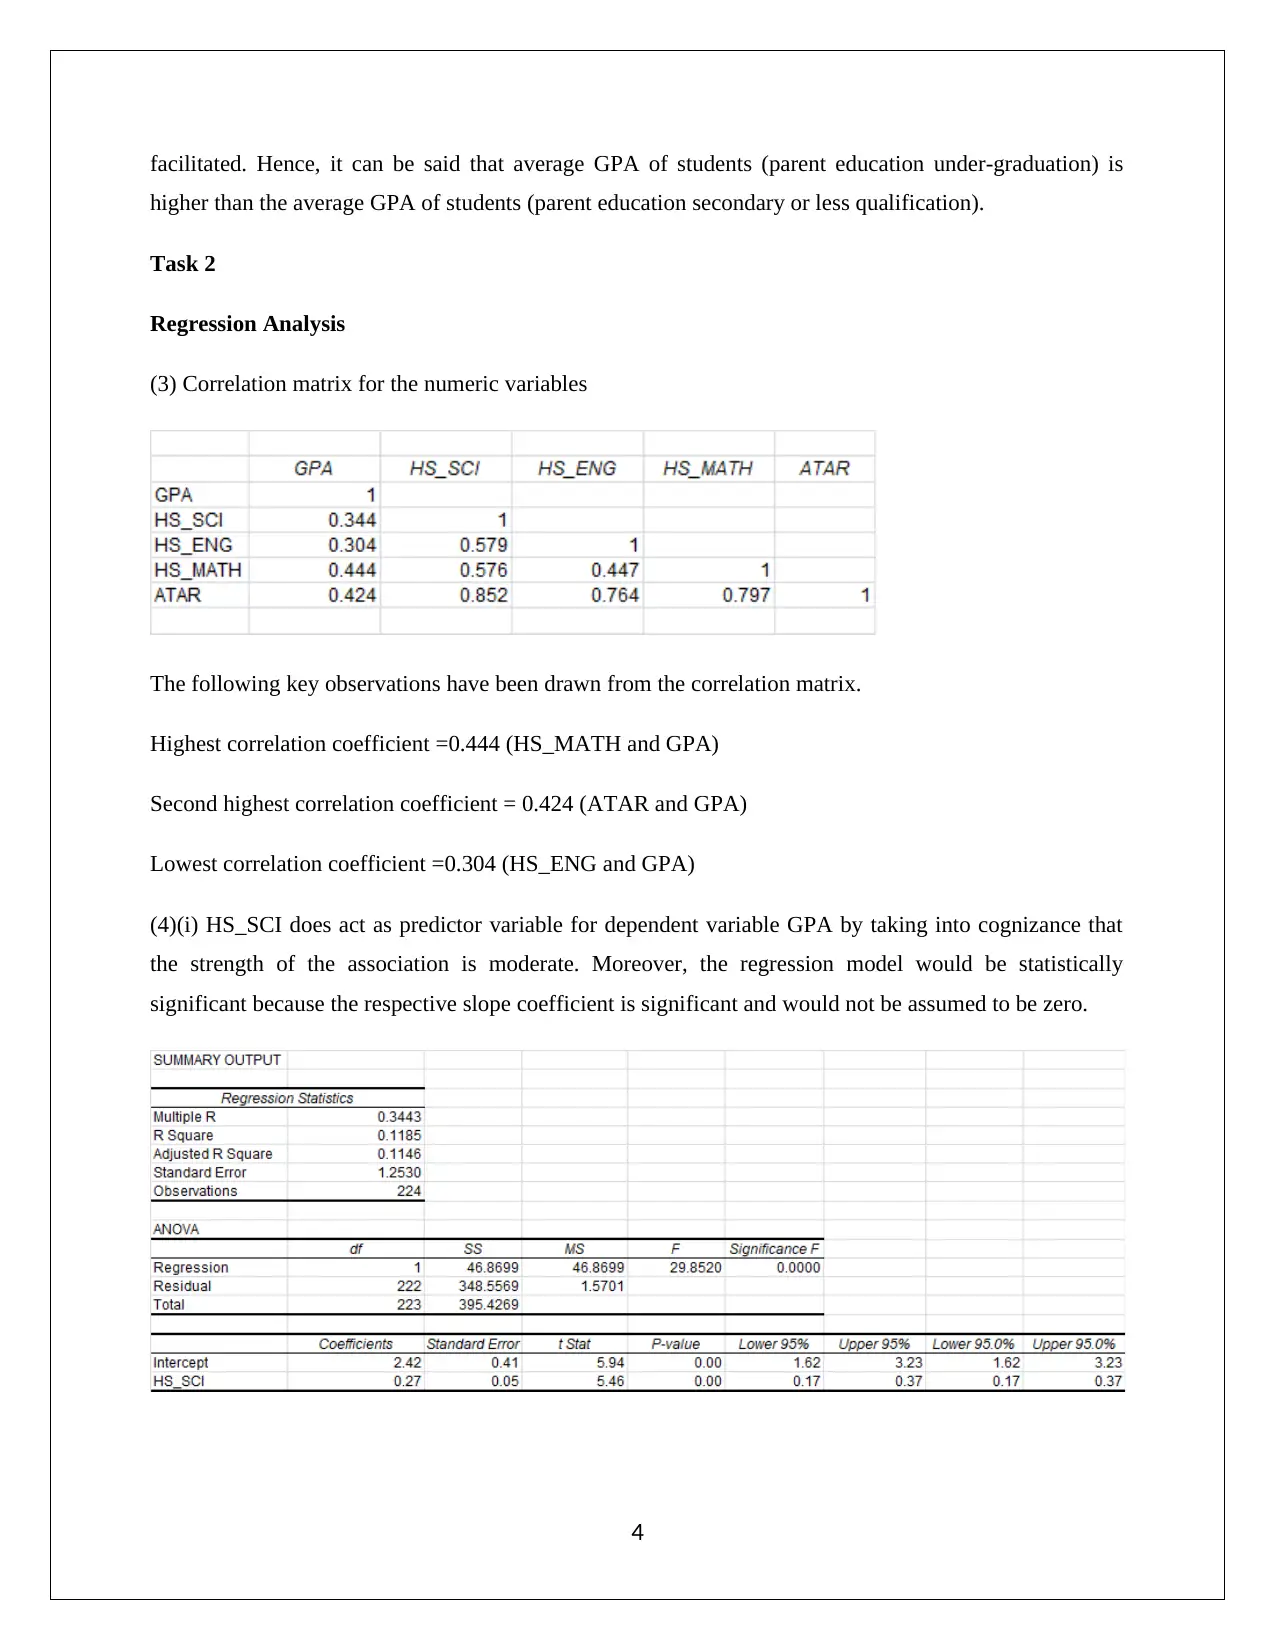
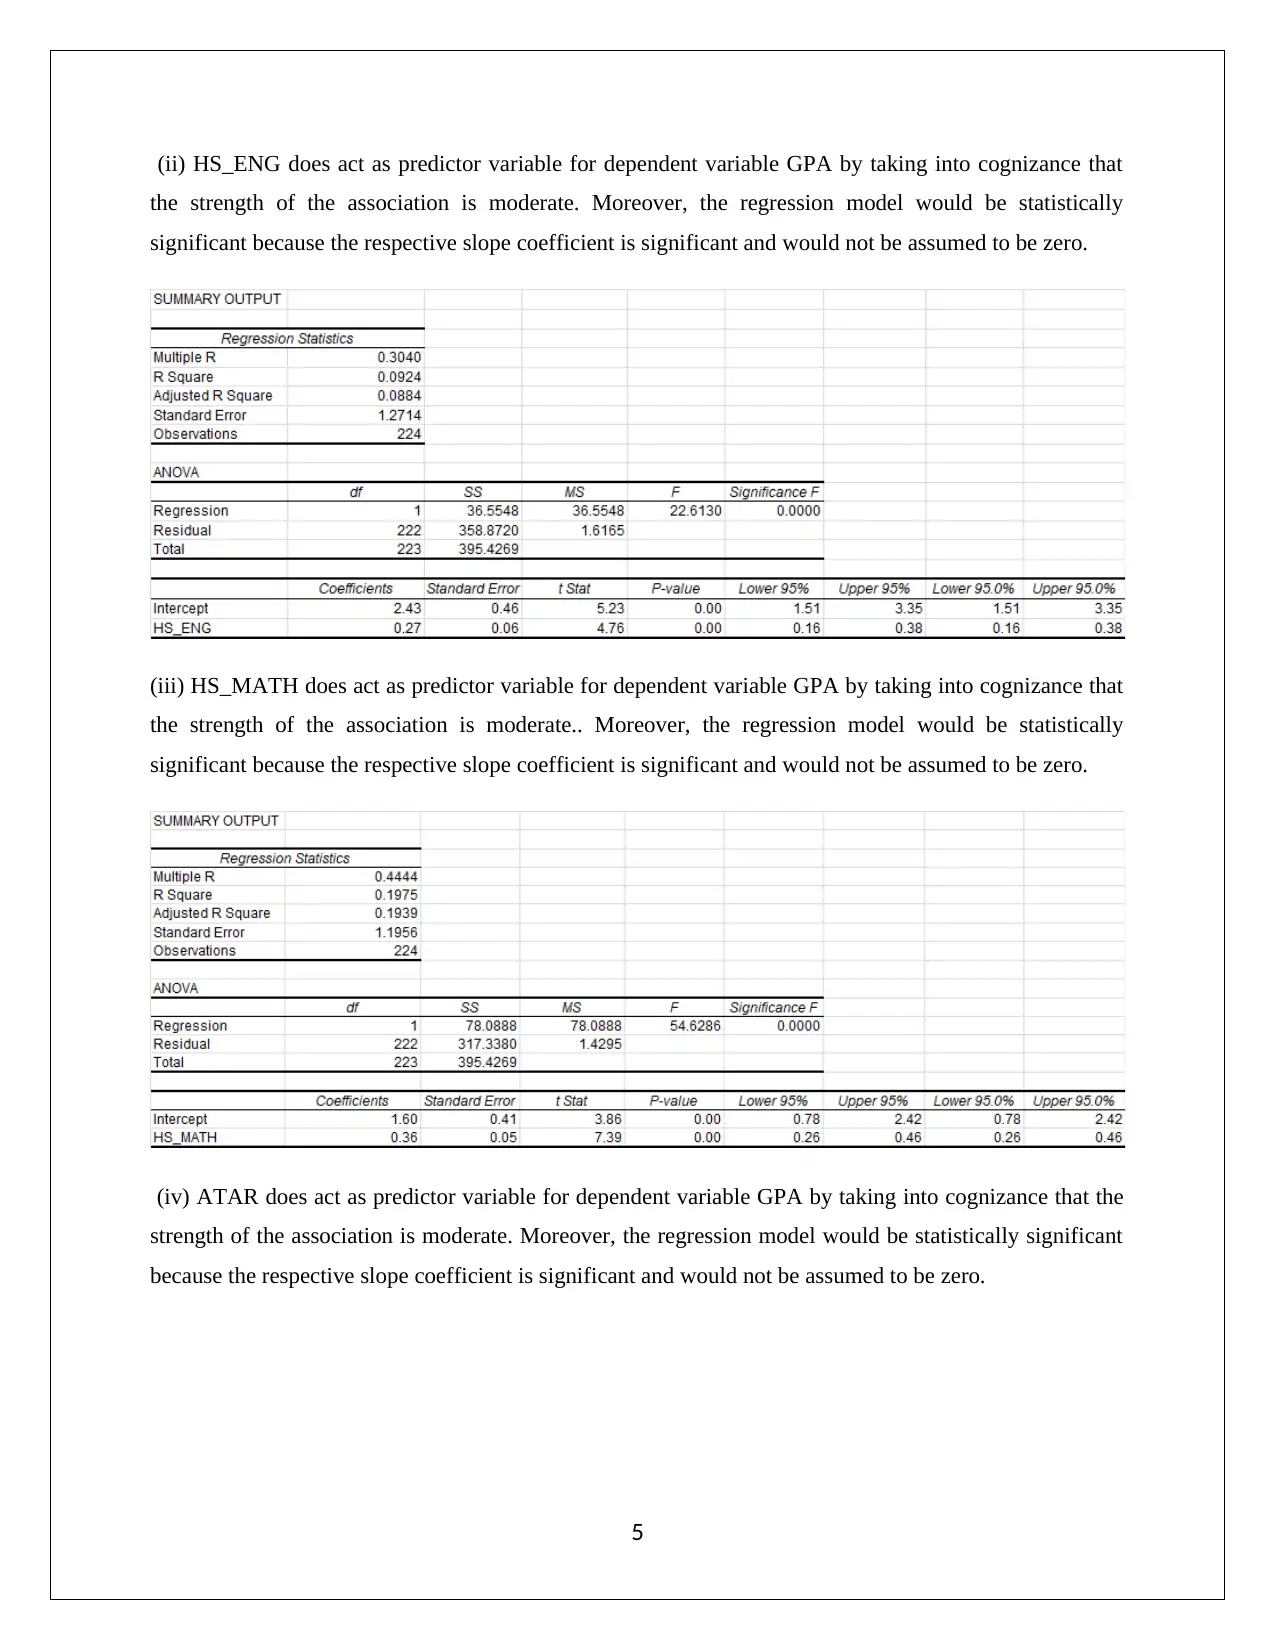
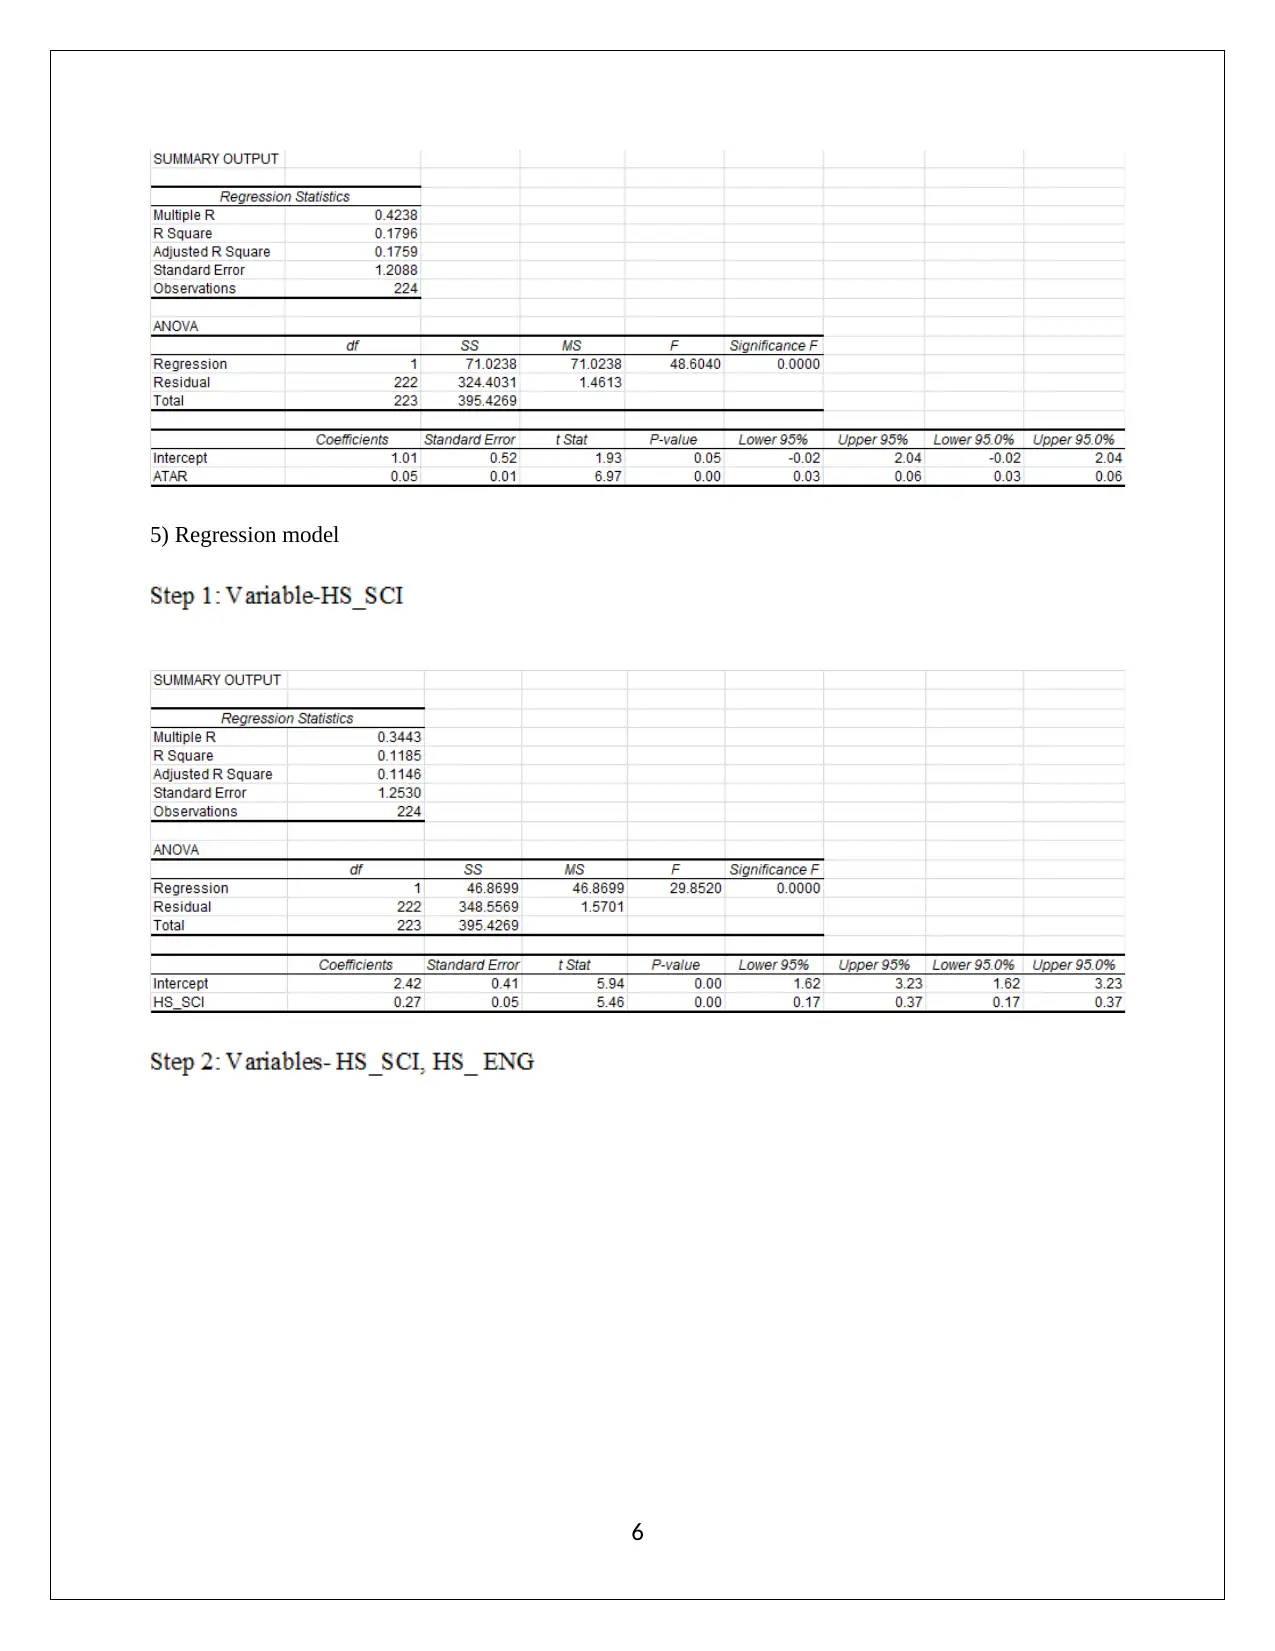
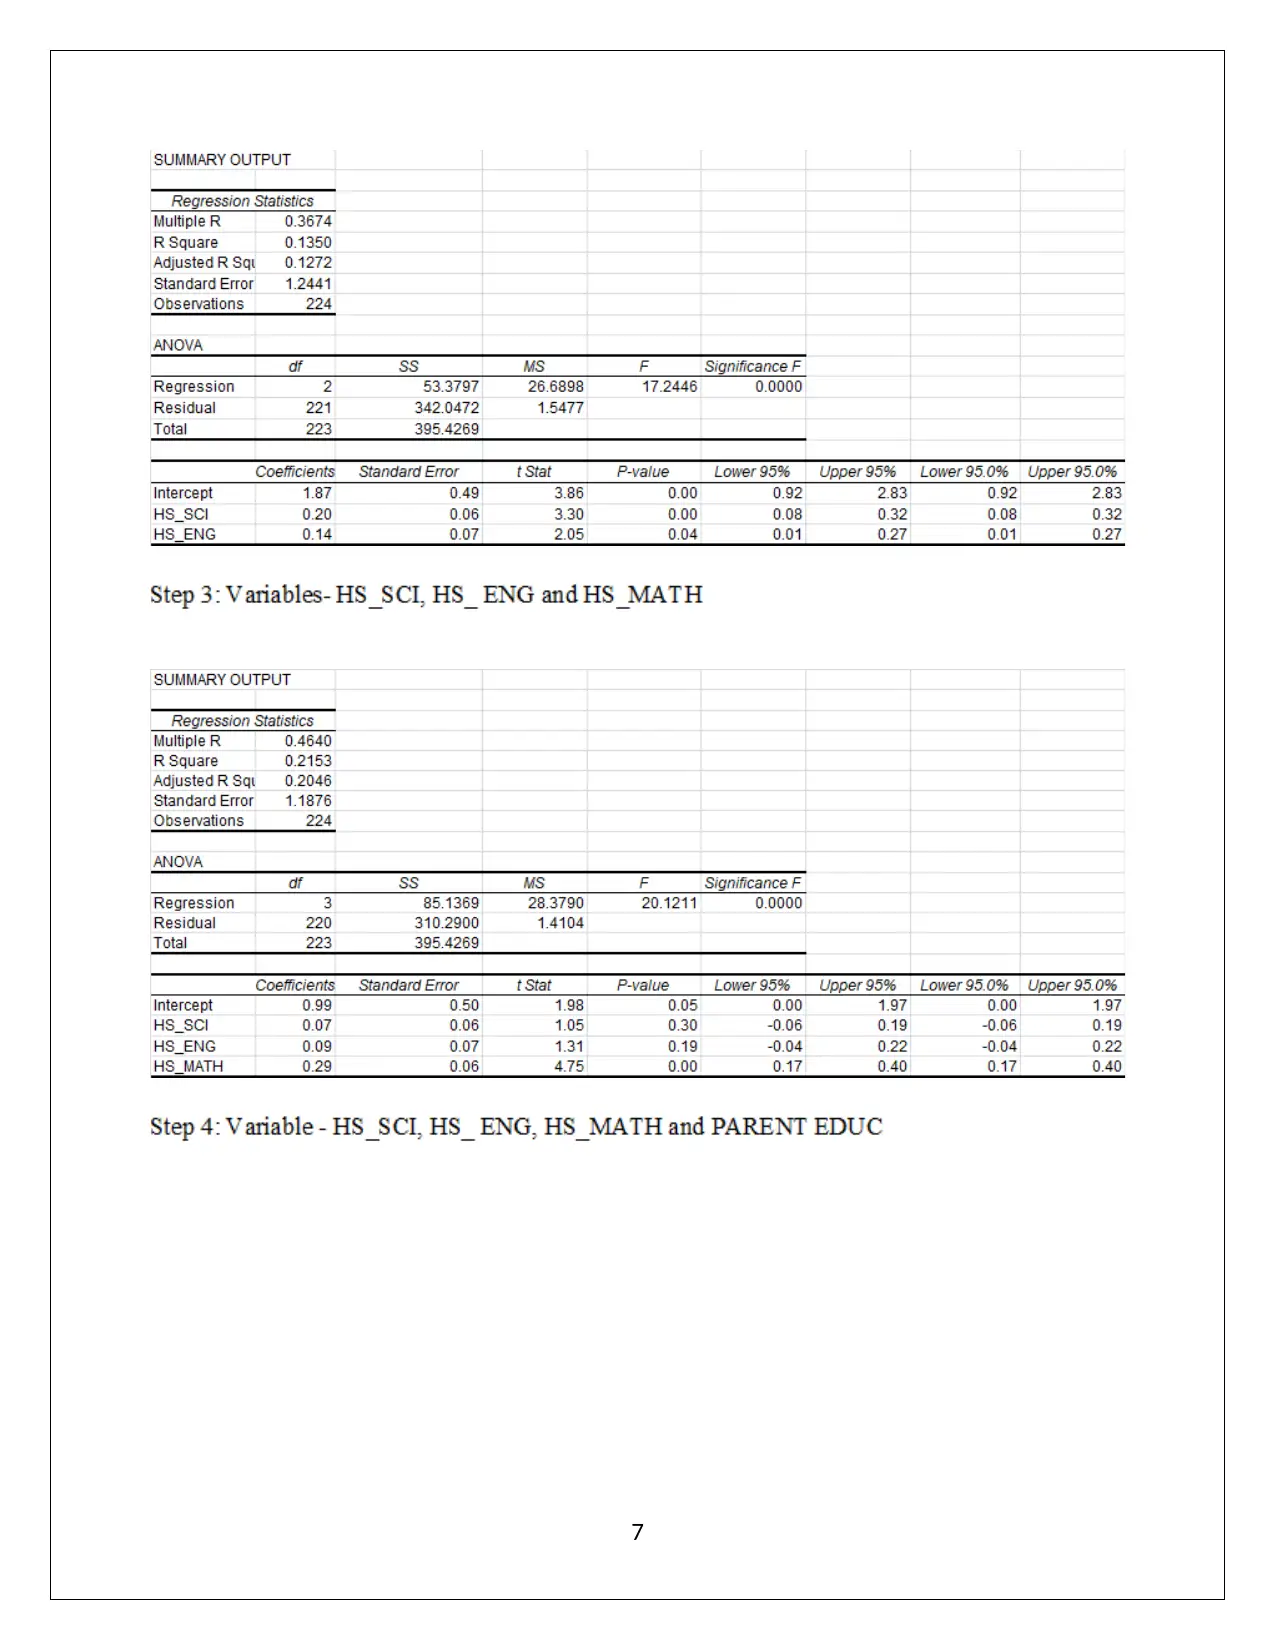
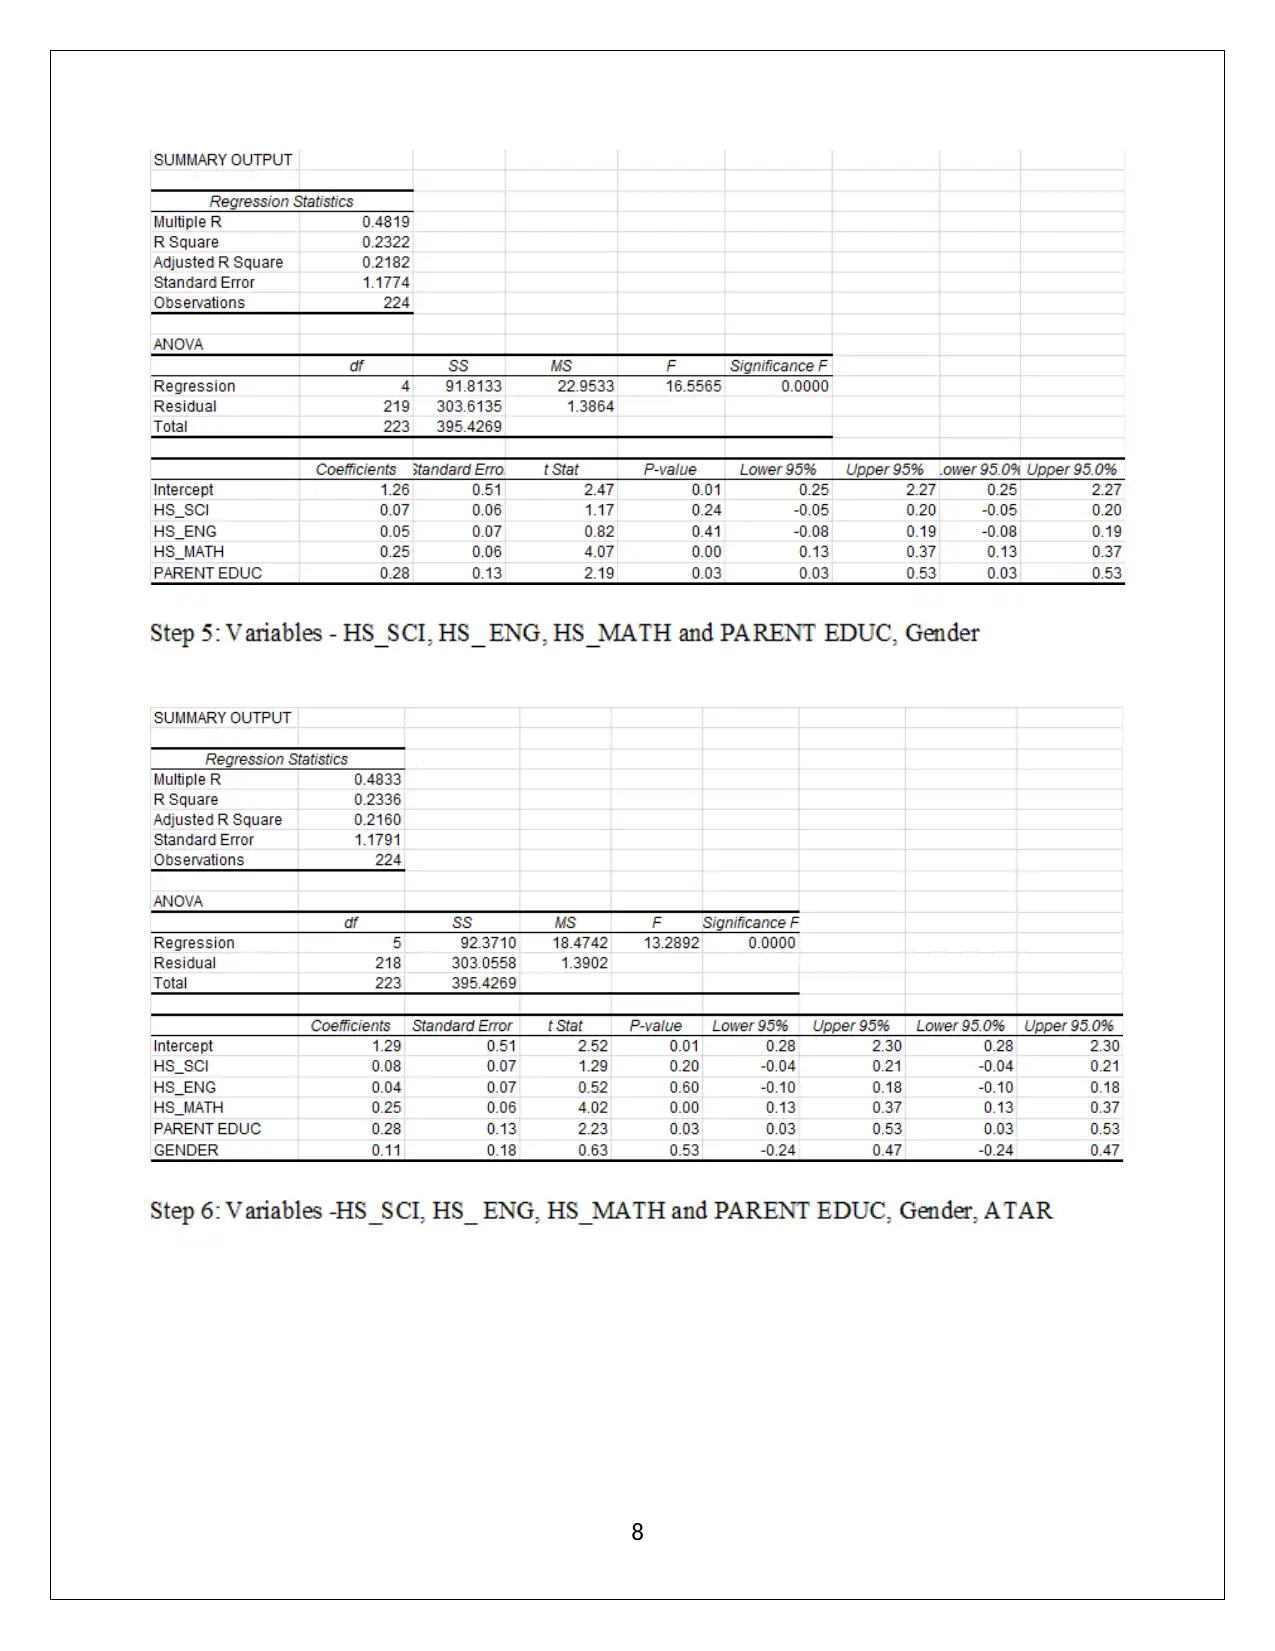
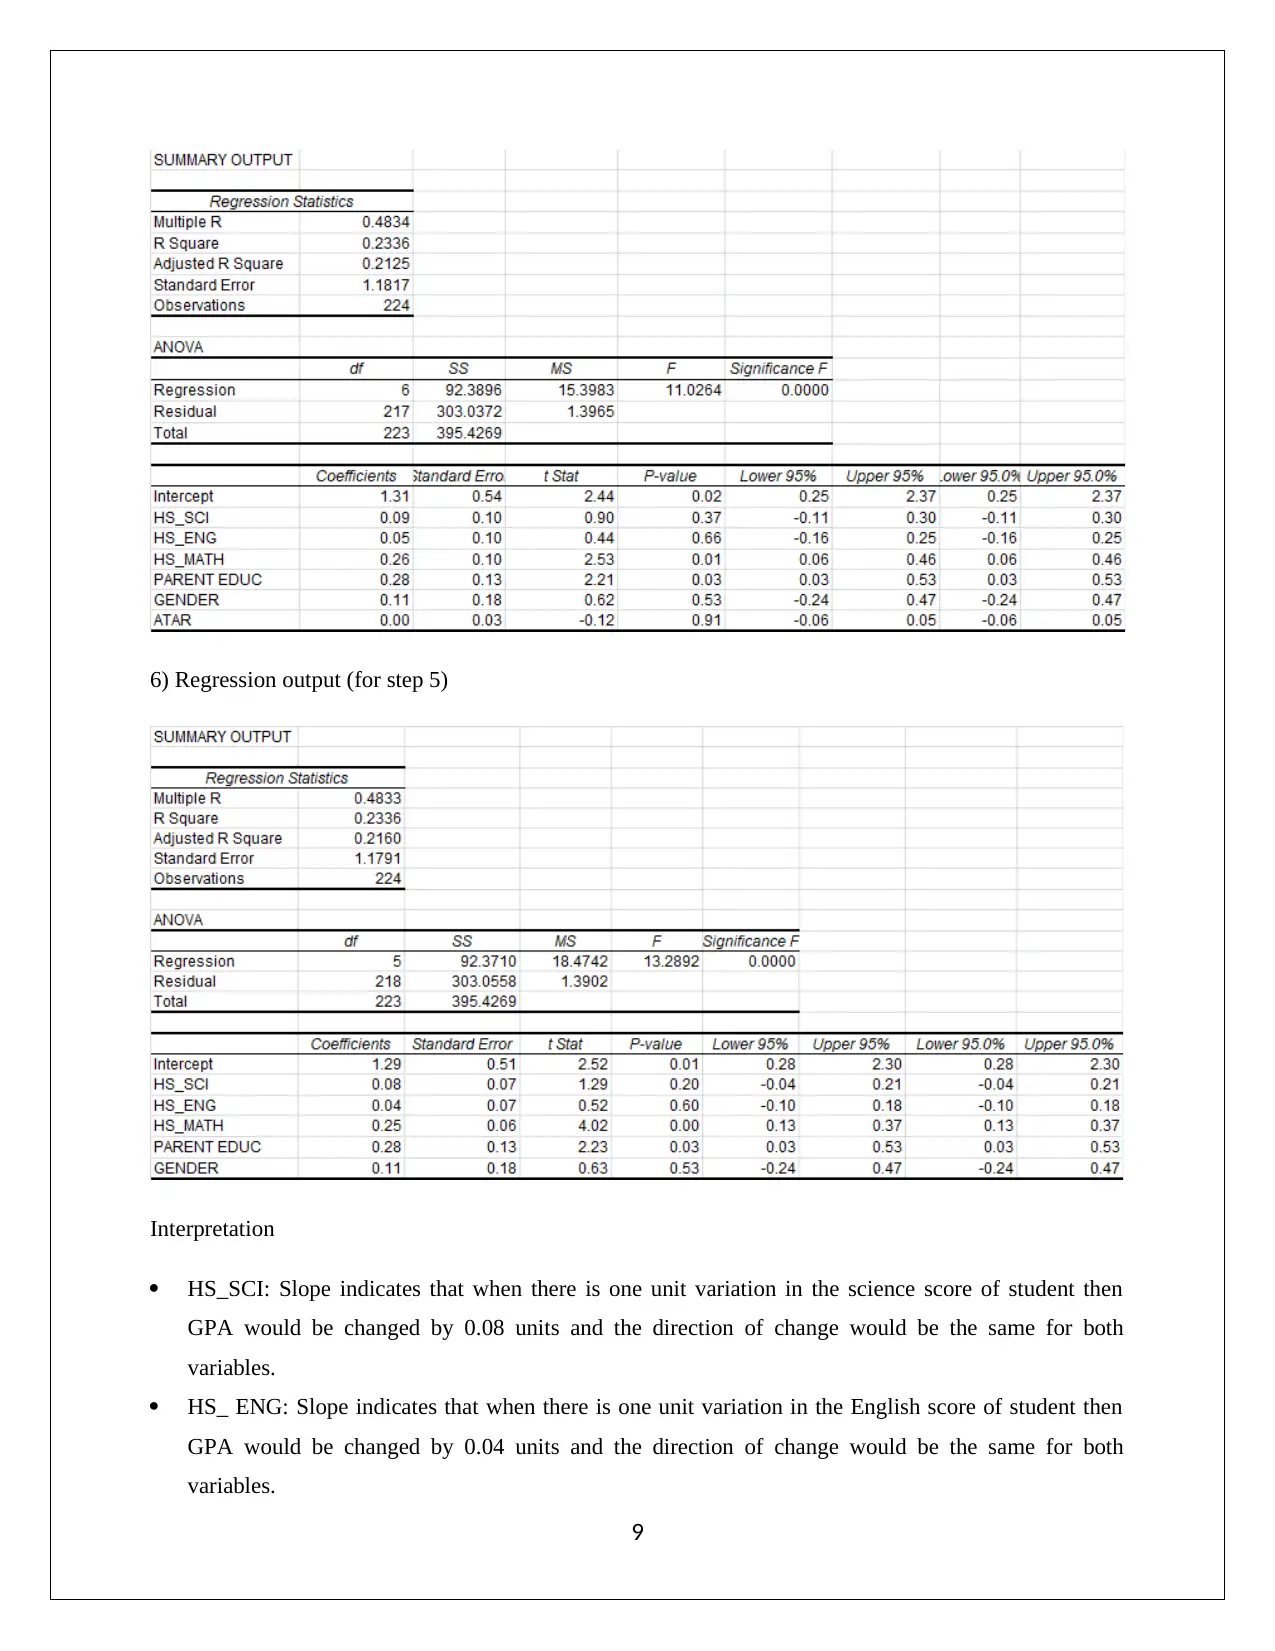
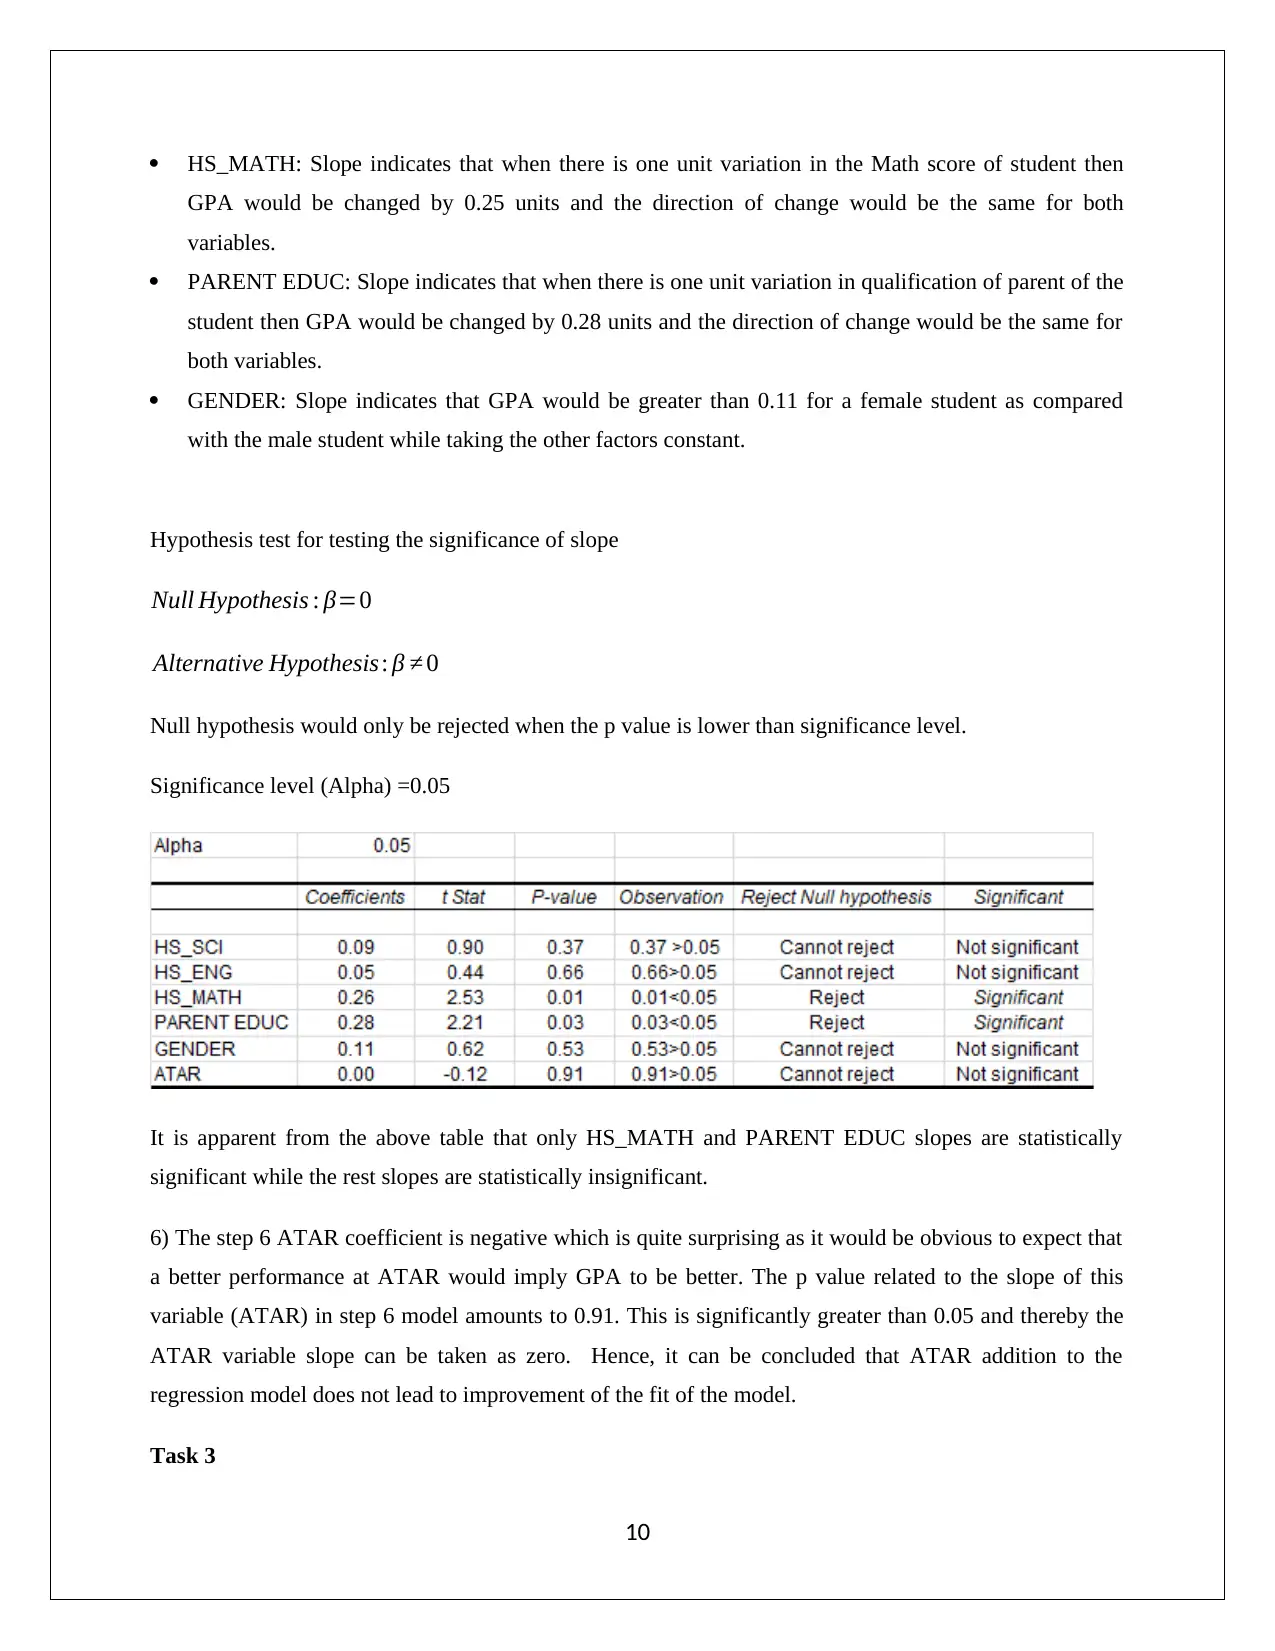
This report investigates factors influencing the academic performance, measured by GPA, of first-year science students. It uses hypothesis testing and regression analysis to assess the impact of variables like high school scores (science, English, math), ATAR, socioeconomic status (SES), and gender. The analysis reveals that parental education level significantly impacts GPA, while gender does not show a significant difference. Regression models highlight the importance of high school math scores and parental education, but also indicate a need for additional variables like student intelligence or study habits to improve the model's predictive power. The report concludes by suggesting improvements for future models to better understand and predict student GPA. Desklib provides access to similar solved assignments and study tools for students.

1 out of 14
Related Documents


Your All-in-One AI-Powered Toolkit for Academic Success.
+13062052269
info@desklib.com
Available 24*7 on WhatsApp / Email
![[object Object]](/_next/static/media/star-bottom.7253800d.svg)
Copyright © 2020–2026 A2Z Services. All Rights Reserved. Developed and managed by ZUCOL.