In-Depth Data Analysis Report: Exploring Relationships & Insights
VerifiedAdded on 2023/06/14
|15
|2791
|155
Report
AI Summary
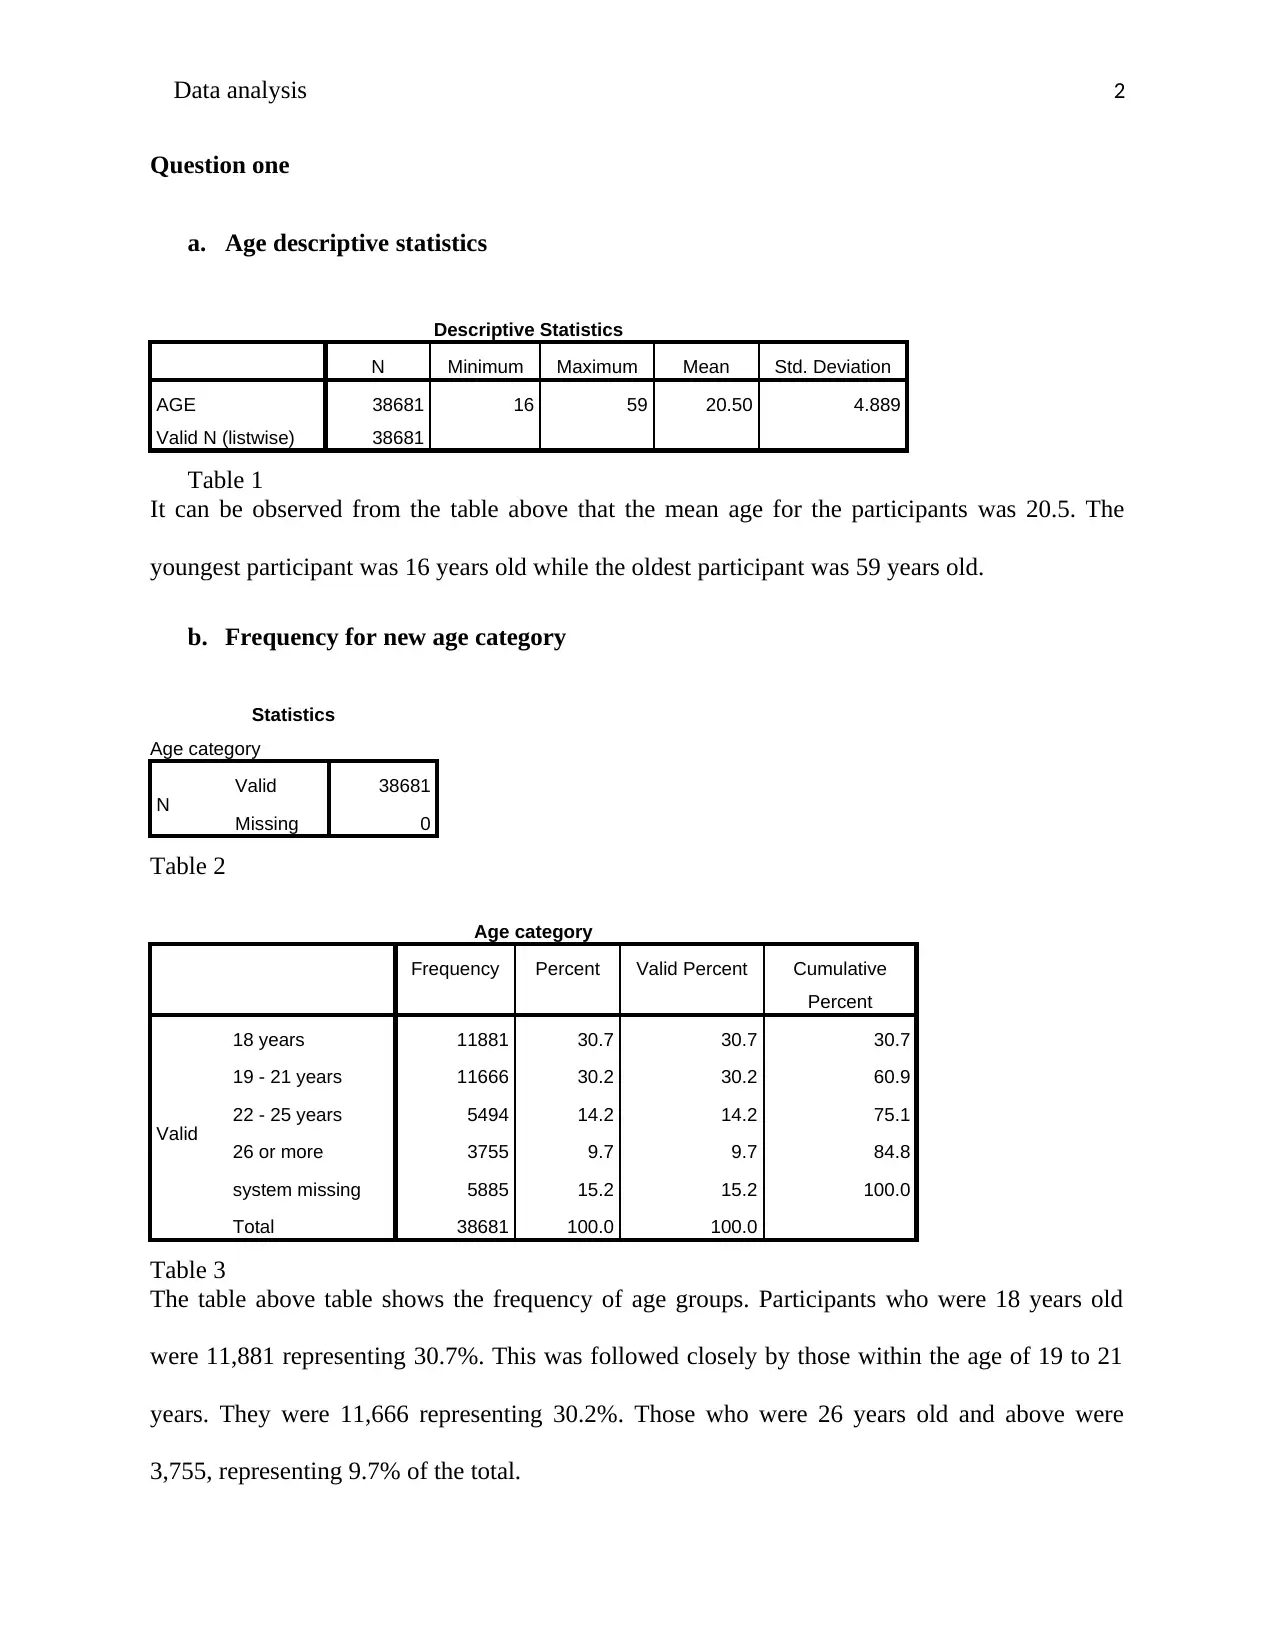
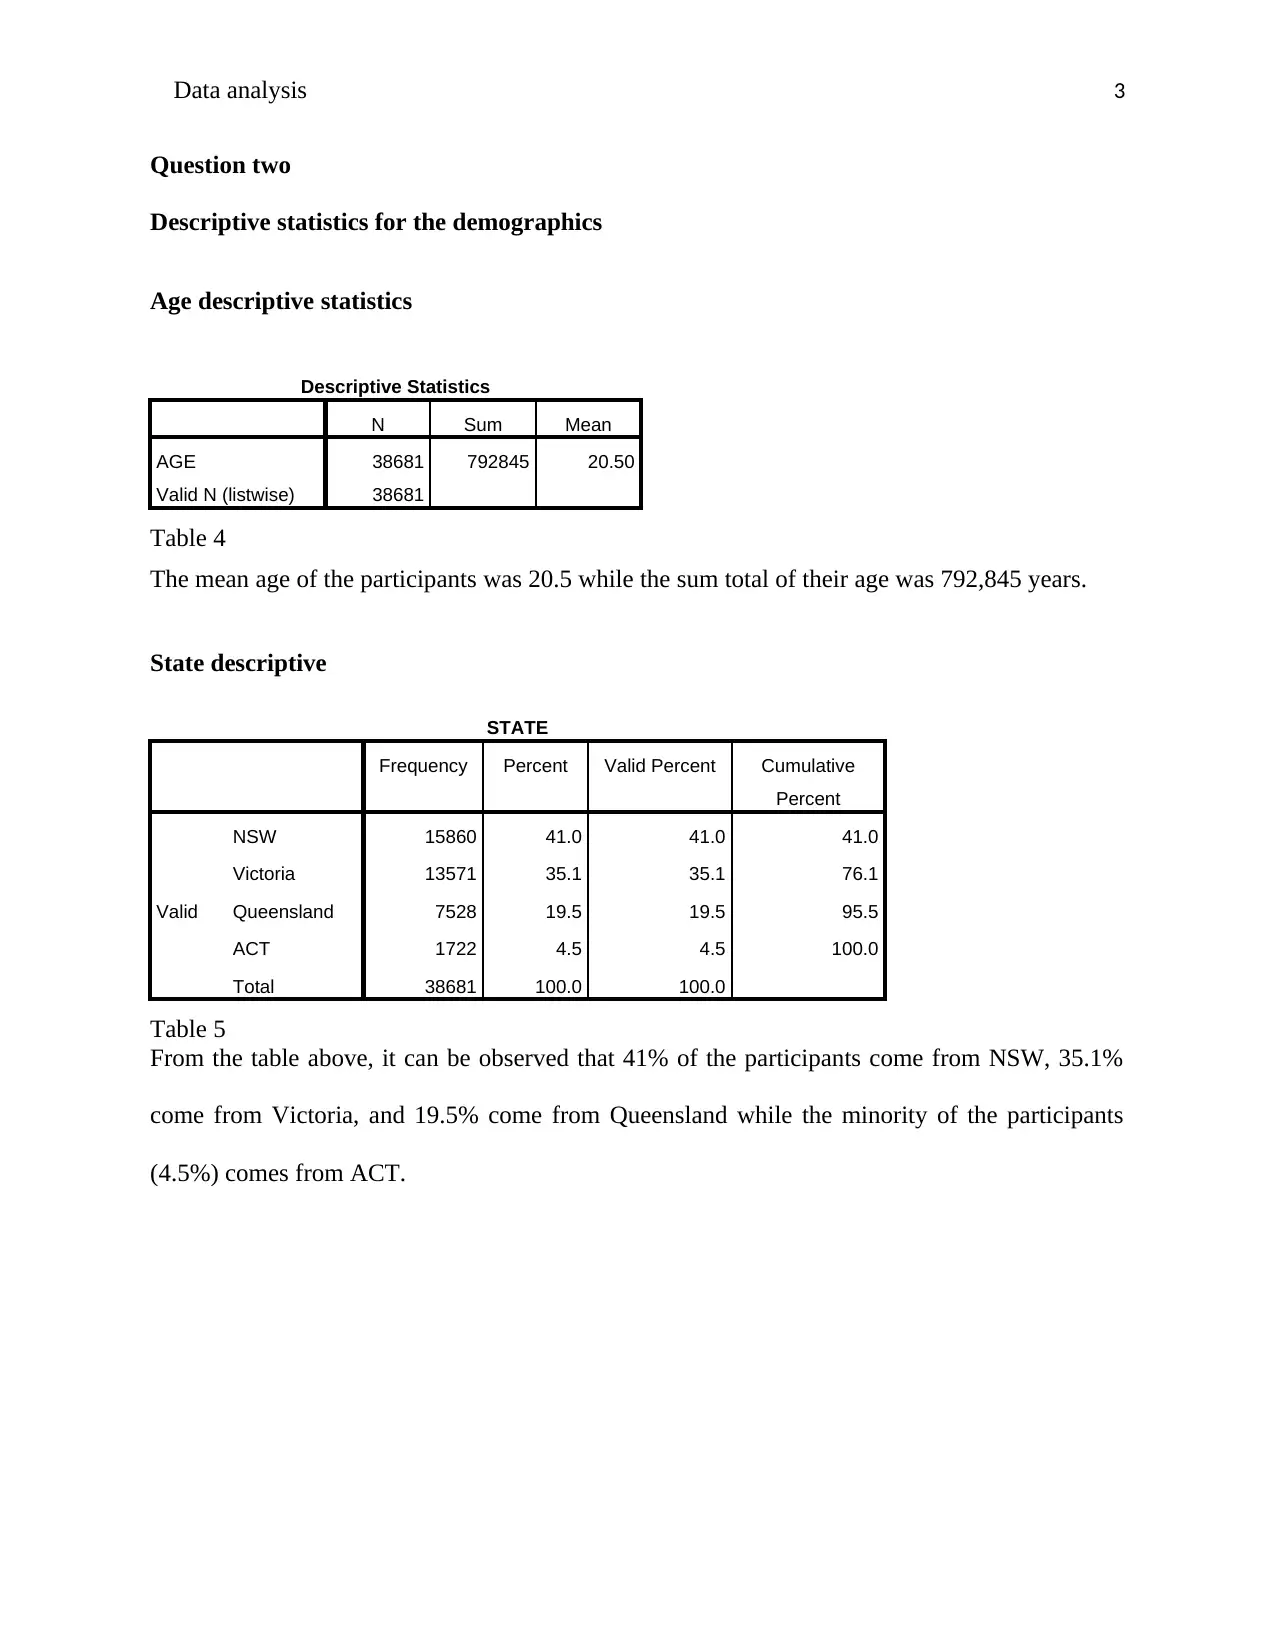
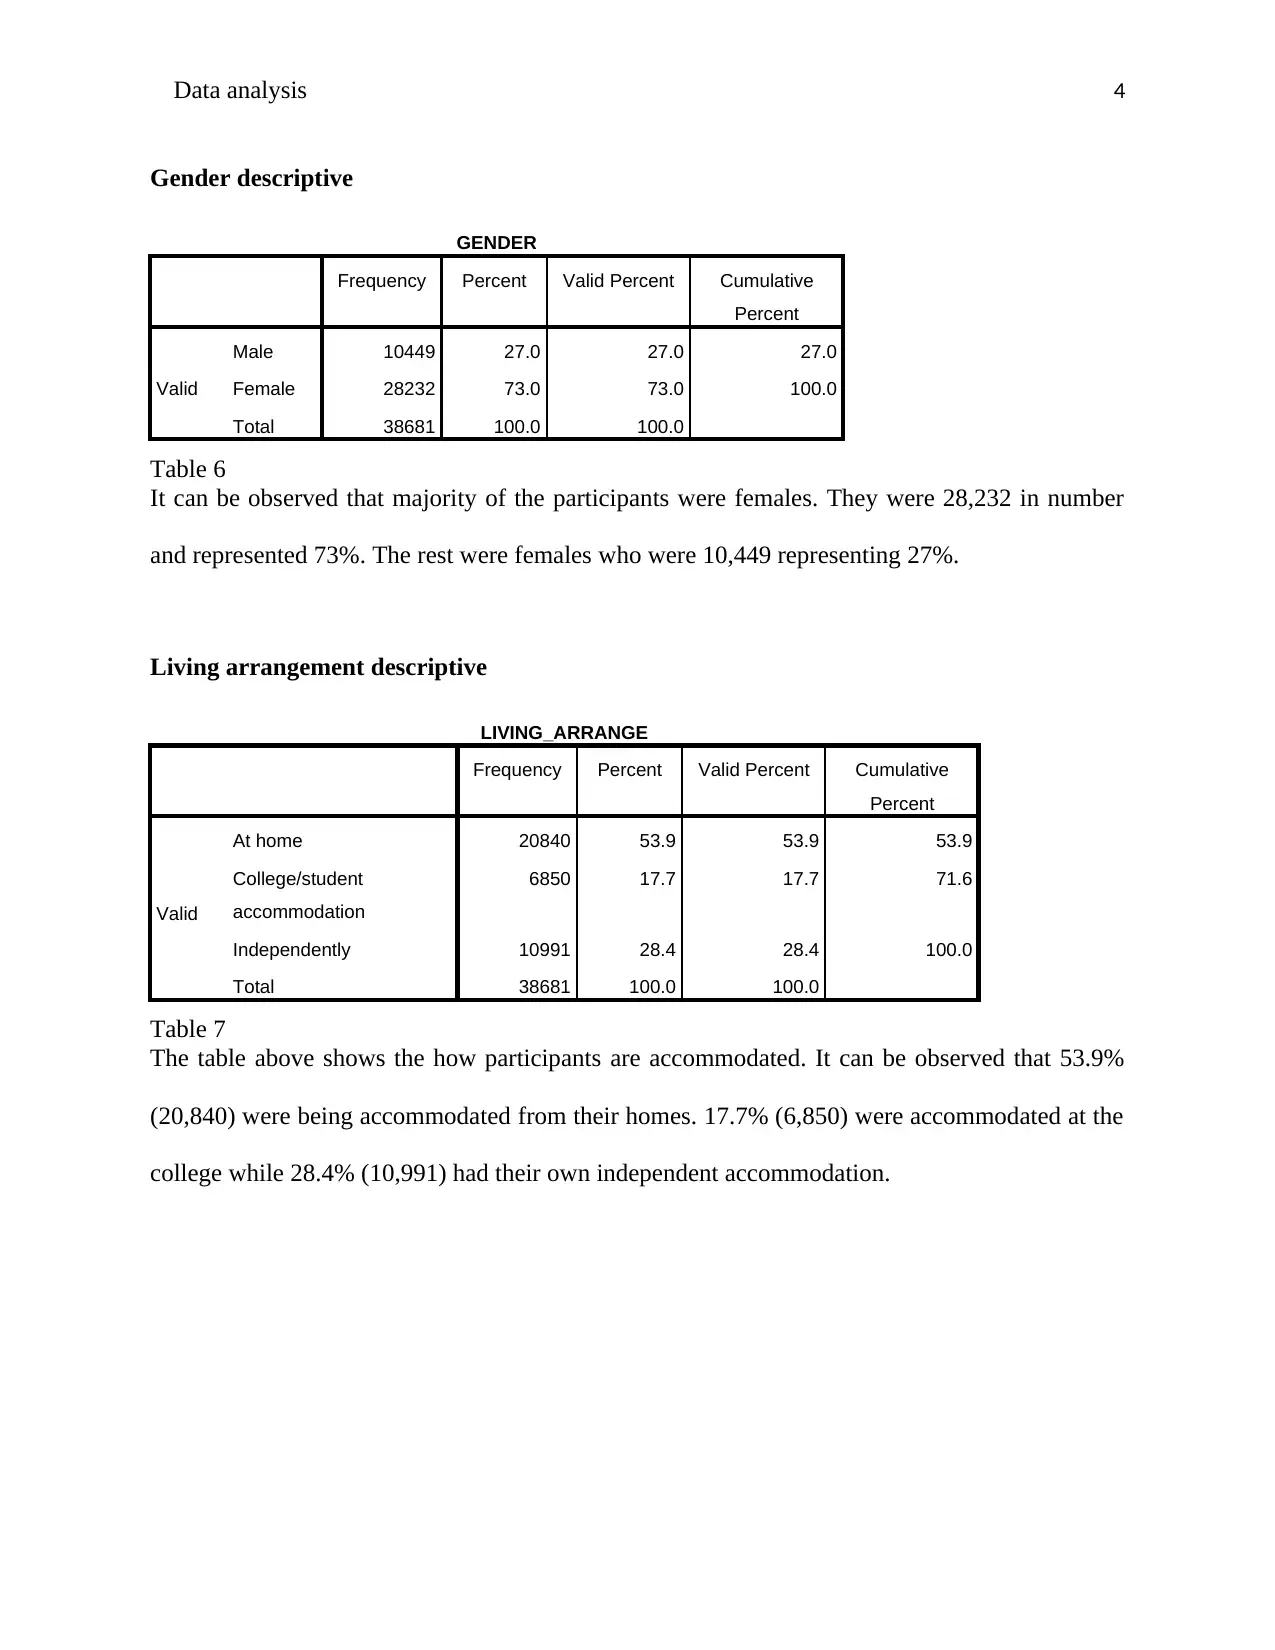
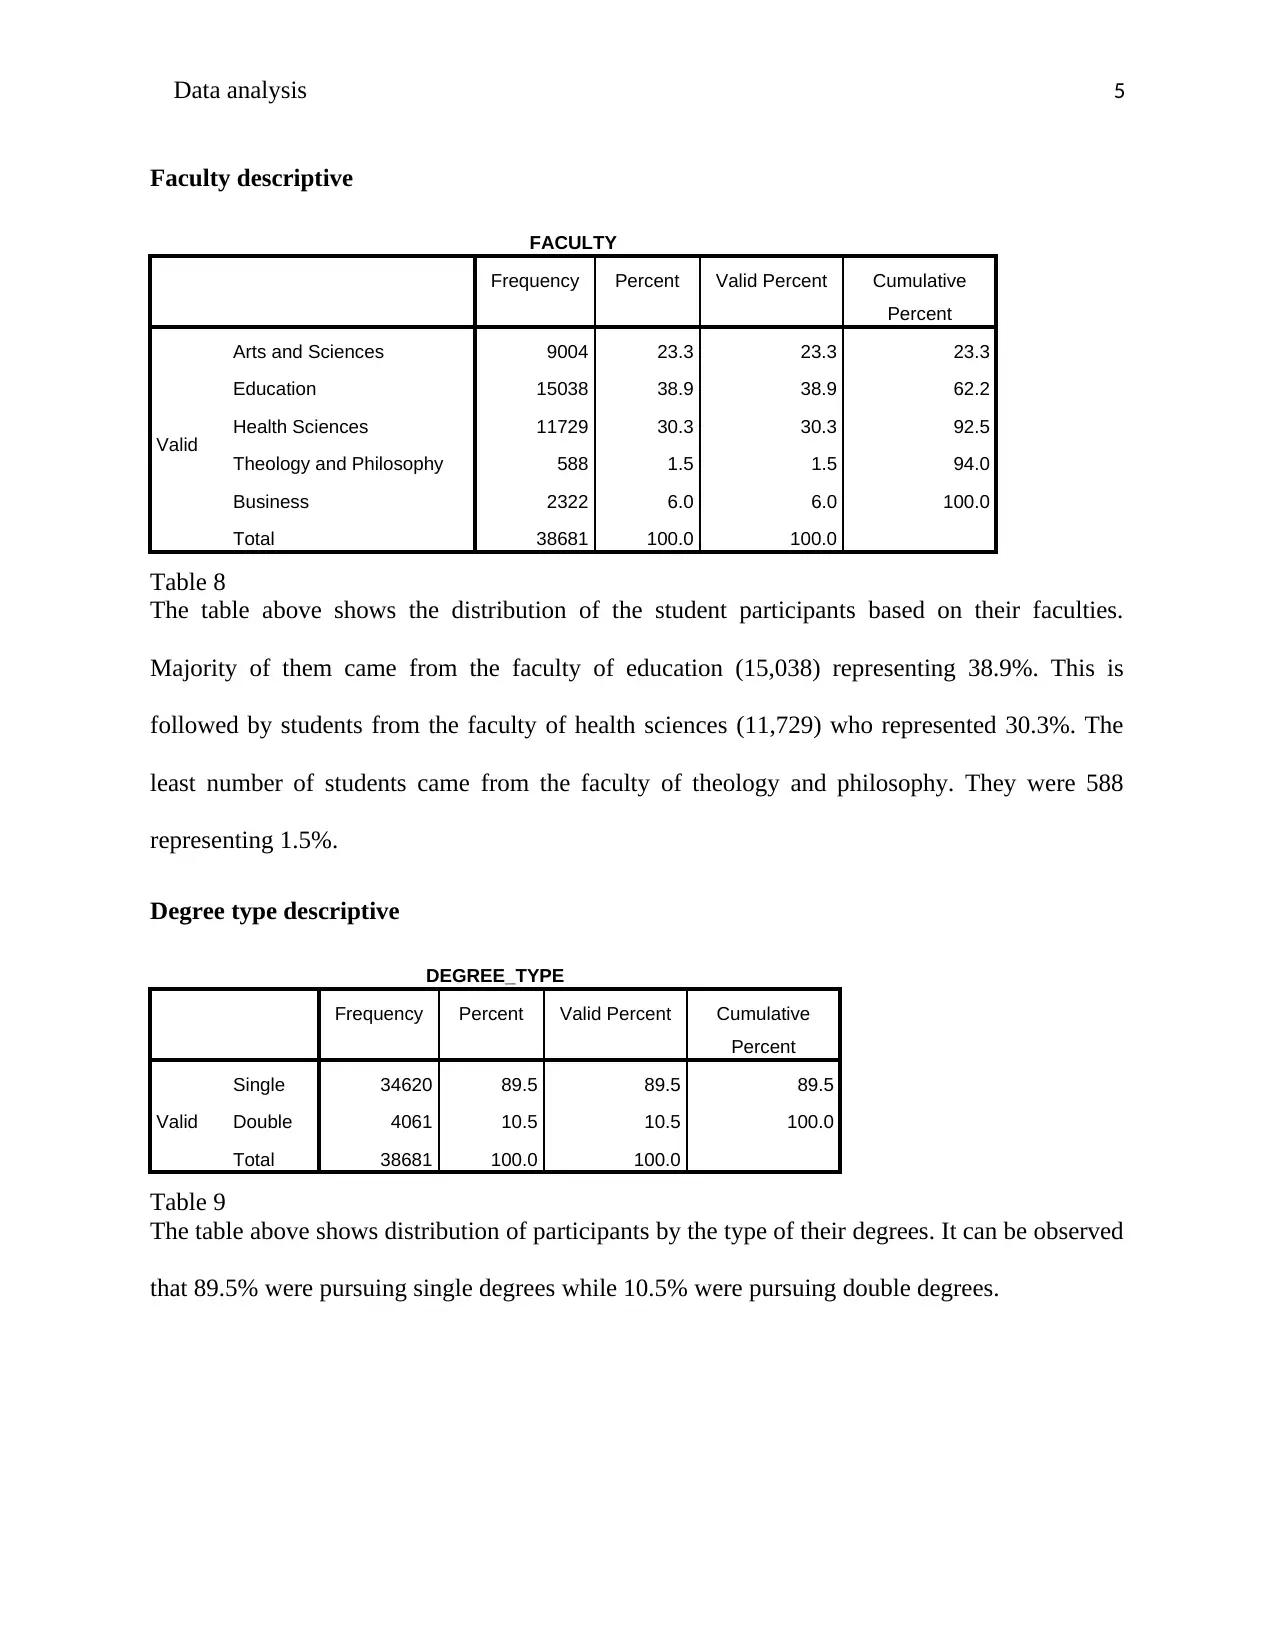
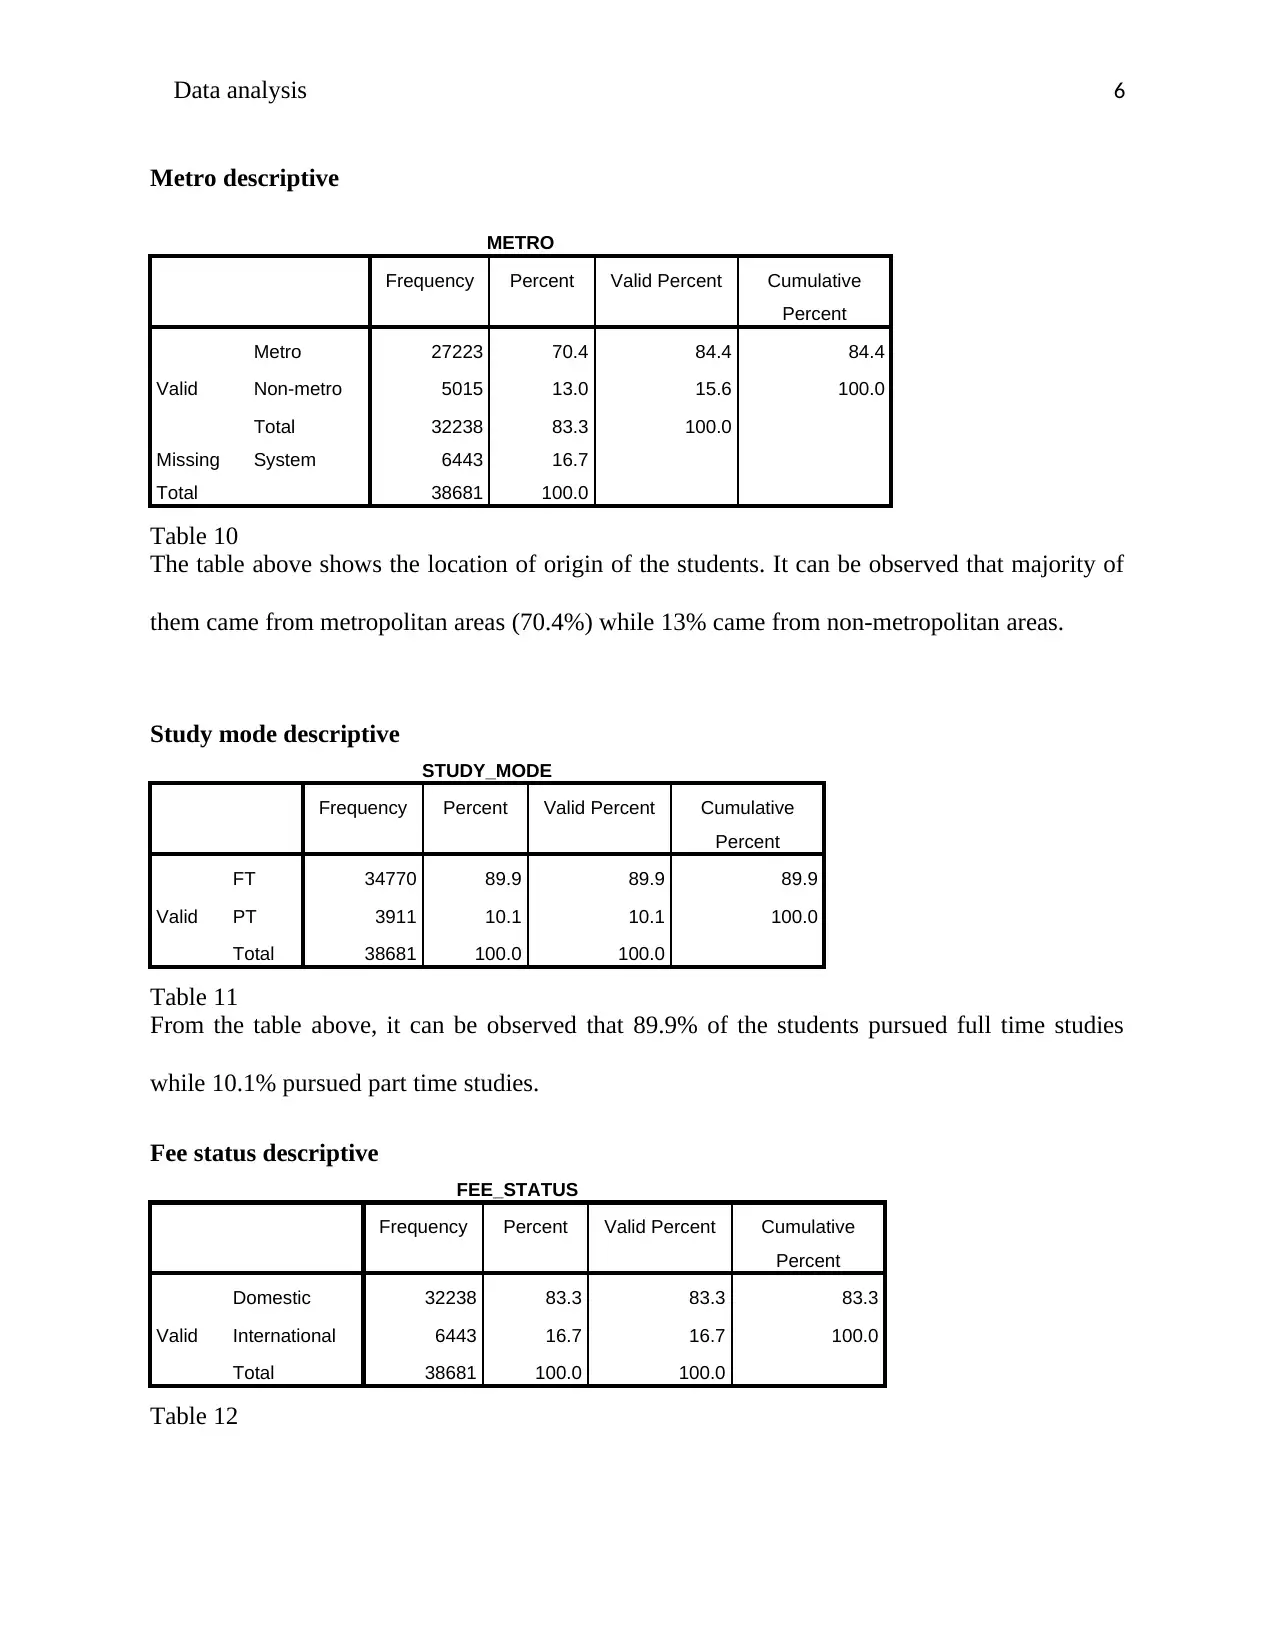
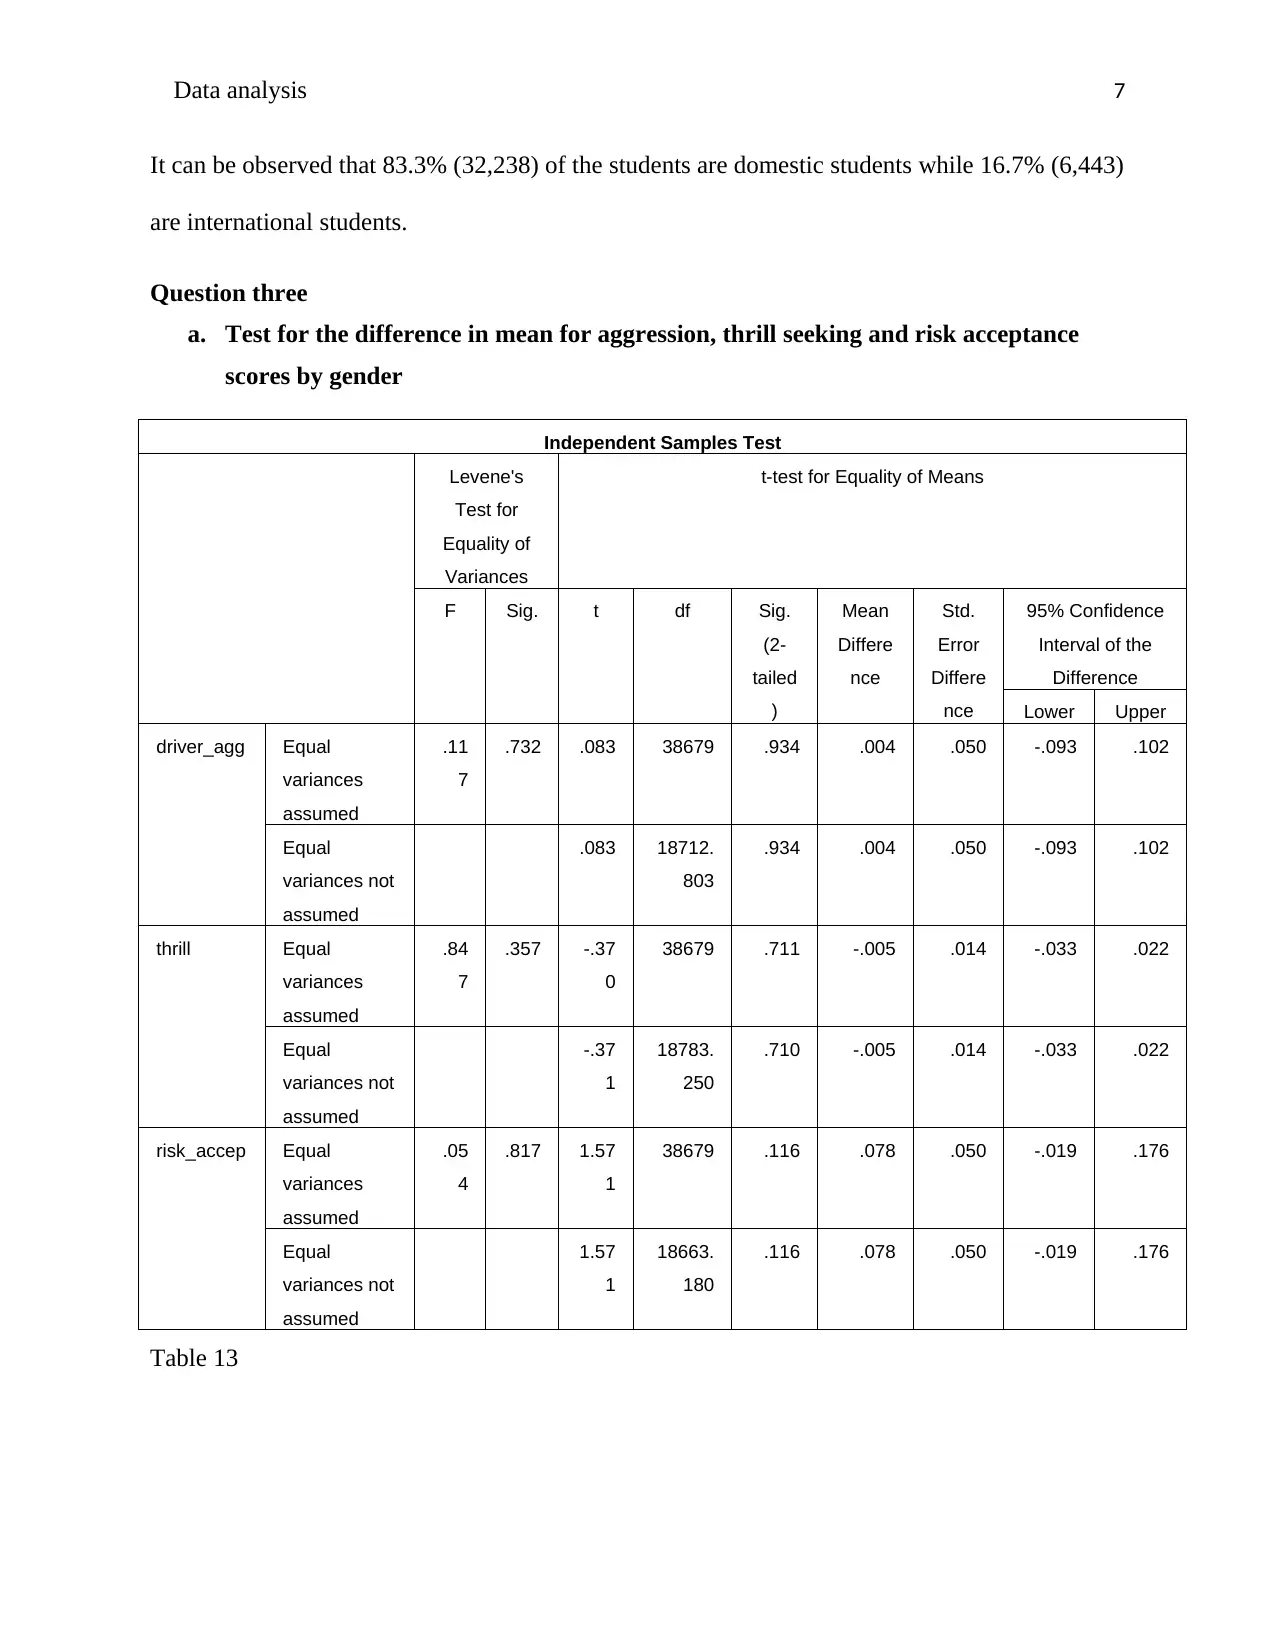
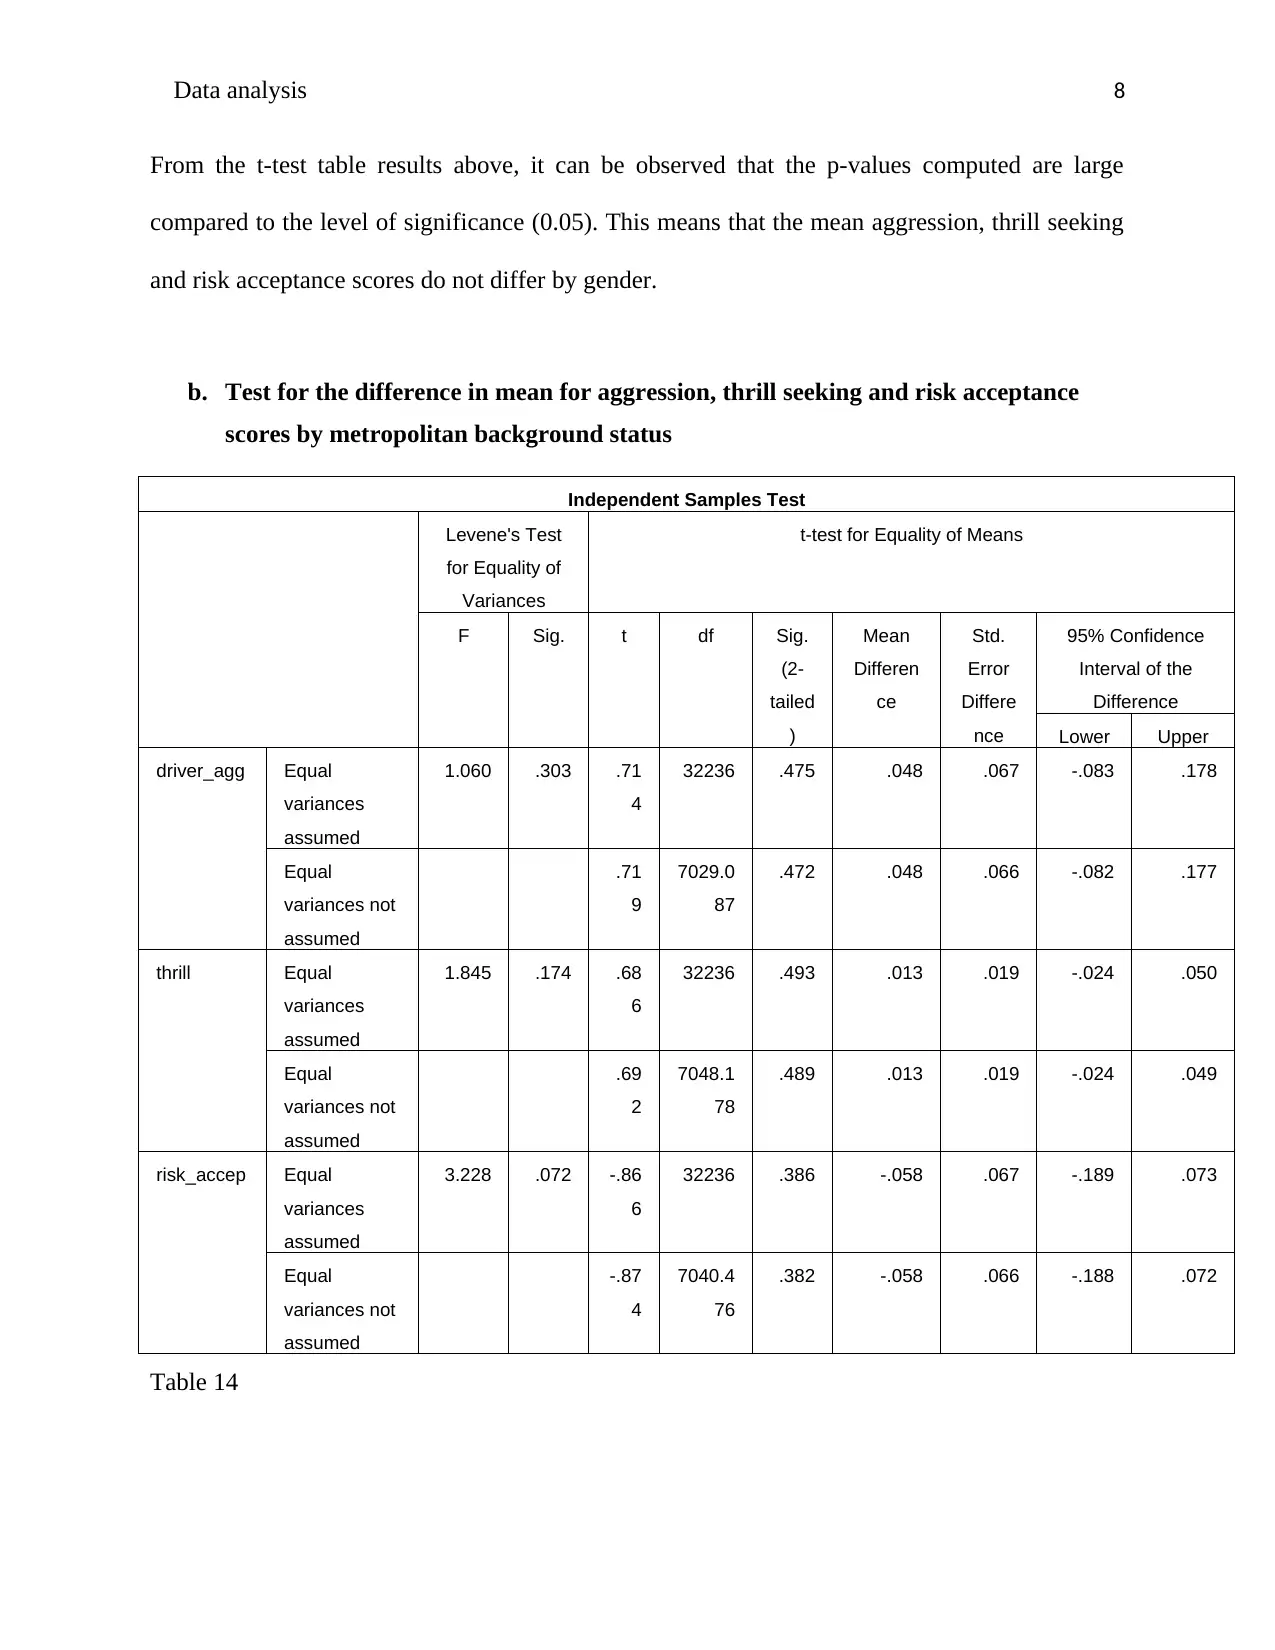
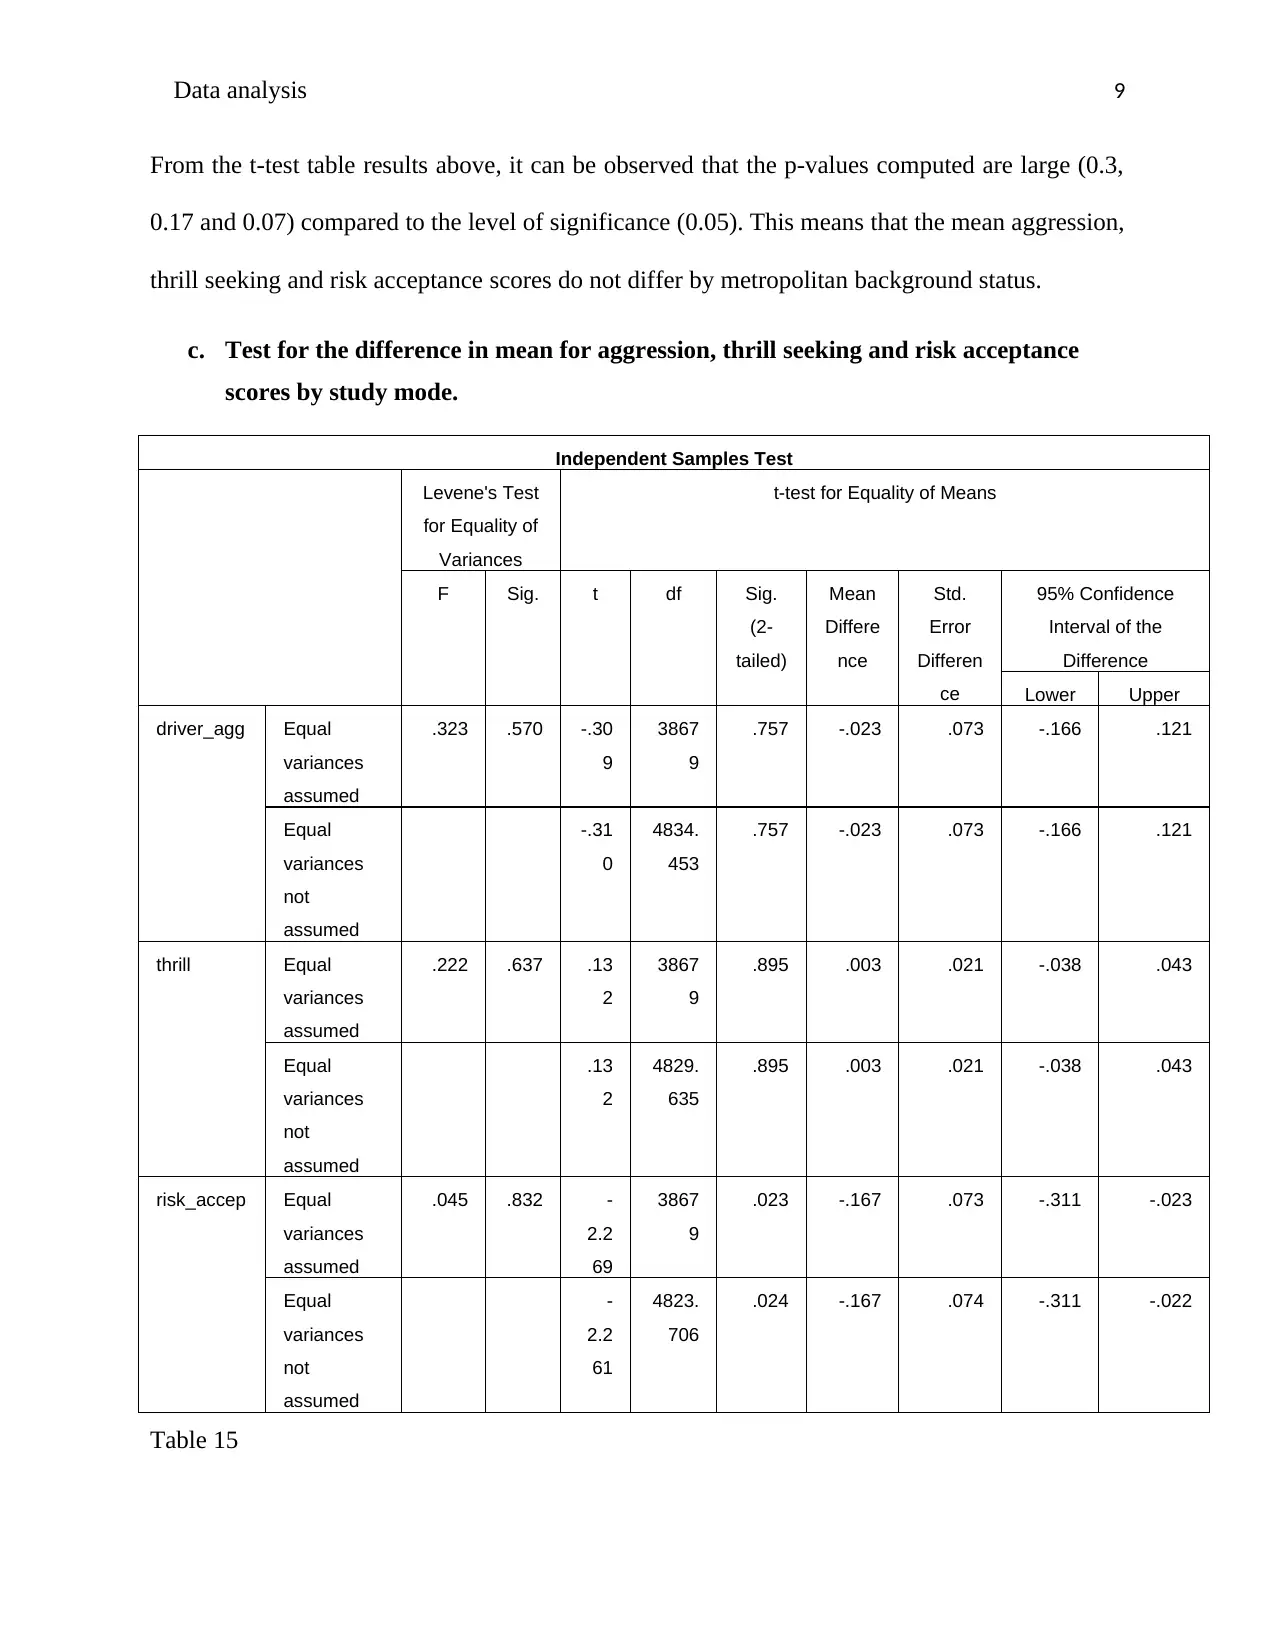
This report presents a detailed data analysis of student data, examining demographic characteristics such as age, state, gender, living arrangements, faculty, degree type, metro status, study mode, and fee status. The analysis includes descriptive statistics and frequency distributions for these variables. Furthermore, the report investigates the relationship between these demographic factors and variables like aggression, thrill-seeking, risk acceptance, and depression using t-tests and ANOVA. Binary logistic regression is employed to explore the influence of demographics and driving distance on RTA (Road Traffic Accidents). The findings reveal significant differences in aggression, thrill-seeking, and risk acceptance scores based on RTA follow-up surveys, while other demographic factors generally do not show significant associations with these variables or depression. The logistic regression results indicate the impact of age category, gender, living arrangement and fee status on RTA.


1 out of 15
Related Documents


Your All-in-One AI-Powered Toolkit for Academic Success.
+13062052269
info@desklib.com
Available 24*7 on WhatsApp / Email
![[object Object]](/_next/static/media/star-bottom.7253800d.svg)
Copyright © 2020–2026 A2Z Services. All Rights Reserved. Developed and managed by ZUCOL.