Relation between average and number of innings played in cricket

Verified

Added on  2022/12/09

|5
|703
|261
AI Summary
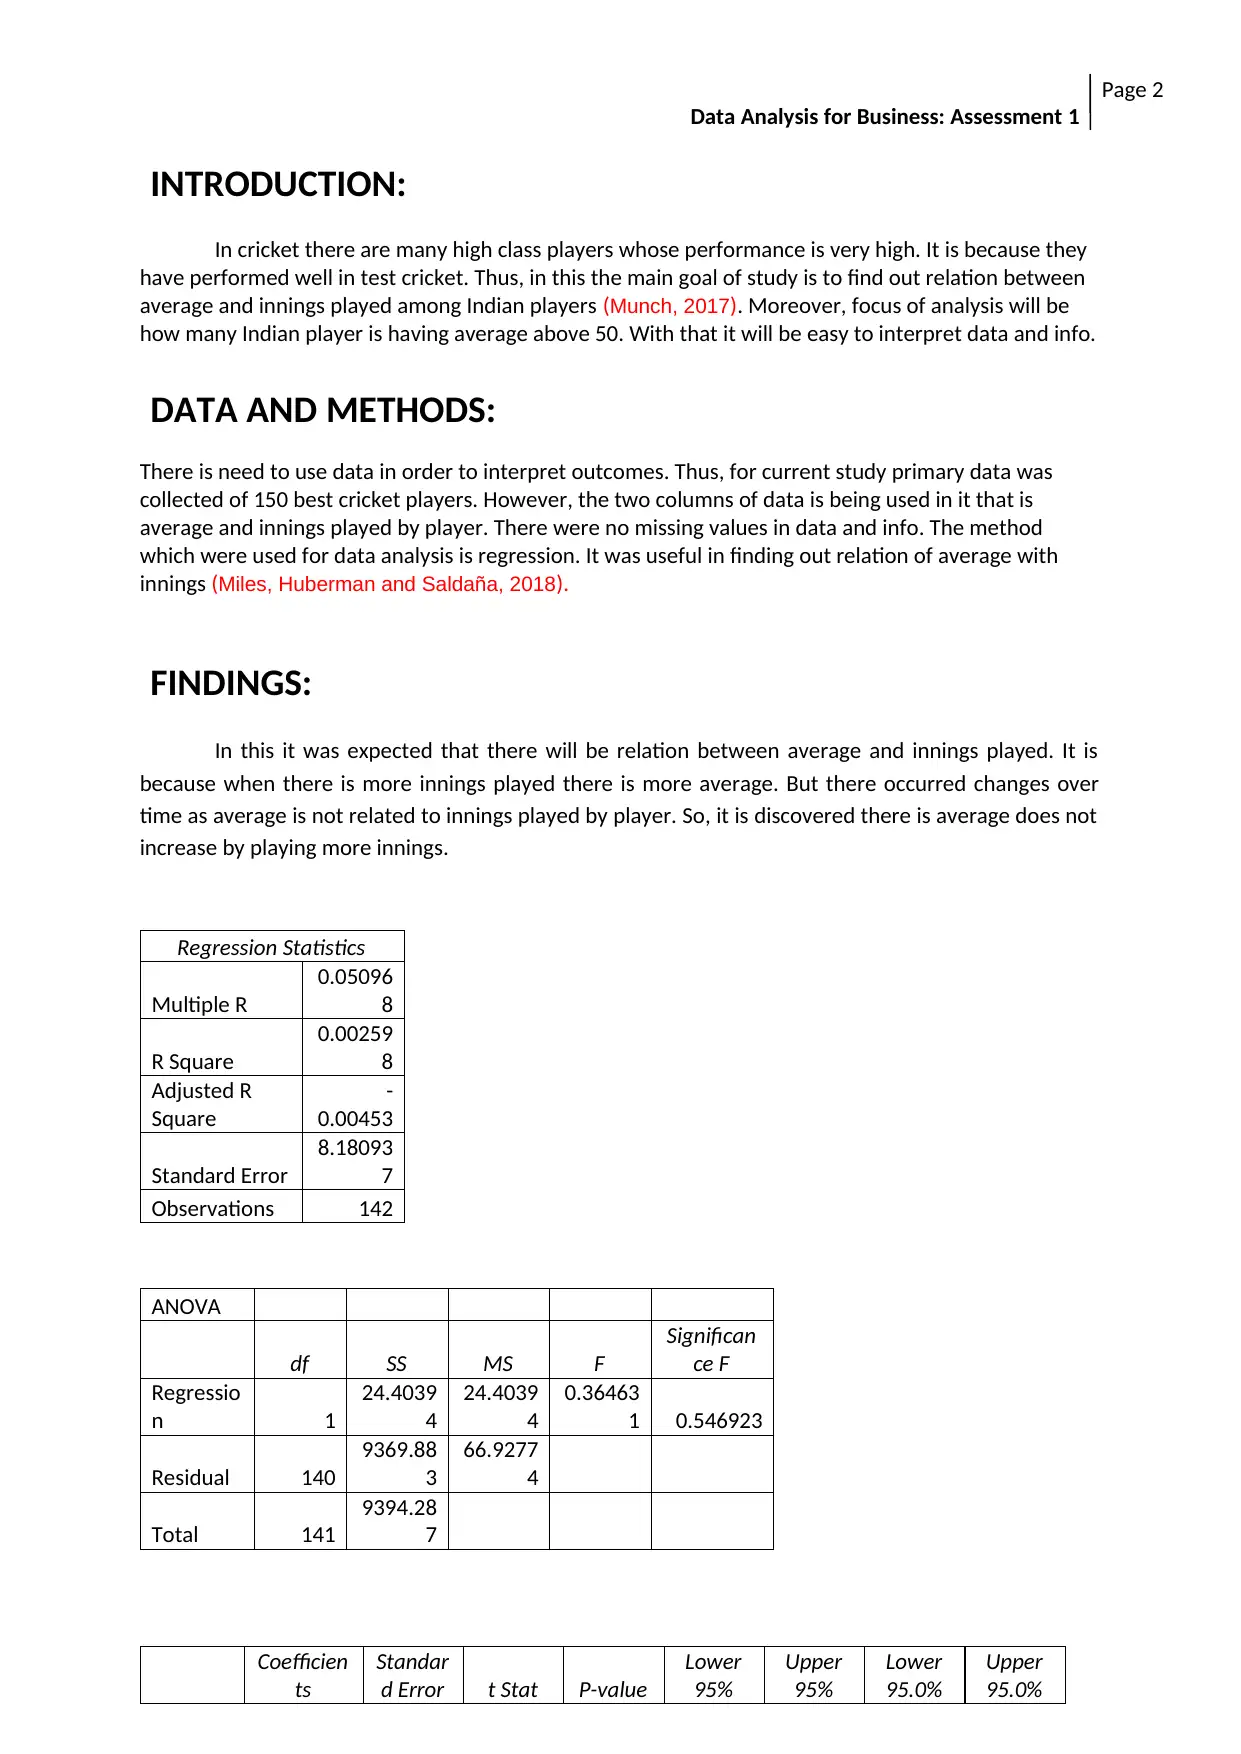
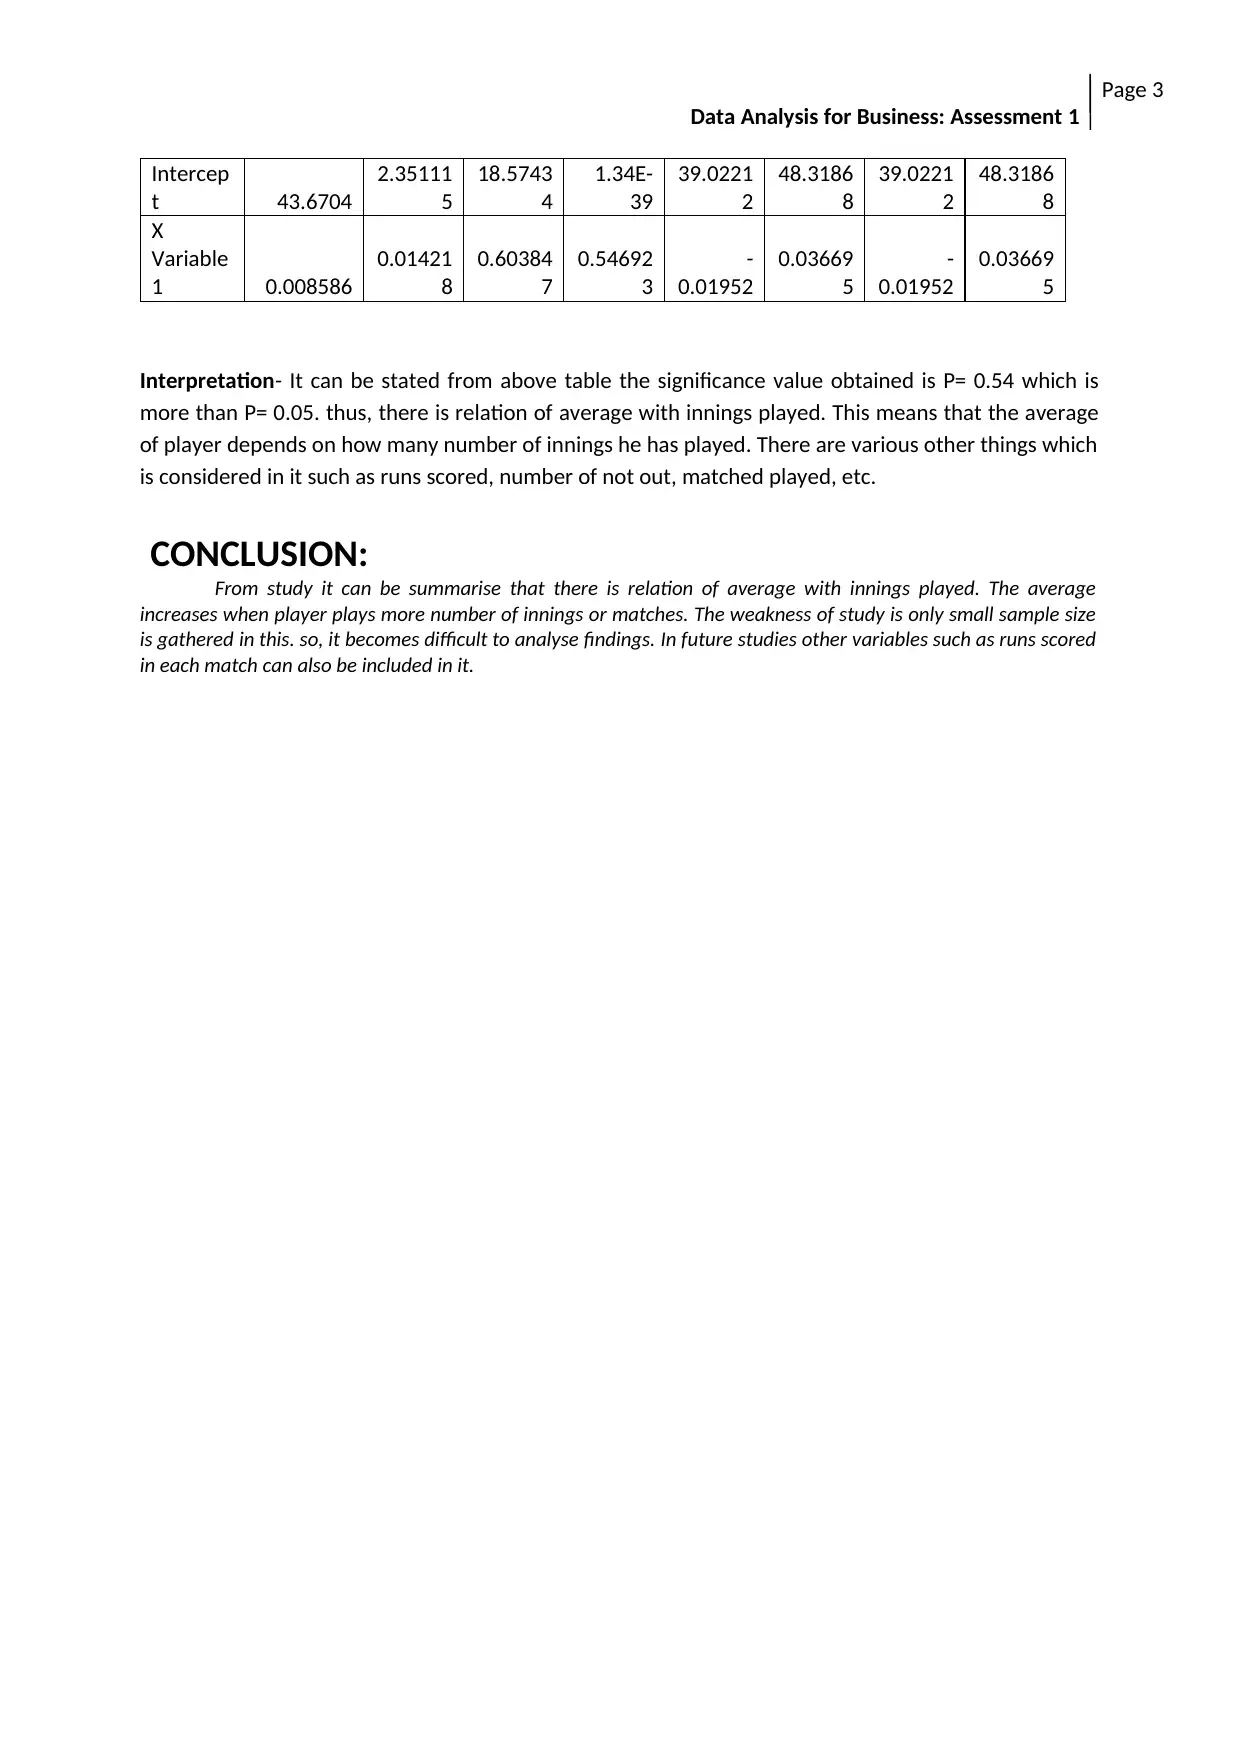
This study examines the relationship between the average and number of innings played by cricket players. Regression analysis is used to analyze the data and determine the significance of the relationship. The findings suggest that there is a relationship between the average and innings played, with the average depending on the number of innings played. However, the study acknowledges the limitation of a small sample size and suggests including other variables in future studies.
tabler-icon-diamond-filled.svg

Contribute Materials

Your contribution can guide someone’s learning journey. Share your documents today.
Document Page
Page 1
Data Analysis for Business: Assessment 1
Name: Click here to enter text.
Student number: Click here to enter text.
Programme: Choose an item.
TITLE:
Is there relation between average and number of innings played?
ABSTRACT:
Approximately 30-50 words summarizing your entire paper.
This study has described about the relation of cricket player average with number of innings
played. In that primary data of top 150 cricket players is selected. moreover, regression analysis is used
to analyse data. It has been interpreted that P value obtained is P= .054 which is more than P= 0.05. so,
there is relation between average and innings played.
tabler-icon-diamond-filled.svg

Secure Best Marks with AI Grader

Need help grading? Try our AI Grader for instant feedback on your assignments.
Document Page
Page 2
Data Analysis for Business: Assessment 1
INTRODUCTION:
In cricket there are many high class players whose performance is very high. It is because they
have performed well in test cricket. Thus, in this the main goal of study is to find out relation between
average and innings played among Indian players (Munch, 2017). Moreover, focus of analysis will be
how many Indian player is having average above 50. With that it will be easy to interpret data and info.
DATA AND METHODS:
There is need to use data in order to interpret outcomes. Thus, for current study primary data was
collected of 150 best cricket players. However, the two columns of data is being used in it that is
average and innings played by player. There were no missing values in data and info. The method
which were used for data analysis is regression. It was useful in finding out relation of average with
innings (Miles, Huberman and Saldaña, 2018).
FINDINGS:
In this it was expected that there will be relation between average and innings played. It is
because when there is more innings played there is more average. But there occurred changes over
time as average is not related to innings played by player. So, it is discovered there is average does not
increase by playing more innings.
Regression Statistics
Multiple R
0.05096
8
R Square
0.00259
8
Adjusted R
Square
-
0.00453
Standard Error
8.18093
7
Observations 142
ANOVA
df SS MS F
Significan
ce F
Regressio
n 1
24.4039
4
24.4039
4
0.36463
1 0.546923
Residual 140
9369.88
3
66.9277
4
Total 141
9394.28
7
Coefficien
ts
Standar
d Error t Stat P-value
Lower
95%
Upper
95%
Lower
95.0%
Upper
95.0%
Document Page
Page 3
Data Analysis for Business: Assessment 1
Intercep
t 43.6704
2.35111
5
18.5743
4
1.34E-
39
39.0221
2
48.3186
8
39.0221
2
48.3186
8
X
Variable
1 0.008586
0.01421
8
0.60384
7
0.54692
3
-
0.01952
0.03669
5
-
0.01952
0.03669
5
Interpretation- It can be stated from above table the significance value obtained is P= 0.54 which is
more than P= 0.05. thus, there is relation of average with innings played. This means that the average
of player depends on how many number of innings he has played. There are various other things which
is considered in it such as runs scored, number of not out, matched played, etc.
CONCLUSION:
From study it can be summarise that there is relation of average with innings played. The average
increases when player plays more number of innings or matches. The weakness of study is only small sample size
is gathered in this. so, it becomes difficult to analyse findings. In future studies other variables such as runs scored
in each match can also be included in it.
Document Page
Page 4
Data Analysis for Business: Assessment 1
REFERENCES:
Munch, E., 2017. A user’s guide to topological data analysis. Journal of Learning Analytics, 4(2),
pp.47-61.
Miles, M.B., Huberman, A.M. and Saldaña, J., 2018. Qualitative data analysis: A methods sourcebook.
Sage publications.
tabler-icon-diamond-filled.svg

Secure Best Marks with AI Grader

Need help grading? Try our AI Grader for instant feedback on your assignments.
Document Page
Page 5
Data Analysis for Business: Assessment 1
chevron_up_icon
1 out of 5
circle_padding
hide_on_mobile
zoom_out_icon
[object Object]

Your All-in-One AI-Powered Toolkit for Academic Success.

Available 24*7 on WhatsApp / Email

[object Object]