Data Analysis and Forecasting

Verified

Added on  2023/06/10

|11
|1062
|297
AI Summary
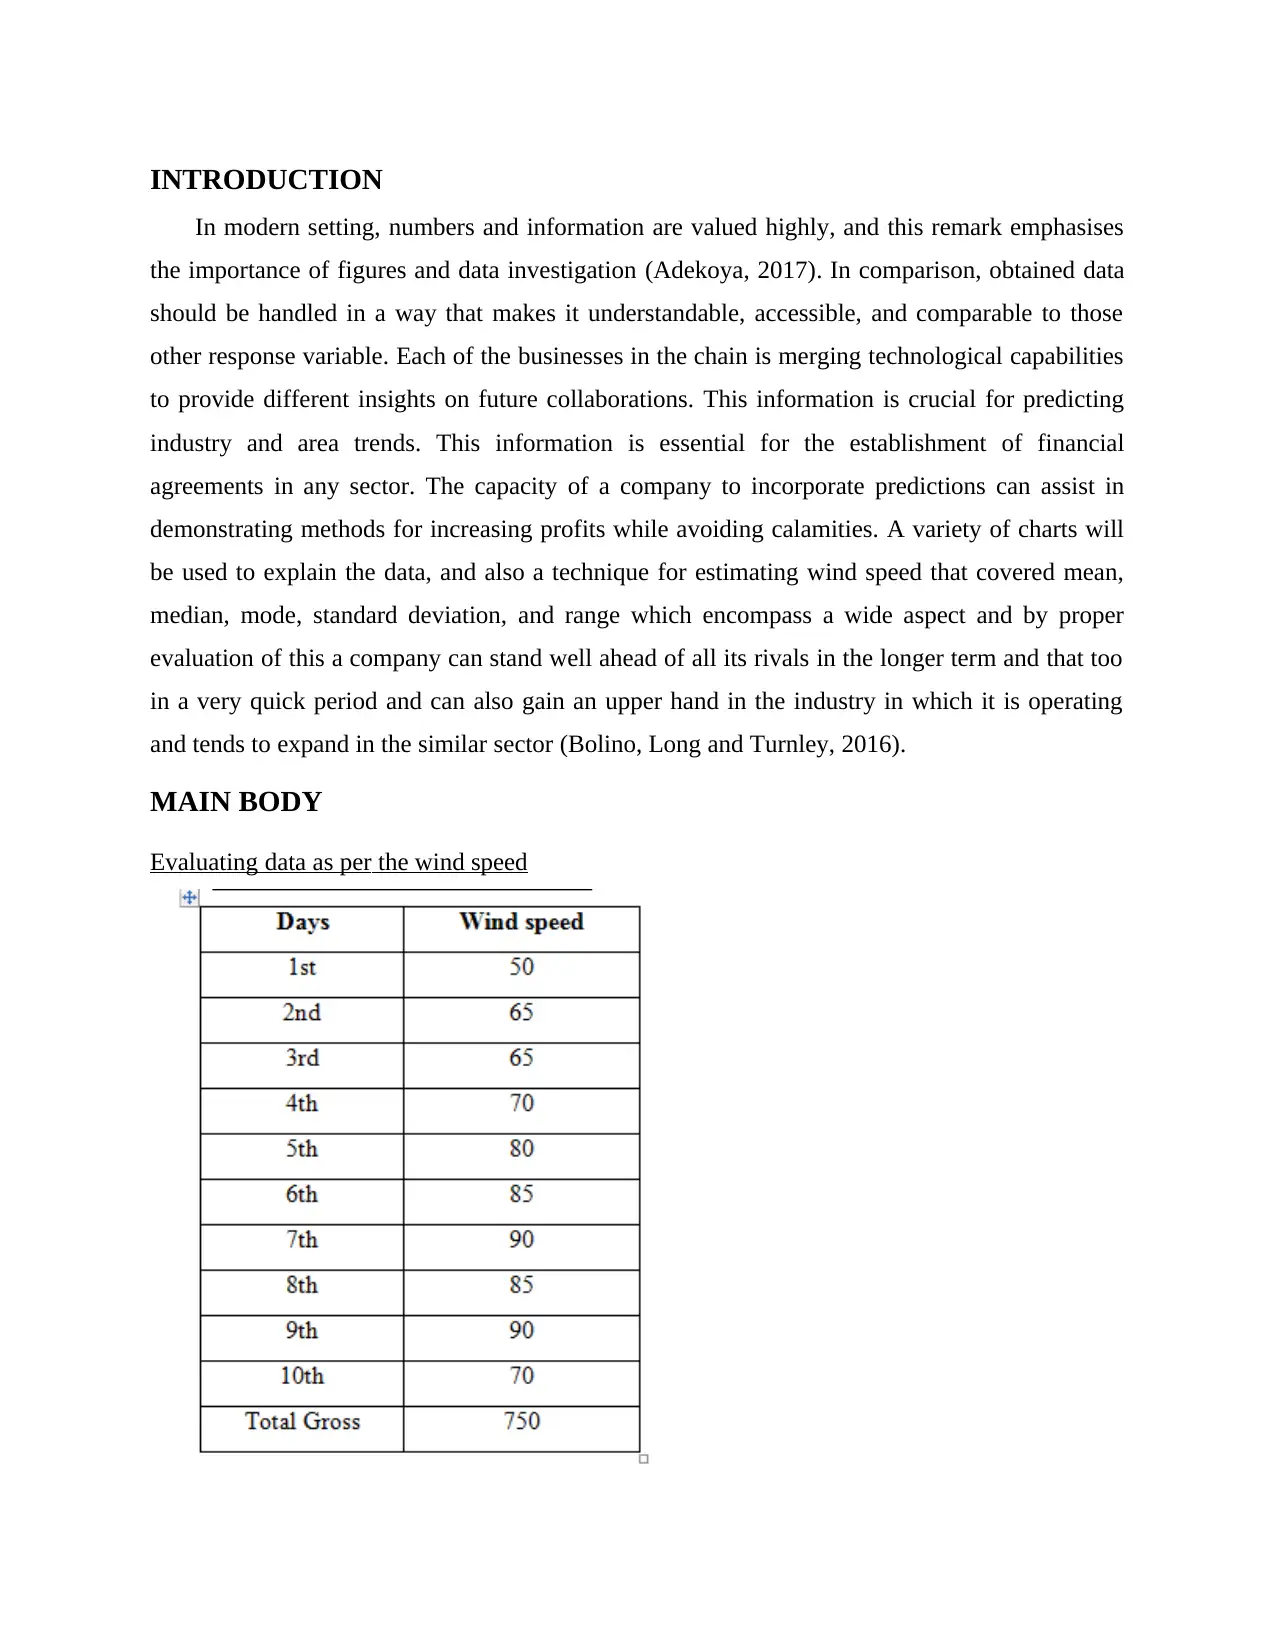
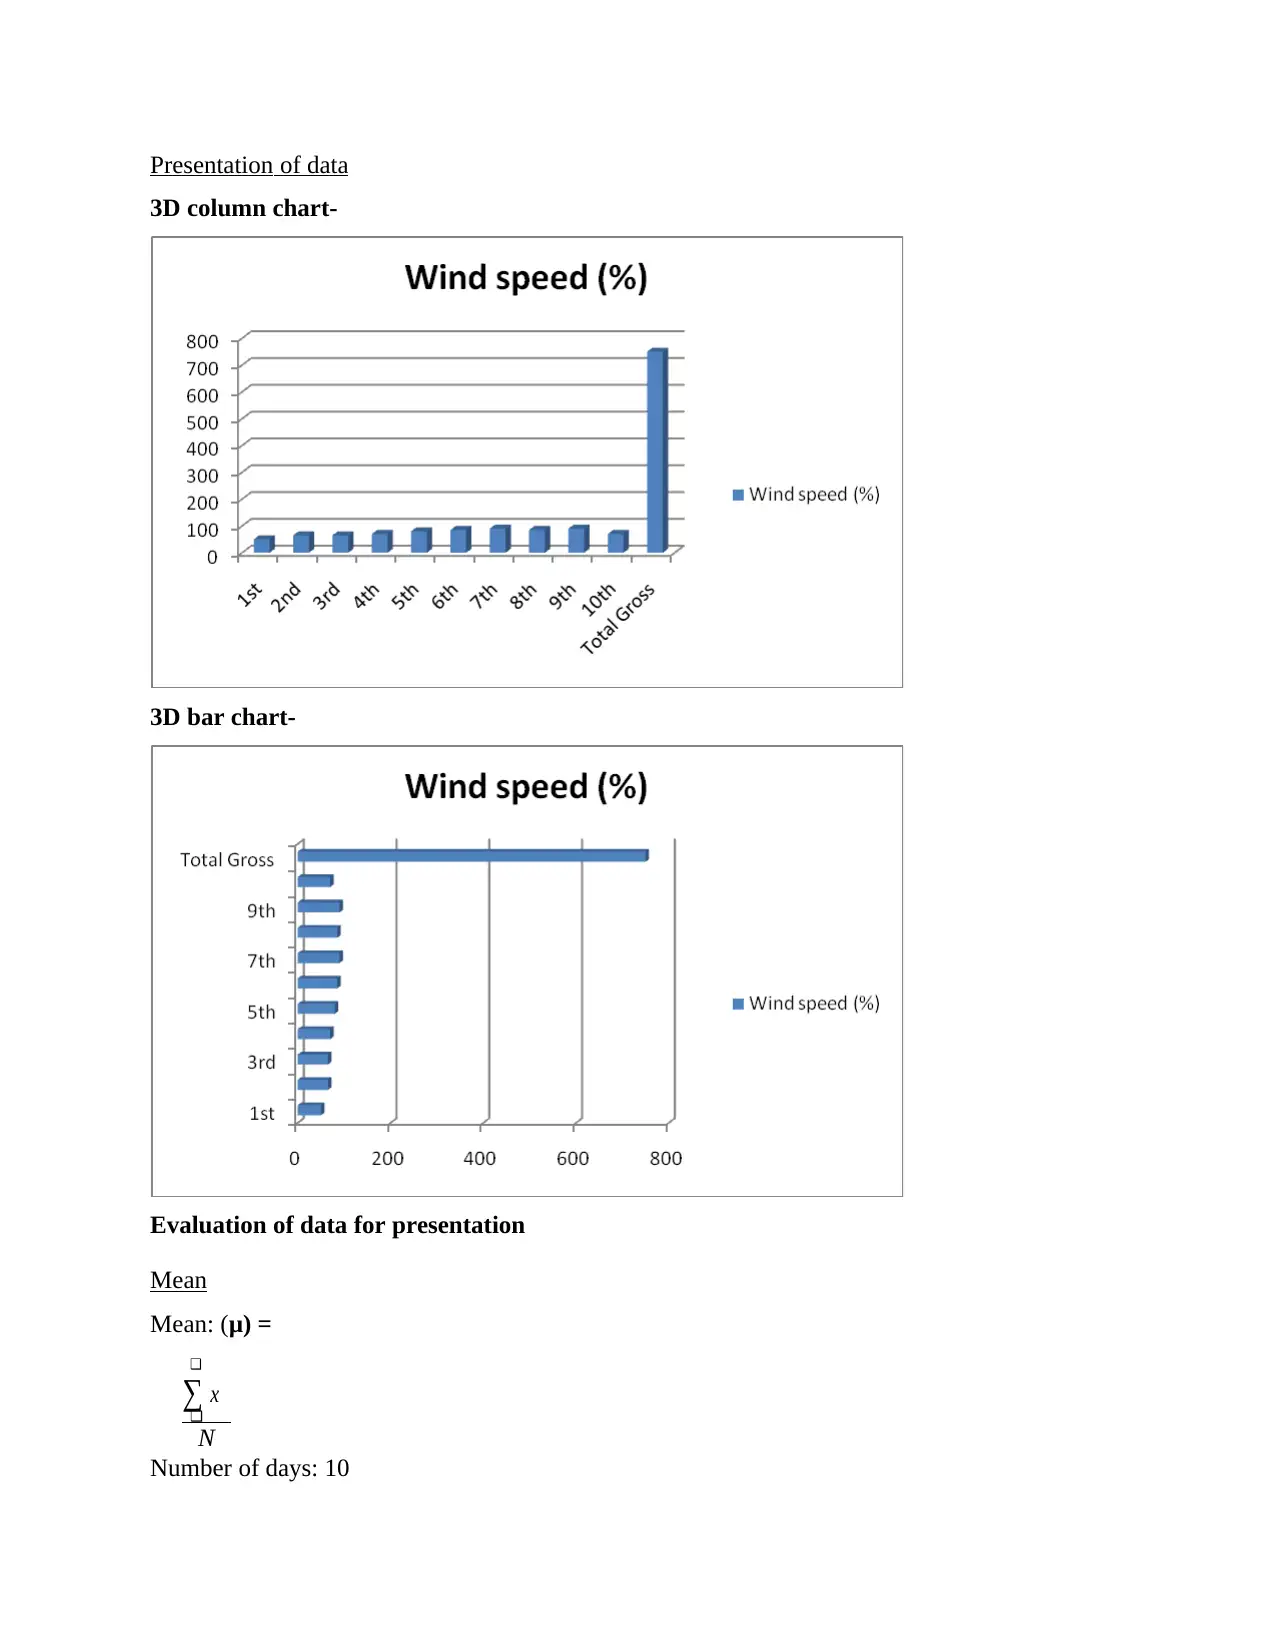
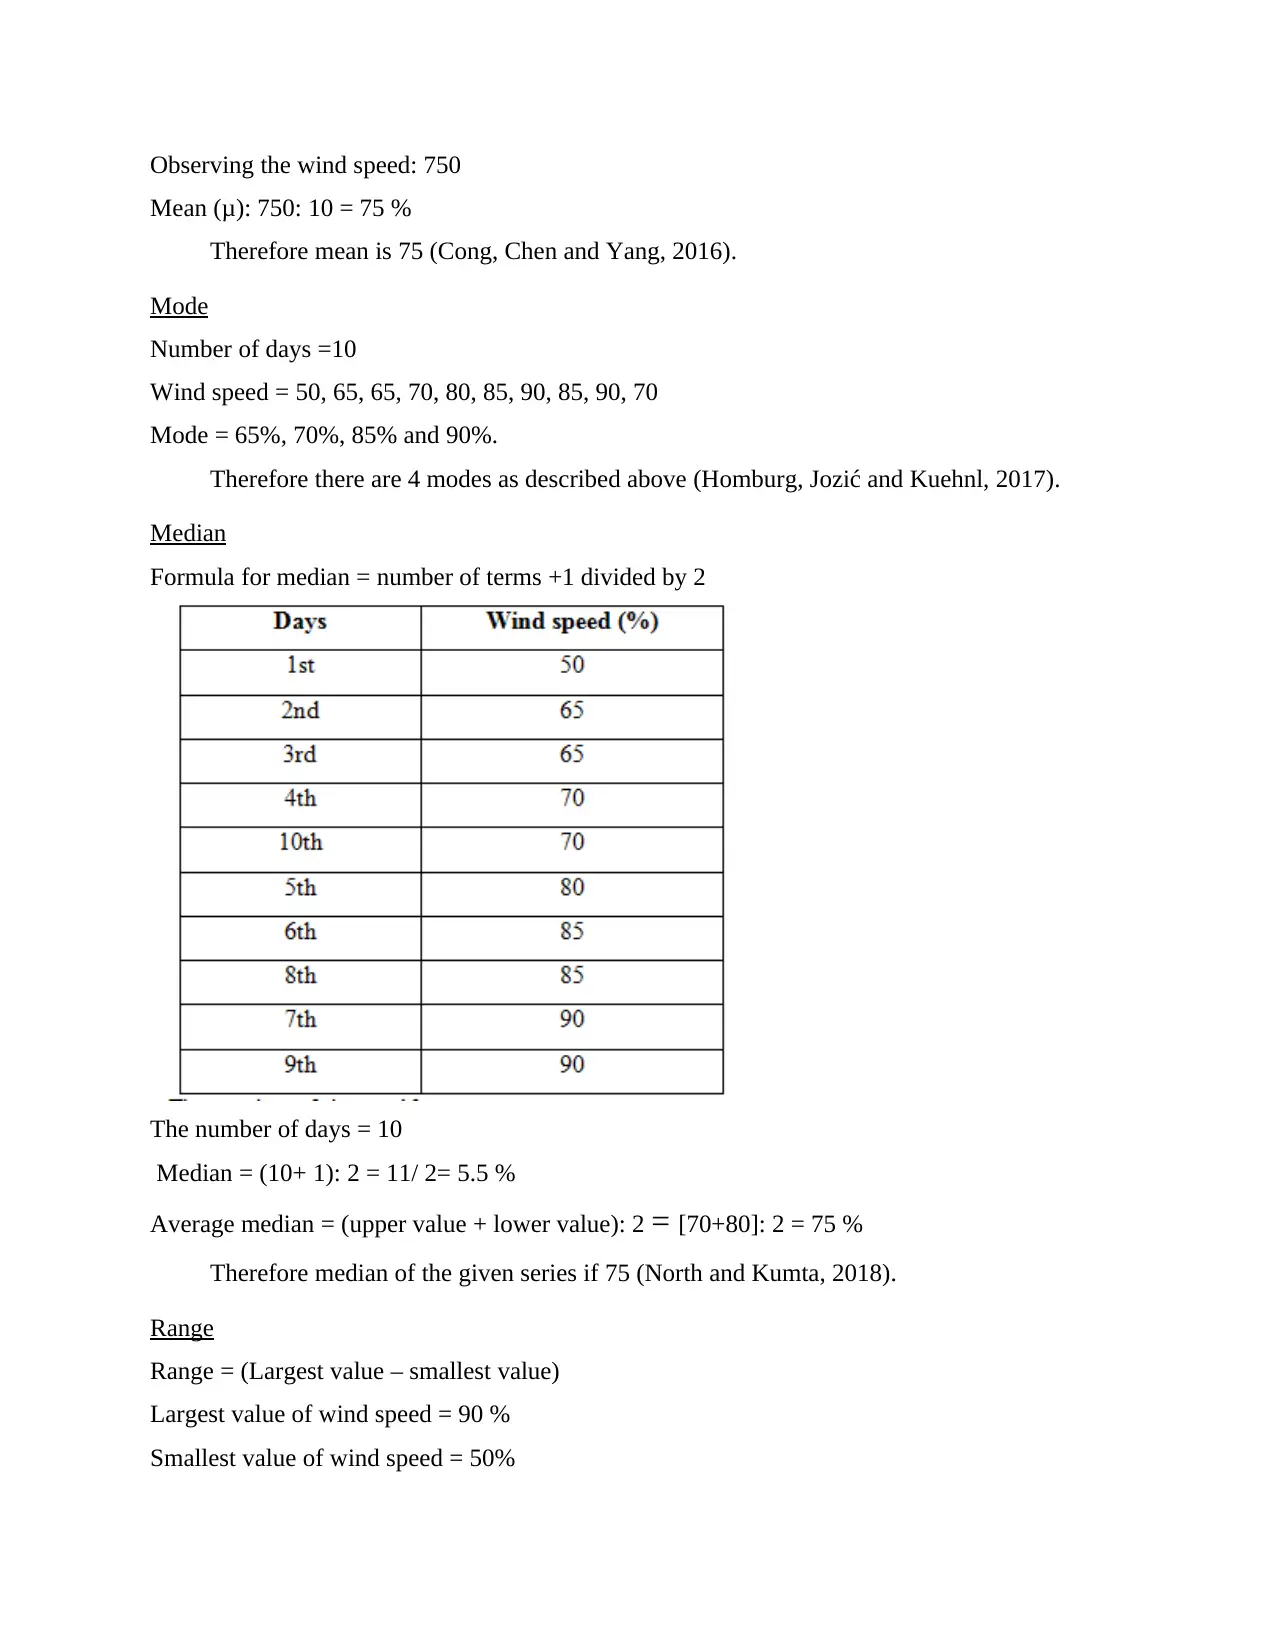
This article discusses the importance of data analysis and forecasting in predicting industry and area trends. It covers evaluating data as per wind speed, presentation of data, mean, mode, median, range, standard deviation, and linear forecasting. The techniques discussed can help both enterprises and non-profit groups by helping them to predict earnings, compute and gather essential data, and operate more effectively and affordably.
tabler-icon-diamond-filled.svg

Contribute Materials

Your contribution can guide someone’s learning journey. Share your documents today.
Document Page
Data Analysis and
Forecasting
tabler-icon-diamond-filled.svg

Secure Best Marks with AI Grader

Need help grading? Try our AI Grader for instant feedback on your assignments.
Document Page
Contents
Contents...........................................................................................................................................2
INTRODUCTION...........................................................................................................................1
MAIN BODY..................................................................................................................................1
Evaluating data as per the wind speed.........................................................................................1
Presentation of data......................................................................................................................2
Mean............................................................................................................................................2
Mode............................................................................................................................................3
Median.........................................................................................................................................3
Range...........................................................................................................................................3
Standard Deviation......................................................................................................................4
Linear Forecasting.......................................................................................................................5
CONCLUSION................................................................................................................................7
REFERENCES................................................................................................................................8
Document Page
Document Page
INTRODUCTION
In modern setting, numbers and information are valued highly, and this remark emphasises
the importance of figures and data investigation (Adekoya, 2017). In comparison, obtained data
should be handled in a way that makes it understandable, accessible, and comparable to those
other response variable. Each of the businesses in the chain is merging technological capabilities
to provide different insights on future collaborations. This information is crucial for predicting
industry and area trends. This information is essential for the establishment of financial
agreements in any sector. The capacity of a company to incorporate predictions can assist in
demonstrating methods for increasing profits while avoiding calamities. A variety of charts will
be used to explain the data, and also a technique for estimating wind speed that covered mean,
median, mode, standard deviation, and range which encompass a wide aspect and by proper
evaluation of this a company can stand well ahead of all its rivals in the longer term and that too
in a very quick period and can also gain an upper hand in the industry in which it is operating
and tends to expand in the similar sector (Bolino, Long and Turnley, 2016).
MAIN BODY
Evaluating data as per the wind speed
tabler-icon-diamond-filled.svg

Secure Best Marks with AI Grader

Need help grading? Try our AI Grader for instant feedback on your assignments.
Document Page
Presentation of data
3D column chart-
3D bar chart-
Evaluation of data for presentation
Mean
Mean: (μ) =

x

N
Number of days: 10
Document Page
Observing the wind speed: 750
Mean (μ): 750: 10 = 75 %
Therefore mean is 75 (Cong, Chen and Yang, 2016).
Mode
Number of days =10
Wind speed = 50, 65, 65, 70, 80, 85, 90, 85, 90, 70
Mode = 65%, 70%, 85% and 90%.
Therefore there are 4 modes as described above (Homburg, Jozić and Kuehnl, 2017).
Median
Formula for median = number of terms +1 divided by 2
The number of days = 10
Median = (10+ 1): 2 = 11/ 2= 5.5 %
Average median = (upper value + lower value): 2 = [70+80]: 2 = 75 %
Therefore median of the given series if 75 (North and Kumta, 2018).
Range
Range = (Largest value smallest value)
Largest value of wind speed = 90 %
Smallest value of wind speed = 50%
Document Page
Range = [90 50] = 40%
Therefore range of the series is 40 (Vlotman, Smedema and Rycroft, 2020).
Standard Deviation
Standard deviation (σ) =
x

(¿−μ)
2

N
¿
Key Findings
Days Wind speed (%) Mean (μ) (x-μ) (x-μ)^2
1st 50 75 (50-75)=-25 625
2nd 65 75 (65-75)=-10 100
3rd 65 75 (65-75)-10 100
4th 70 75 (70-75)=-5 25
10th 70 75 (70-75)=-5 25
5th 80 75 (80-75)=5 25
6th 85 75 (85-75)=10 100
8th 85 75 (85-75)=10 100
7th 90 75 (90-75)=15 225
9th 90 75 (90-75)=15 225
Total Gross 750 0 1550
= √ [1550:10]
= 12.44 %
tabler-icon-diamond-filled.svg

Paraphrase This Document

Need a fresh take? Get an instant paraphrase of this document with our AI Paraphraser
Document Page
Linear Forecasting
Linear forecasting = (y = mx + c)
Value for m
Number of days= 10
m =
x ¿ 2
N x2−¿ N xy∑x y
¿
Document Page
m = (10 x 4355 -55 x 750): (10 x 385 -55 x 55)
= 2300: 825
= 2.78
Linear forecasting is 2.78
Inculcating the value of c
The number of days = 10
c =
y − m∑ x
N
c = [750 – 2.78x 55]: 10 = 747.22: 10 = 74.72.
Value of c is computed and it stands at 74.72.
Forecasting wind speed of 11th and 13th days
Values of m and c as per the linear forecasting
Linear forecasting formula = (y = 2.78 x + 74.72)
On the 11th day, the value of x is 11
Forecasting of wind speed of 11th day=
y = 2.78 x 11+ 74.72
y = 105.3 %
Document Page
13th day, the value of x is 13
Forecasting of wind speed of 13th day=
y = 2.78 x 13+ 74.72
y = 110.86 %
CONCLUSION
This work illustrates how to calculate the mean, median, and mode, as well as anticipates
data, using progressively positive methodologies. In towns, wind speed is frequently used to
achieve such aspect which also possesses a lot of value in the market. These techniques can help
both enterprises and non-profit groups by helping them to predict earnings, compute and gather
essential data, and etc, enabling both to operate more effectively and affordably. Once it comes
to attaining corporate objectives in modern environment, insight is a valuable method for
examining and responding on historical, current, and future data. Researchers' days are jam-
packed of tasks including data processing. It's of no advantage if consumers have to browse
through numerous pages each day to get the information they want. However, in recent times, the
volumes of stuff accessible have significantly increased. It's excellent for researchers to have
more data that should presumably contribute to better examinations, but it's also a problem
because it could contribute to major employee fatigue on time, therefore it's critical to strike the
right mix among career and private activities for researchers.
tabler-icon-diamond-filled.svg

Secure Best Marks with AI Grader

Need help grading? Try our AI Grader for instant feedback on your assignments.
Document Page
REFERENCES
Books and journals
chevron_up_icon
1 out of 11
circle_padding
hide_on_mobile
zoom_out_icon
[object Object]

Your All-in-One AI-Powered Toolkit for Academic Success.

Available 24*7 on WhatsApp / Email

[object Object]