Humidity Data Analysis of Belfast: Forecasting and Statistics
VerifiedAdded on 2023/06/04
|11
|1407
|340
Report
AI Summary
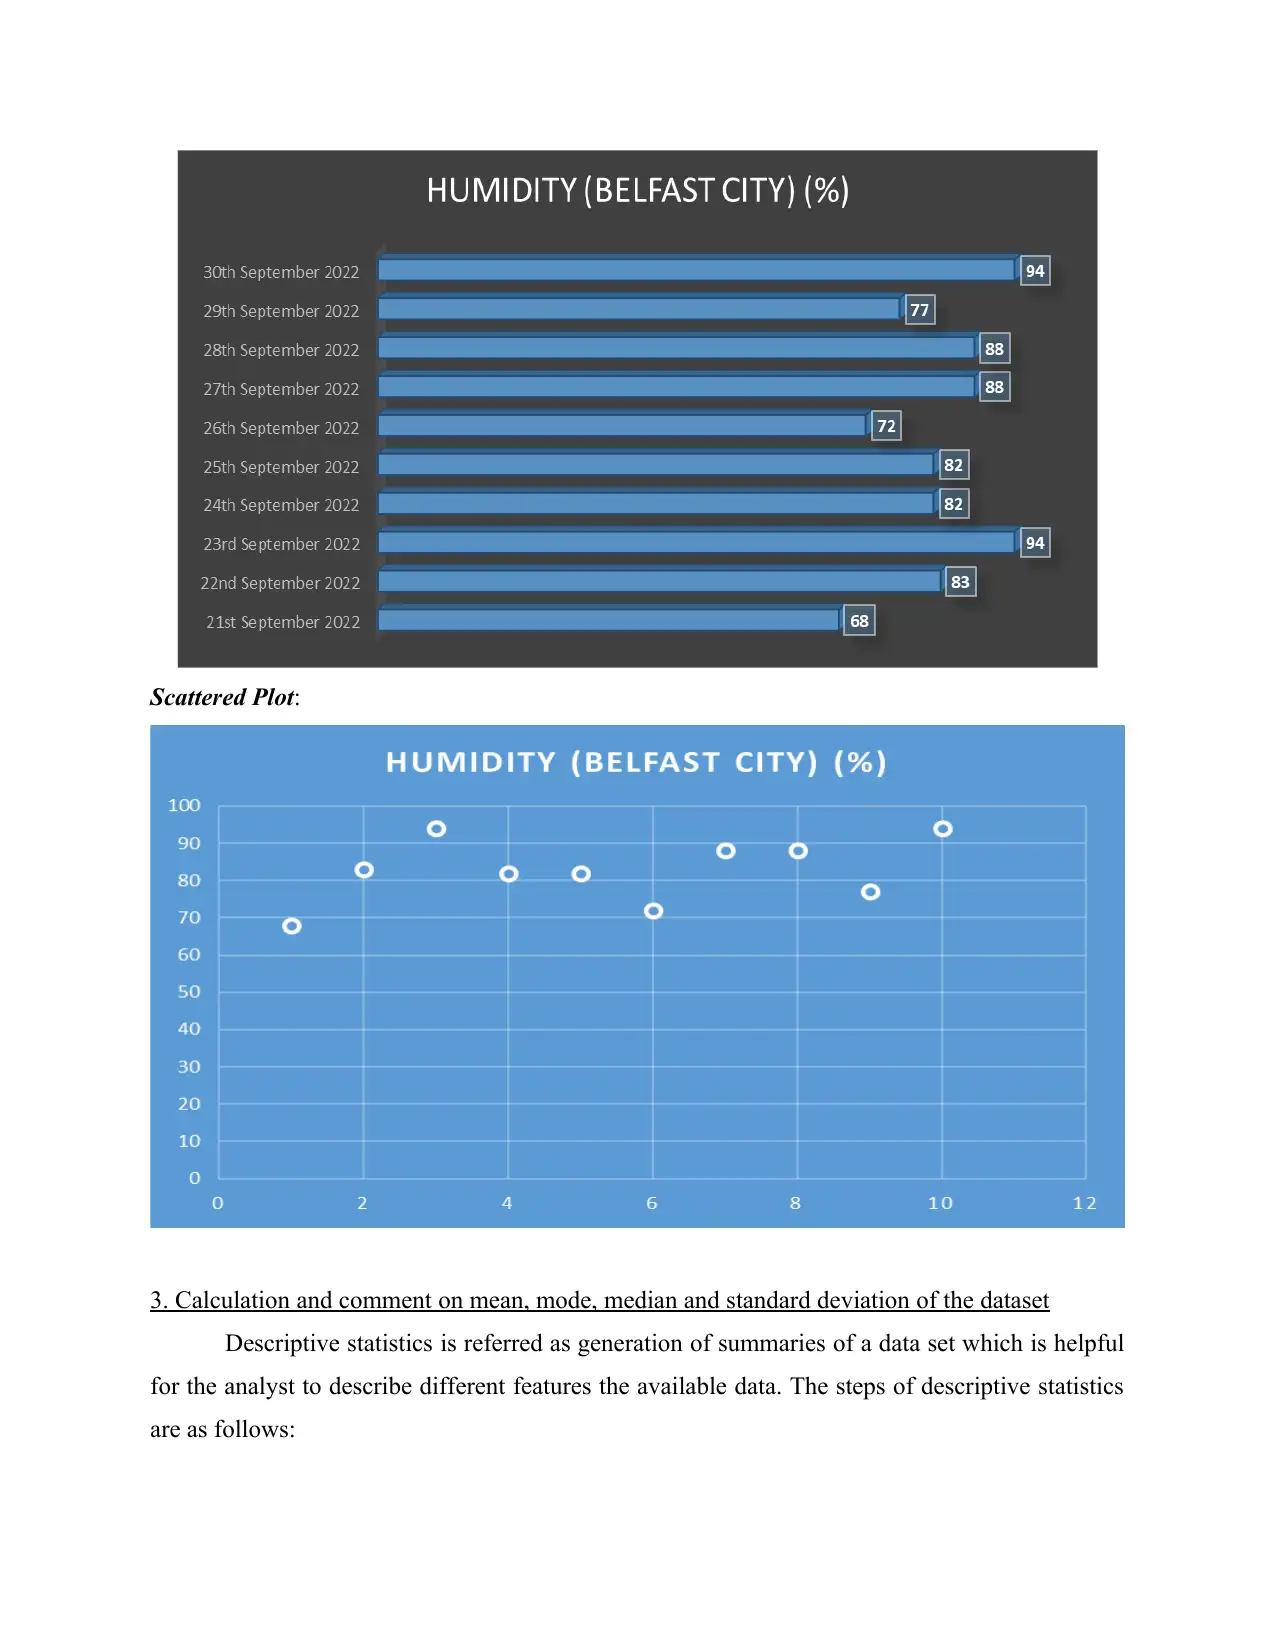
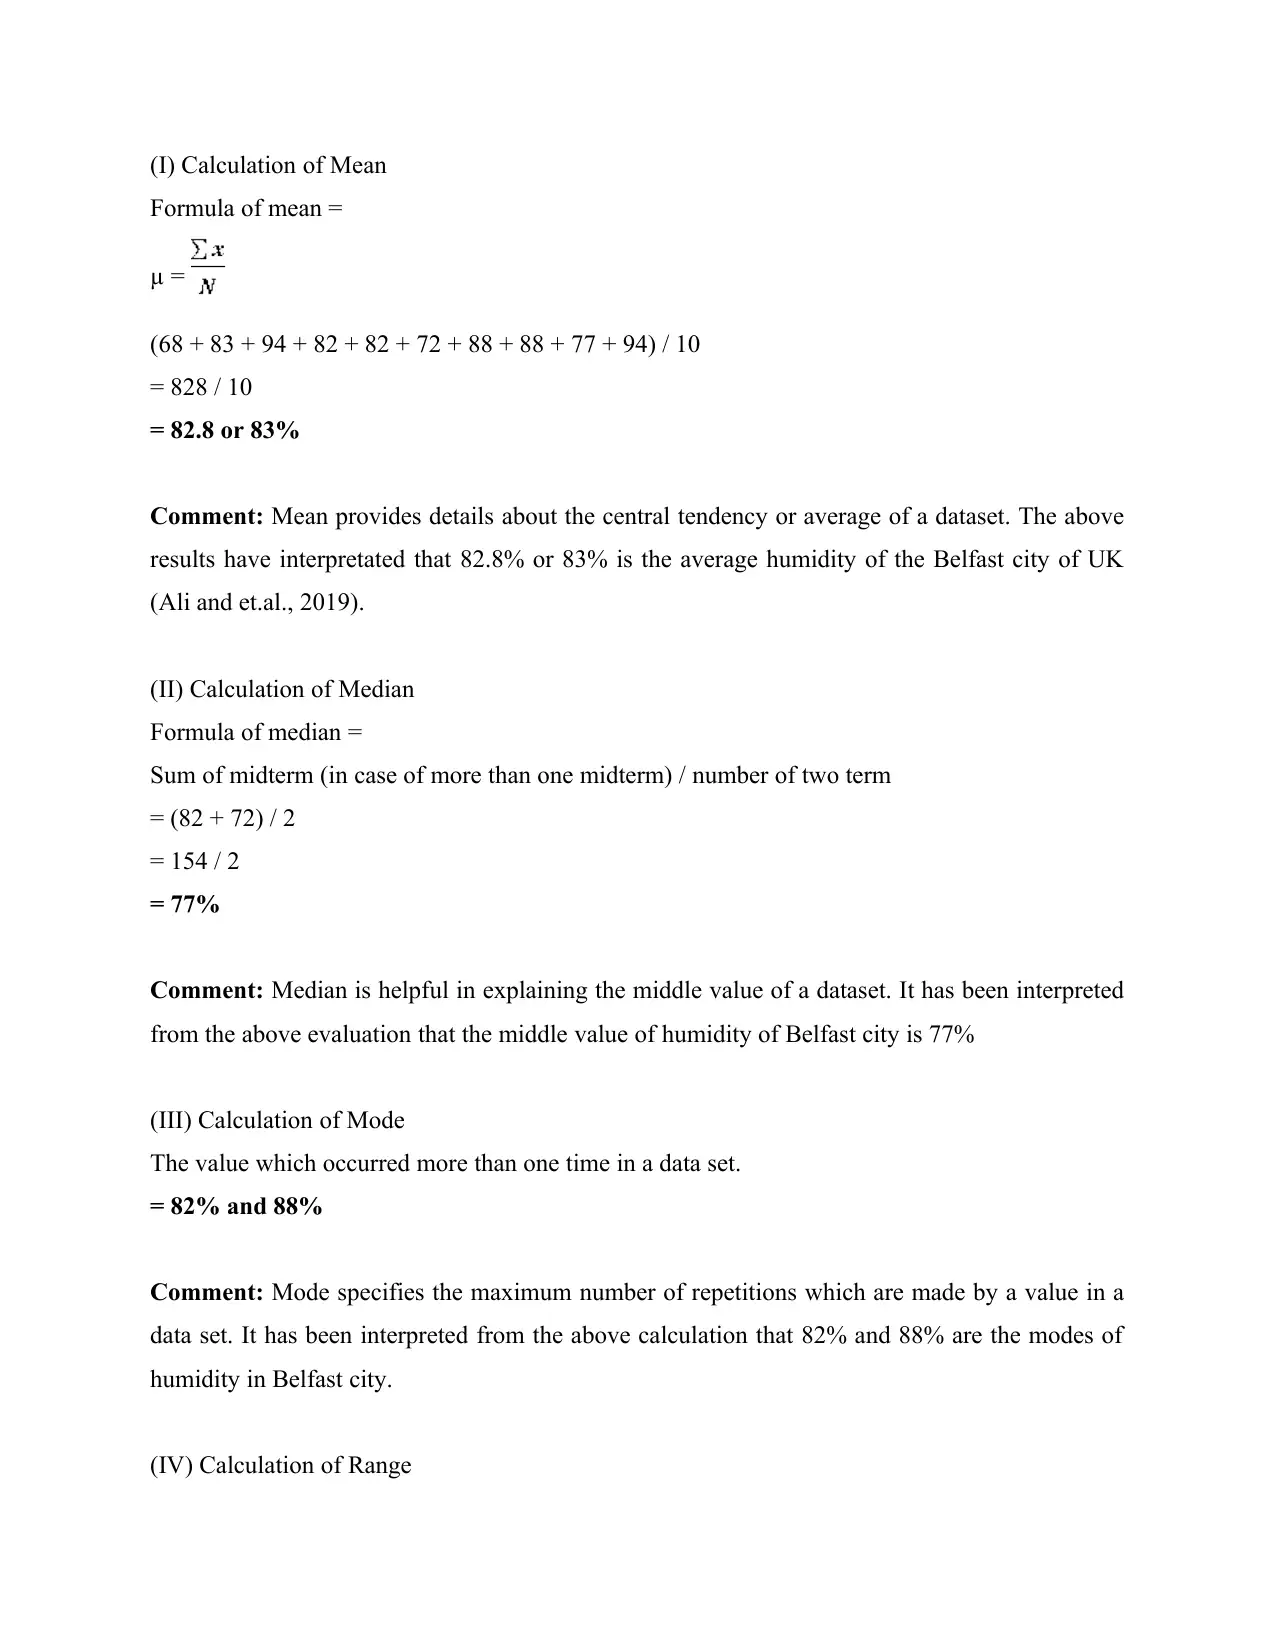
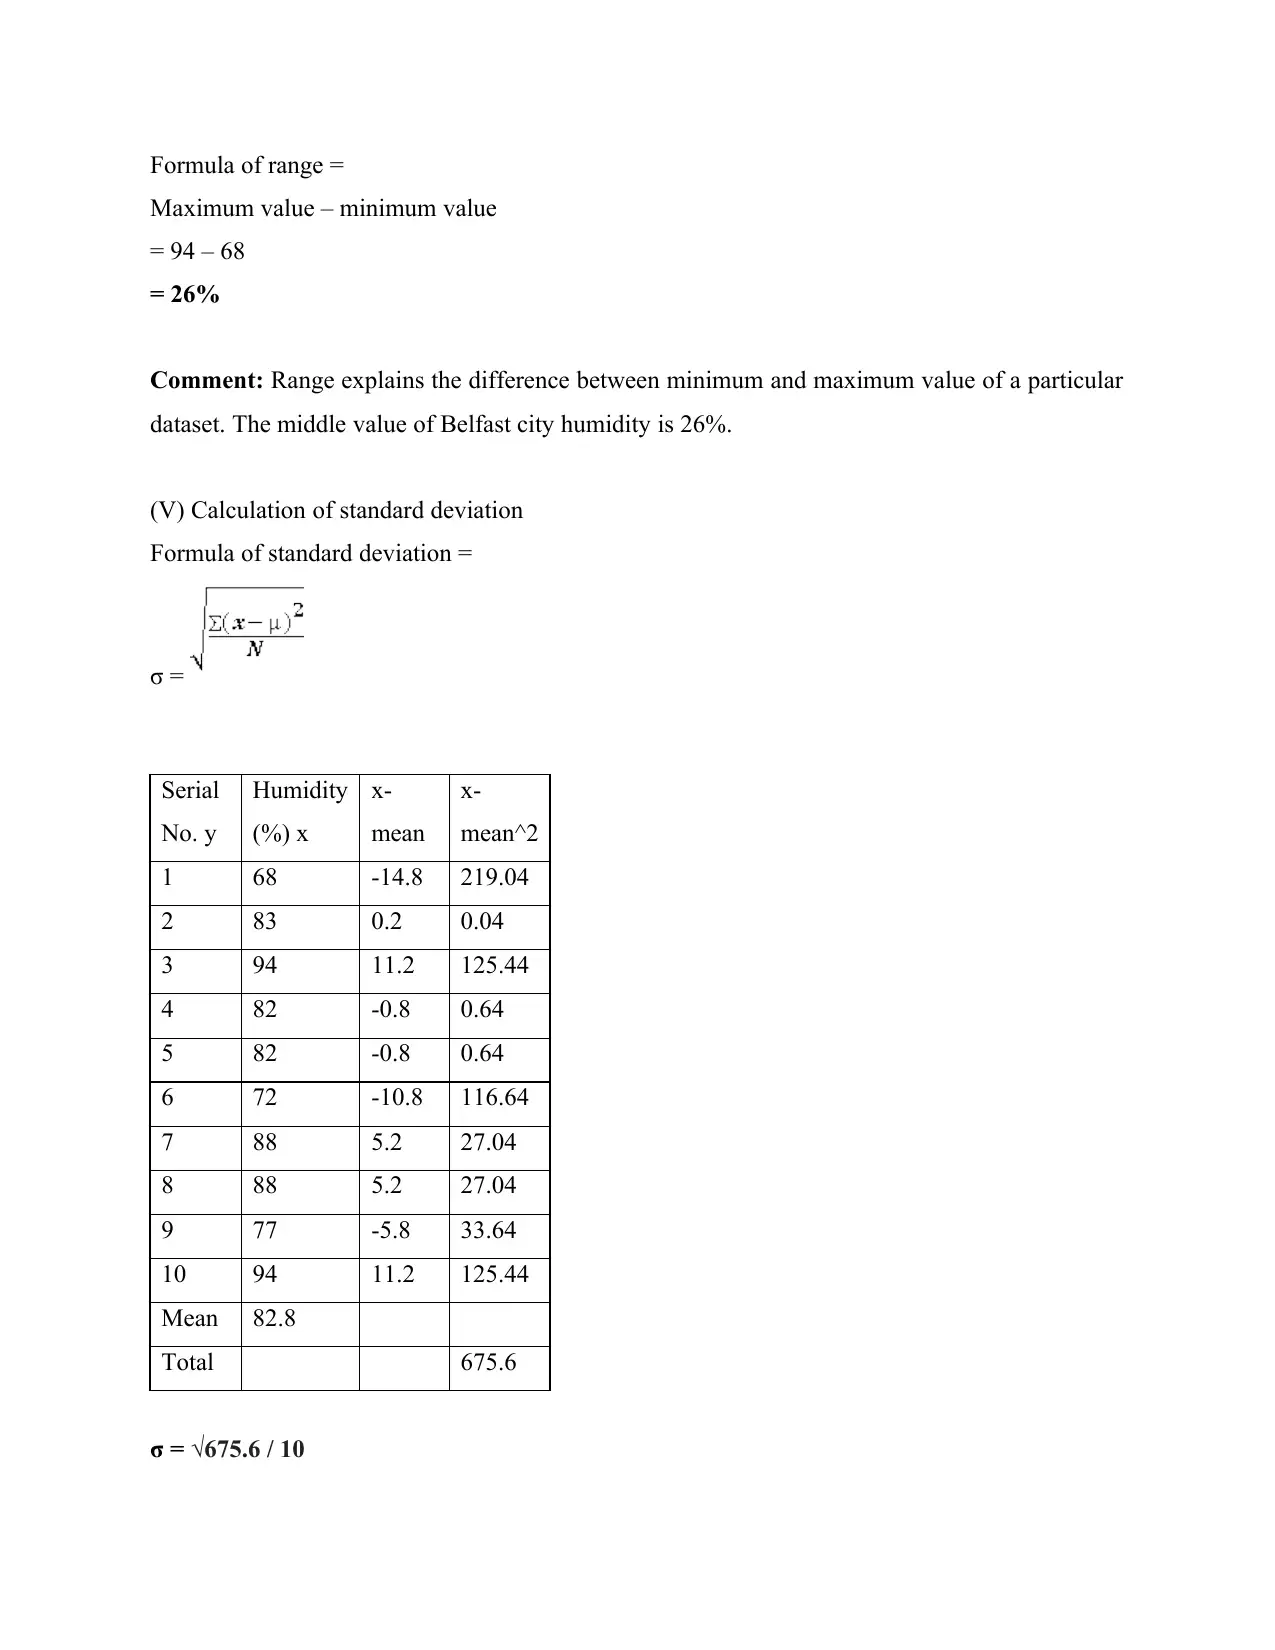
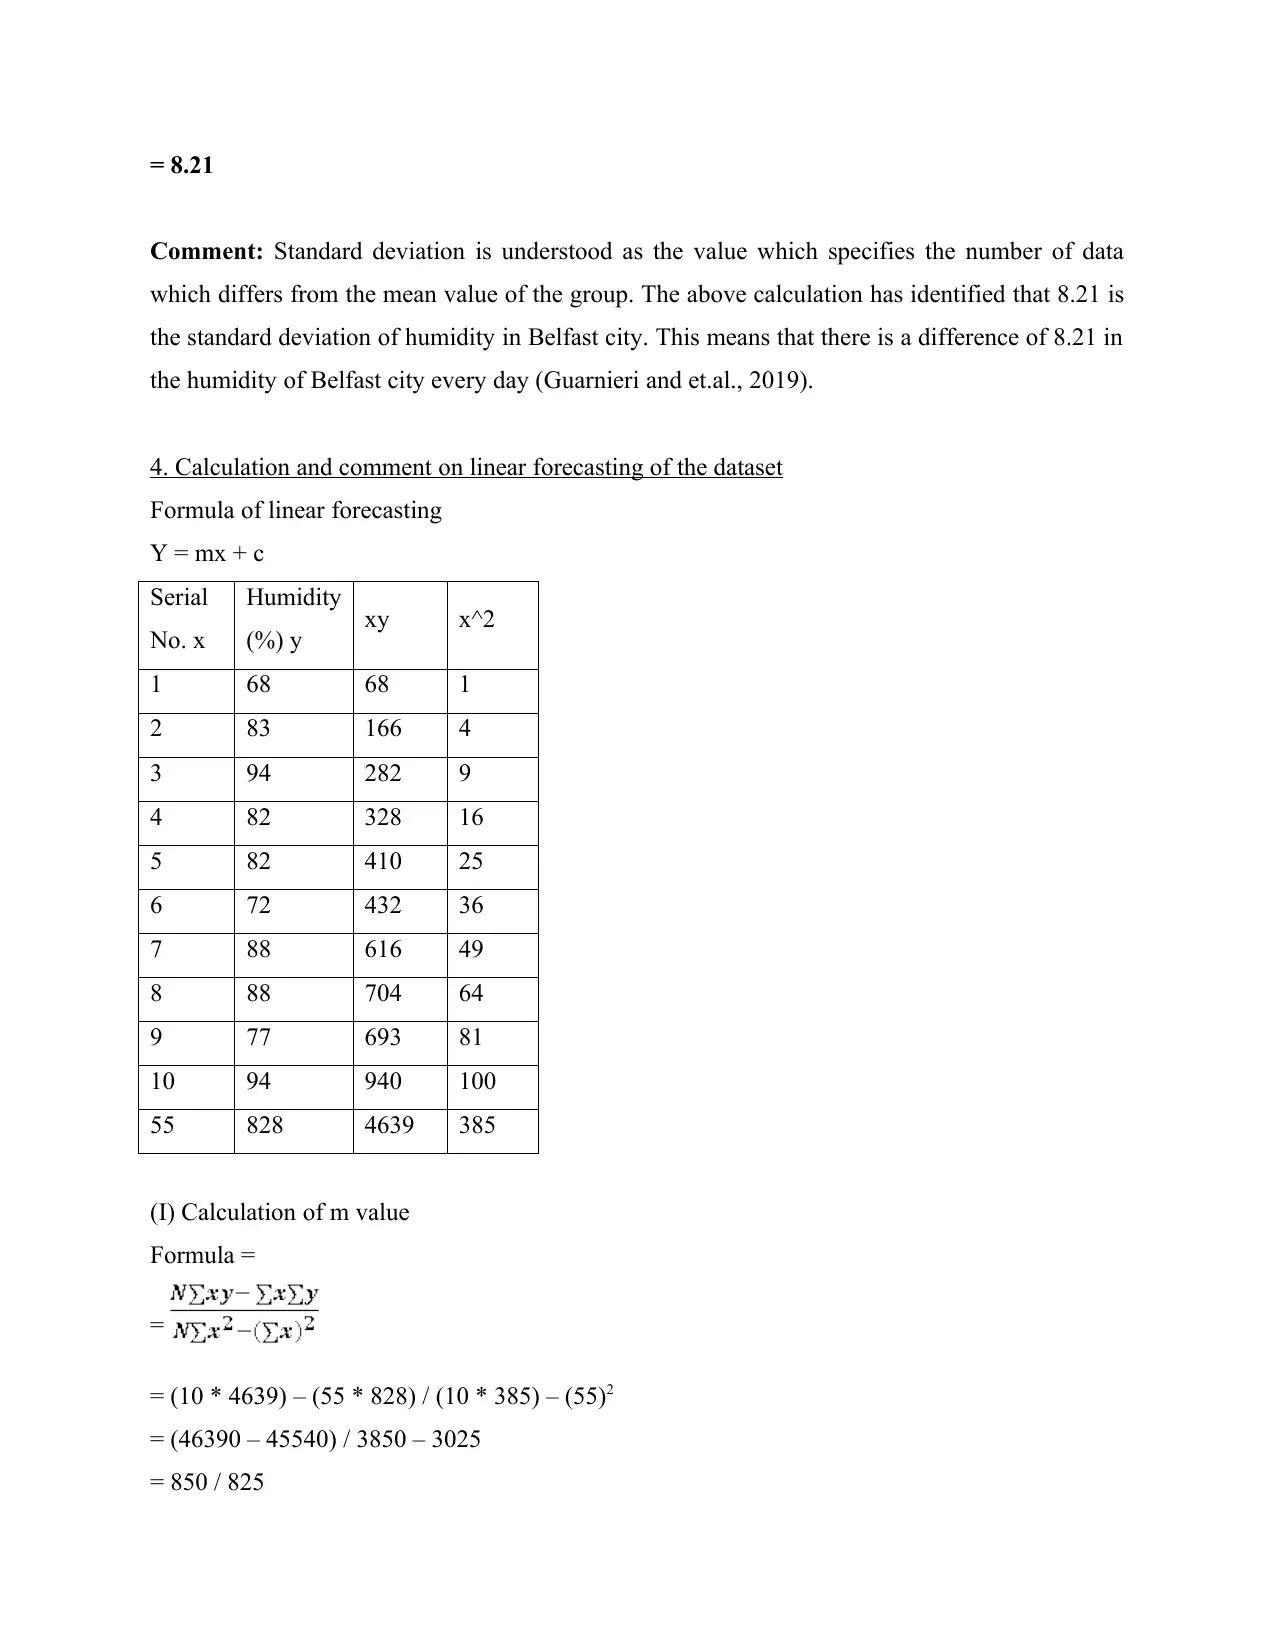
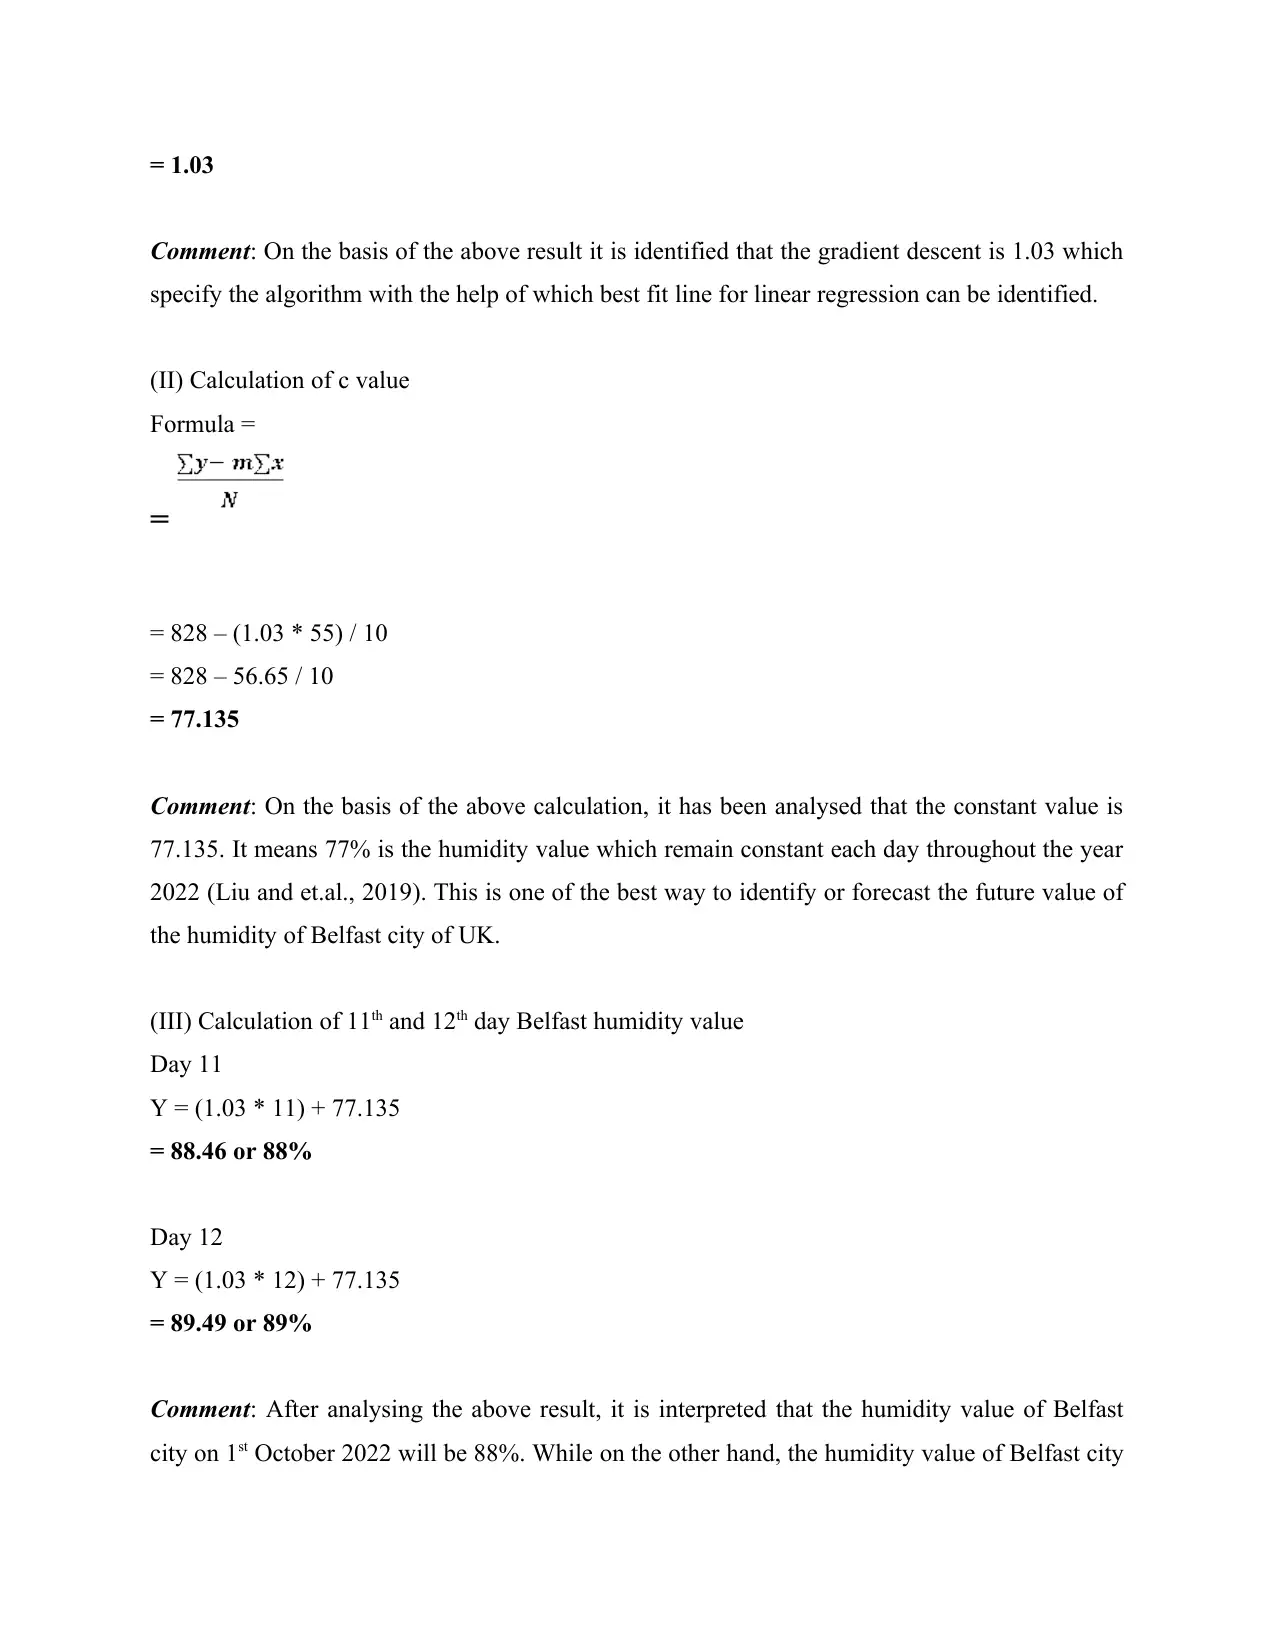
This report provides a comprehensive analysis of humidity data for Belfast, UK, focusing on descriptive statistics and linear forecasting. The analysis includes arranging the humidity dataset, presenting it using bar charts and scatter plots, and calculating key statistical measures such as mean (83%), median (77%), mode (82% and 88%), range (26%), and standard deviation (8.21). The report also employs linear forecasting to estimate humidity values for the 11th and 12th days, predicting 88% and 89% respectively. The linear forecasting model identified a gradient descent of 1.03 and a constant value of 77.135. The report concludes by highlighting the utility of data analysis and linear forecasting in predicting future trends, such as humidity levels, and their broader applications in organizational sales forecasting. This report is beneficial for students looking for solved assignments and past papers; Desklib offers a wide array of such resources.

1 out of 11
Related Documents


Your All-in-One AI-Powered Toolkit for Academic Success.
+13062052269
info@desklib.com
Available 24*7 on WhatsApp / Email
![[object Object]](/_next/static/media/star-bottom.7253800d.svg)
Copyright © 2020–2026 A2Z Services. All Rights Reserved. Developed and managed by ZUCOL.