MGT723 Research Project Report: Carbon Emission Analysis Findings
VerifiedAdded on 2023/06/03
|9
|2377
|224
Report
AI Summary
This report presents an inferential analysis of carbon emission data, utilizing ANOVA and T-tests to explore the relationships between various independent variables and carbon emission reduction. The analysis investigates the impact of factors such as the board of directors, board responsibilities, incentive targets, and management incentives on carbon emissions. The ANOVA tests compare means across different groups, while the t-test assesses the significance of the relationships. The findings reveal insights into the influence of these variables on emission levels, with a discussion on the implications of the results. The report also discusses the limitations of the study, including data collection challenges and the need for further research to address these issues. The conclusion emphasizes the importance of understanding these relationships for effective carbon emission reduction strategies.
Data analysis –inferential
At this section of the report we are going apply two methods of analysis and that is; t-test and ANOVA.
1. ANOVA TEST
ANOVA table can be used to compare means of more than two population compared to t-test.
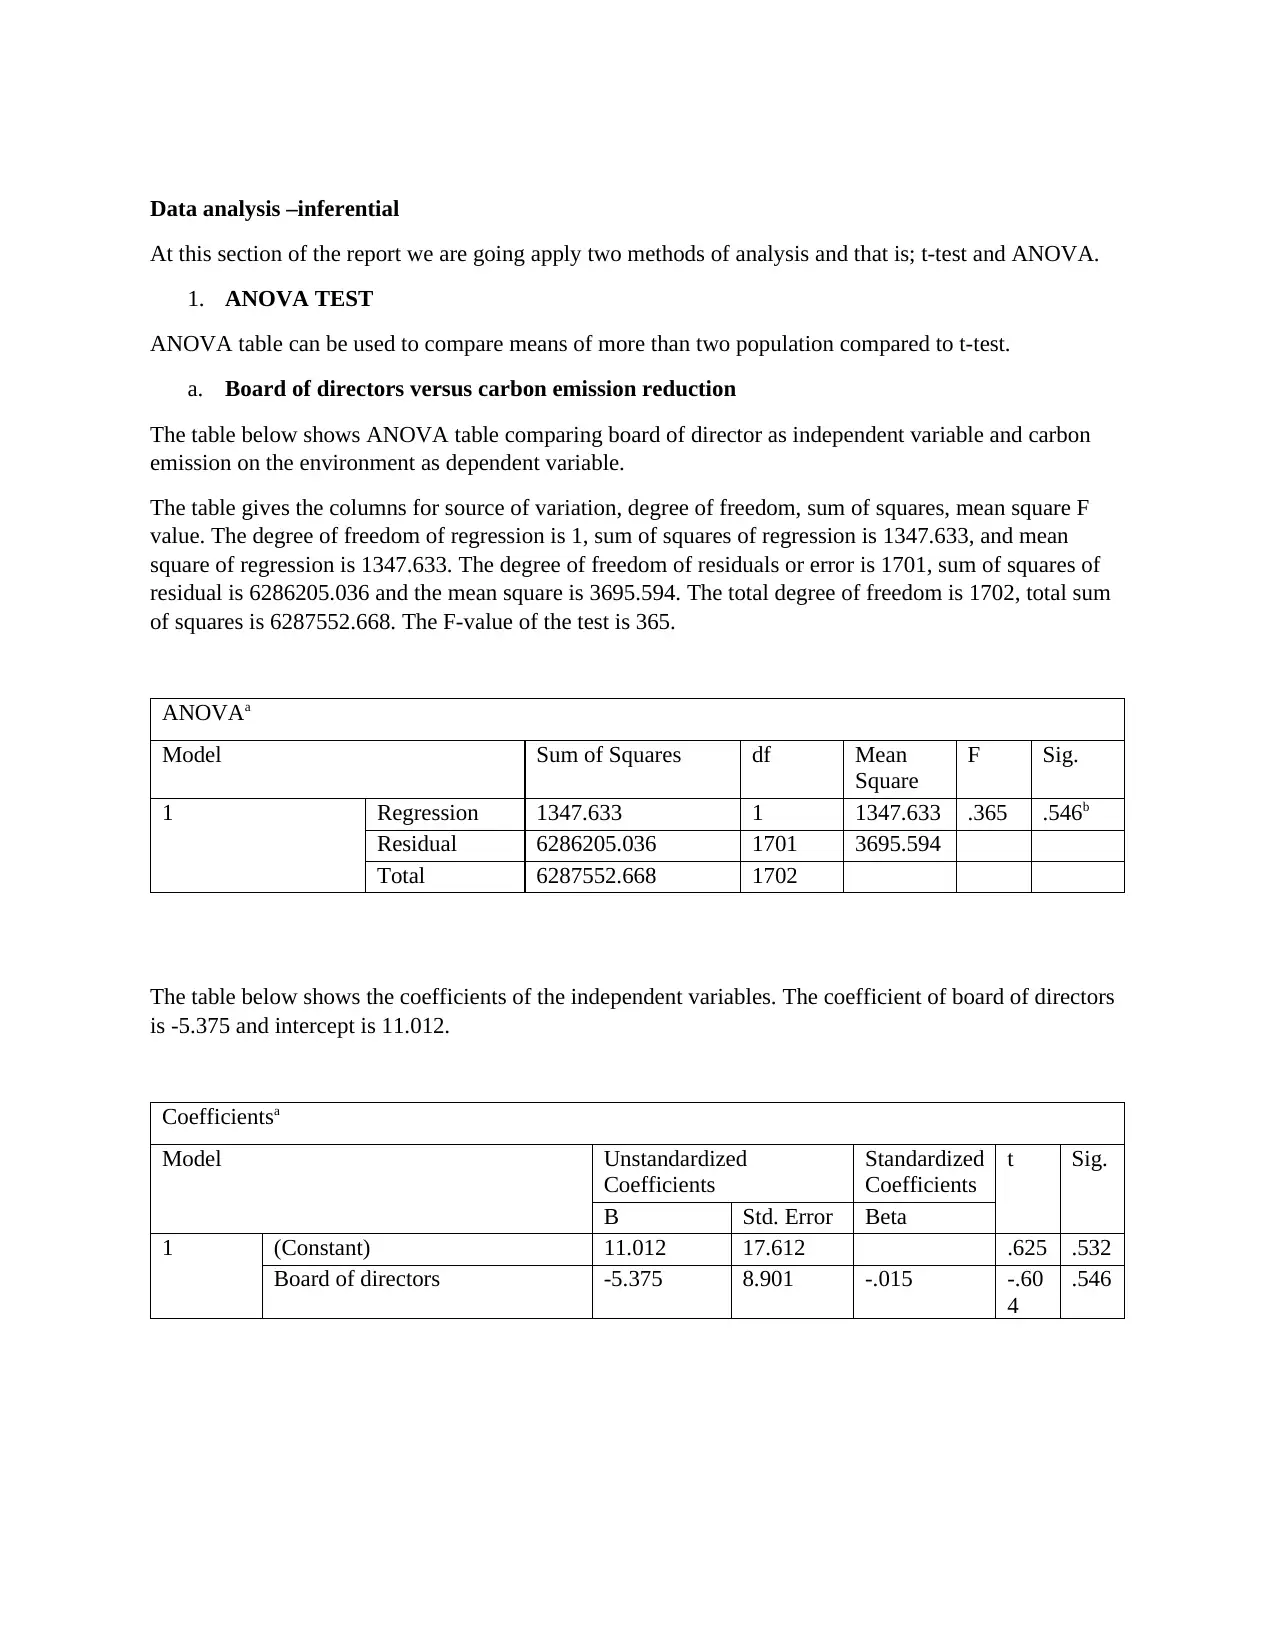
a. Board of directors versus carbon emission reduction
The table below shows ANOVA table comparing board of director as independent variable and carbon
emission on the environment as dependent variable.
The table gives the columns for source of variation, degree of freedom, sum of squares, mean square F
value. The degree of freedom of regression is 1, sum of squares of regression is 1347.633, and mean
square of regression is 1347.633. The degree of freedom of residuals or error is 1701, sum of squares of
residual is 6286205.036 and the mean square is 3695.594. The total degree of freedom is 1702, total sum
of squares is 6287552.668. The F-value of the test is 365.
ANOVAa
Model Sum of Squares df Mean
Square
F Sig.
1 Regression 1347.633 1 1347.633 .365 .546b
Residual 6286205.036 1701 3695.594
Total 6287552.668 1702
The table below shows the coefficients of the independent variables. The coefficient of board of directors
is -5.375 and intercept is 11.012.
Coefficientsa
Model Unstandardized
Coefficients
Standardized
Coefficients
t Sig.
B Std. Error Beta
1 (Constant) 11.012 17.612 .625 .532
Board of directors -5.375 8.901 -.015 -.60
4
.546
At this section of the report we are going apply two methods of analysis and that is; t-test and ANOVA.
1. ANOVA TEST
ANOVA table can be used to compare means of more than two population compared to t-test.
a. Board of directors versus carbon emission reduction
The table below shows ANOVA table comparing board of director as independent variable and carbon
emission on the environment as dependent variable.
The table gives the columns for source of variation, degree of freedom, sum of squares, mean square F
value. The degree of freedom of regression is 1, sum of squares of regression is 1347.633, and mean
square of regression is 1347.633. The degree of freedom of residuals or error is 1701, sum of squares of
residual is 6286205.036 and the mean square is 3695.594. The total degree of freedom is 1702, total sum
of squares is 6287552.668. The F-value of the test is 365.
ANOVAa
Model Sum of Squares df Mean
Square
F Sig.
1 Regression 1347.633 1 1347.633 .365 .546b
Residual 6286205.036 1701 3695.594
Total 6287552.668 1702
The table below shows the coefficients of the independent variables. The coefficient of board of directors
is -5.375 and intercept is 11.012.
Coefficientsa
Model Unstandardized
Coefficients
Standardized
Coefficients
t Sig.
B Std. Error Beta
1 (Constant) 11.012 17.612 .625 .532
Board of directors -5.375 8.901 -.015 -.60
4
.546
Paraphrase This Document
Need a fresh take? Get an instant paraphrase of this document with our AI Paraphraser
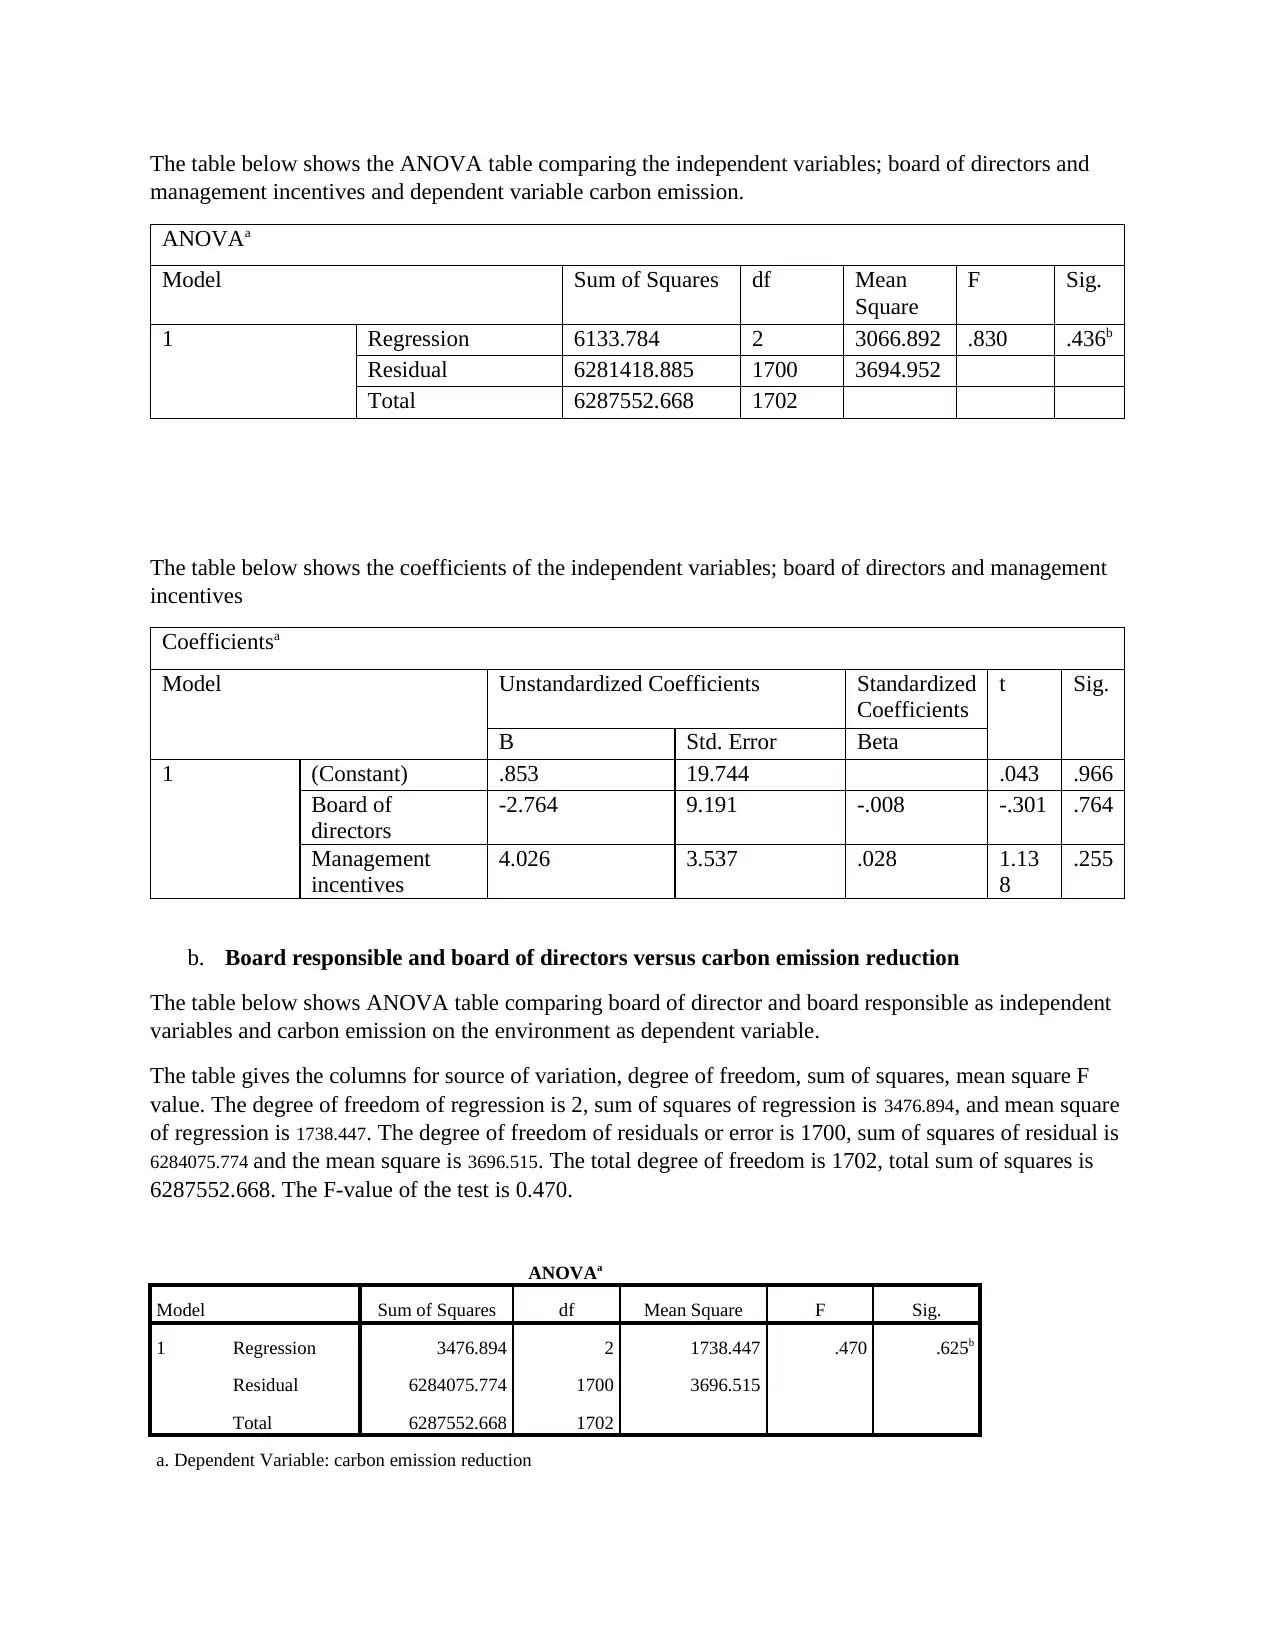
The table below shows the ANOVA table comparing the independent variables; board of directors and
management incentives and dependent variable carbon emission.
ANOVAa
Model Sum of Squares df Mean
Square
F Sig.
1 Regression 6133.784 2 3066.892 .830 .436b
Residual 6281418.885 1700 3694.952
Total 6287552.668 1702
The table below shows the coefficients of the independent variables; board of directors and management
incentives
Coefficientsa
Model Unstandardized Coefficients Standardized
Coefficients
t Sig.
B Std. Error Beta
1 (Constant) .853 19.744 .043 .966
Board of
directors
-2.764 9.191 -.008 -.301 .764
Management
incentives
4.026 3.537 .028 1.13
8
.255
b. Board responsible and board of directors versus carbon emission reduction
The table below shows ANOVA table comparing board of director and board responsible as independent
variables and carbon emission on the environment as dependent variable.
The table gives the columns for source of variation, degree of freedom, sum of squares, mean square F
value. The degree of freedom of regression is 2, sum of squares of regression is 3476.894, and mean square
of regression is 1738.447. The degree of freedom of residuals or error is 1700, sum of squares of residual is
6284075.774 and the mean square is 3696.515. The total degree of freedom is 1702, total sum of squares is
6287552.668. The F-value of the test is 0.470.
ANOVAa
Model Sum of Squares df Mean Square F Sig.
1 Regression 3476.894 2 1738.447 .470 .625b
Residual 6284075.774 1700 3696.515
Total 6287552.668 1702
a. Dependent Variable: carbon emission reduction
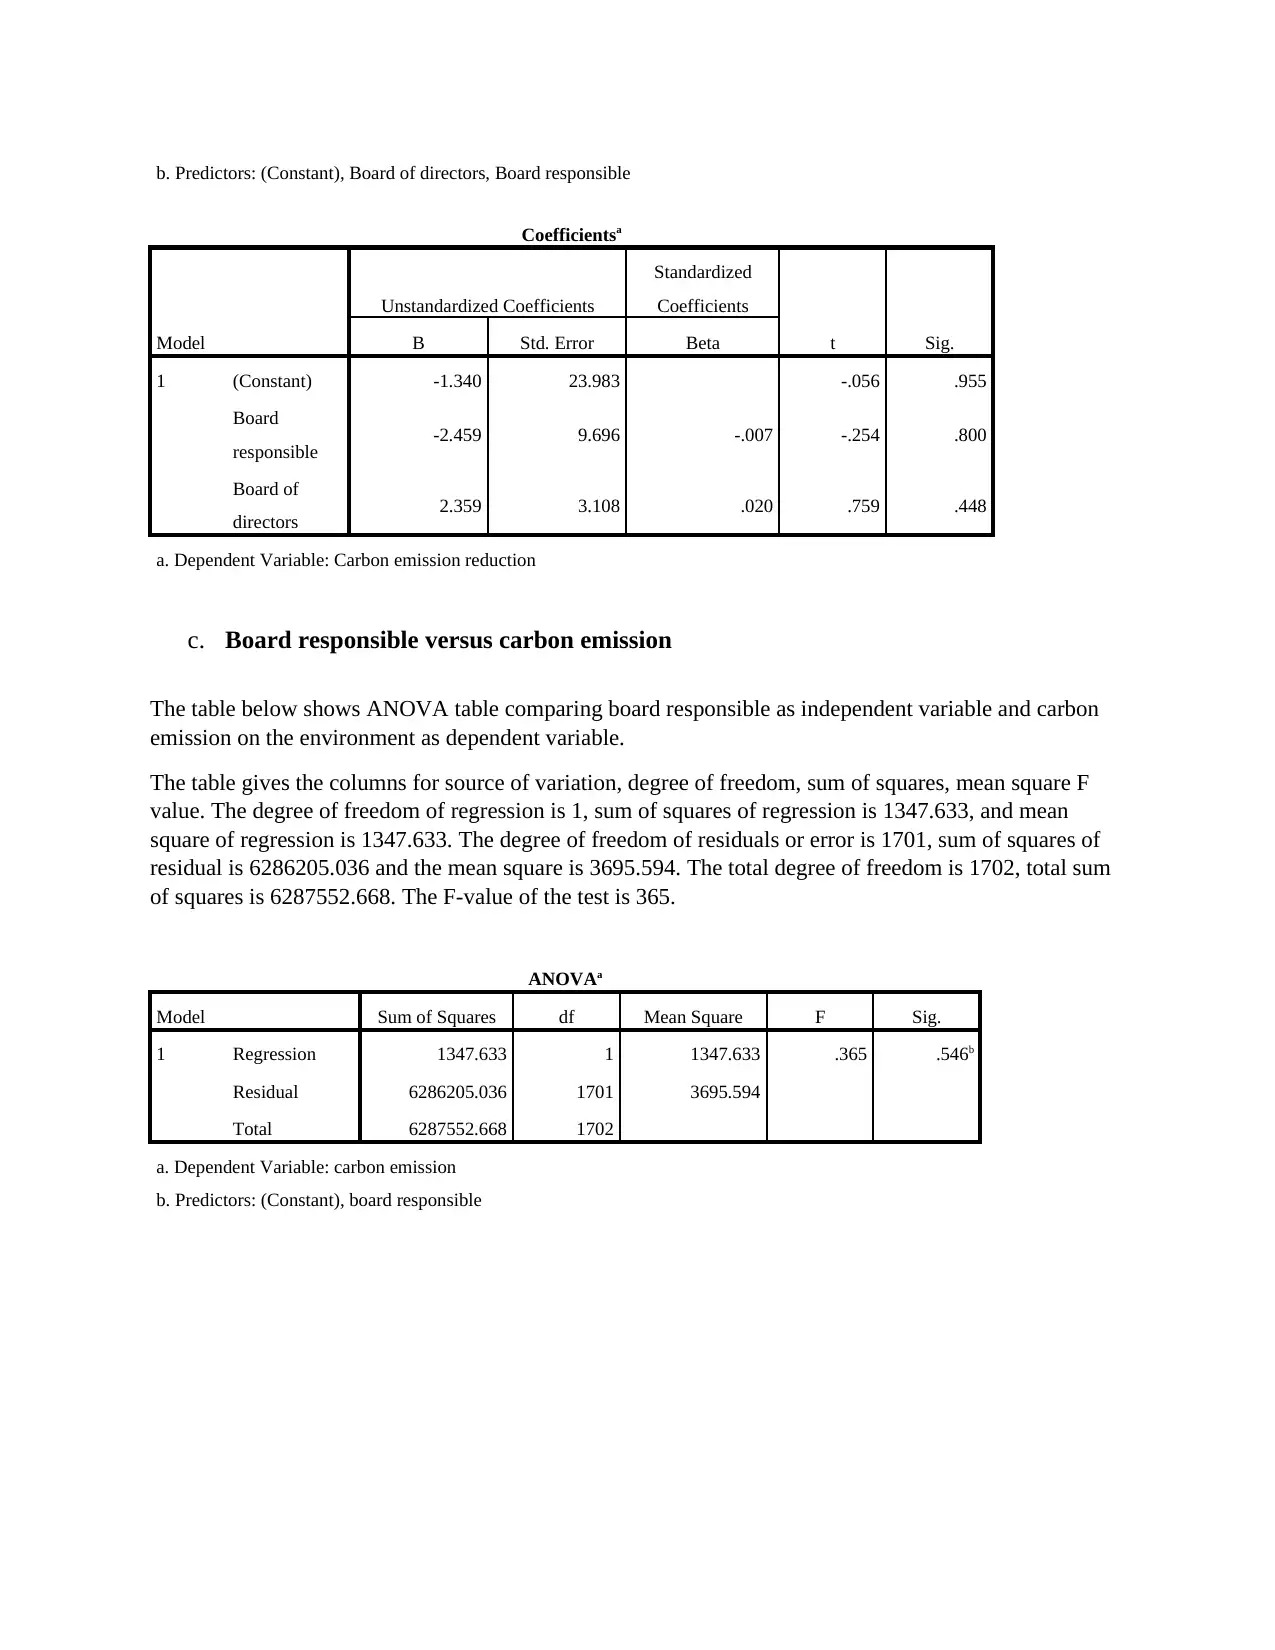
b. Predictors: (Constant), Board of directors, Board responsible
Coefficientsa
Model
Unstandardized Coefficients
Standardized
Coefficients
t Sig.B Std. Error Beta
1 (Constant) -1.340 23.983 -.056 .955
Board
responsible -2.459 9.696 -.007 -.254 .800
Board of
directors 2.359 3.108 .020 .759 .448
a. Dependent Variable: Carbon emission reduction
c. Board responsible versus carbon emission
The table below shows ANOVA table comparing board responsible as independent variable and carbon
emission on the environment as dependent variable.
The table gives the columns for source of variation, degree of freedom, sum of squares, mean square F
value. The degree of freedom of regression is 1, sum of squares of regression is 1347.633, and mean
square of regression is 1347.633. The degree of freedom of residuals or error is 1701, sum of squares of
residual is 6286205.036 and the mean square is 3695.594. The total degree of freedom is 1702, total sum
of squares is 6287552.668. The F-value of the test is 365.
ANOVAa
Model Sum of Squares df Mean Square F Sig.
1 Regression 1347.633 1 1347.633 .365 .546b
Residual 6286205.036 1701 3695.594
Total 6287552.668 1702
a. Dependent Variable: carbon emission
b. Predictors: (Constant), board responsible
⊘ This is a preview!⊘
Do you want full access?
Subscribe today to unlock all pages.
Trusted by 1+ million students worldwide
Coefficientsa
Model
Unstandardized Coefficients
Standardized
Coefficients
t Sig.B Std. Error Beta
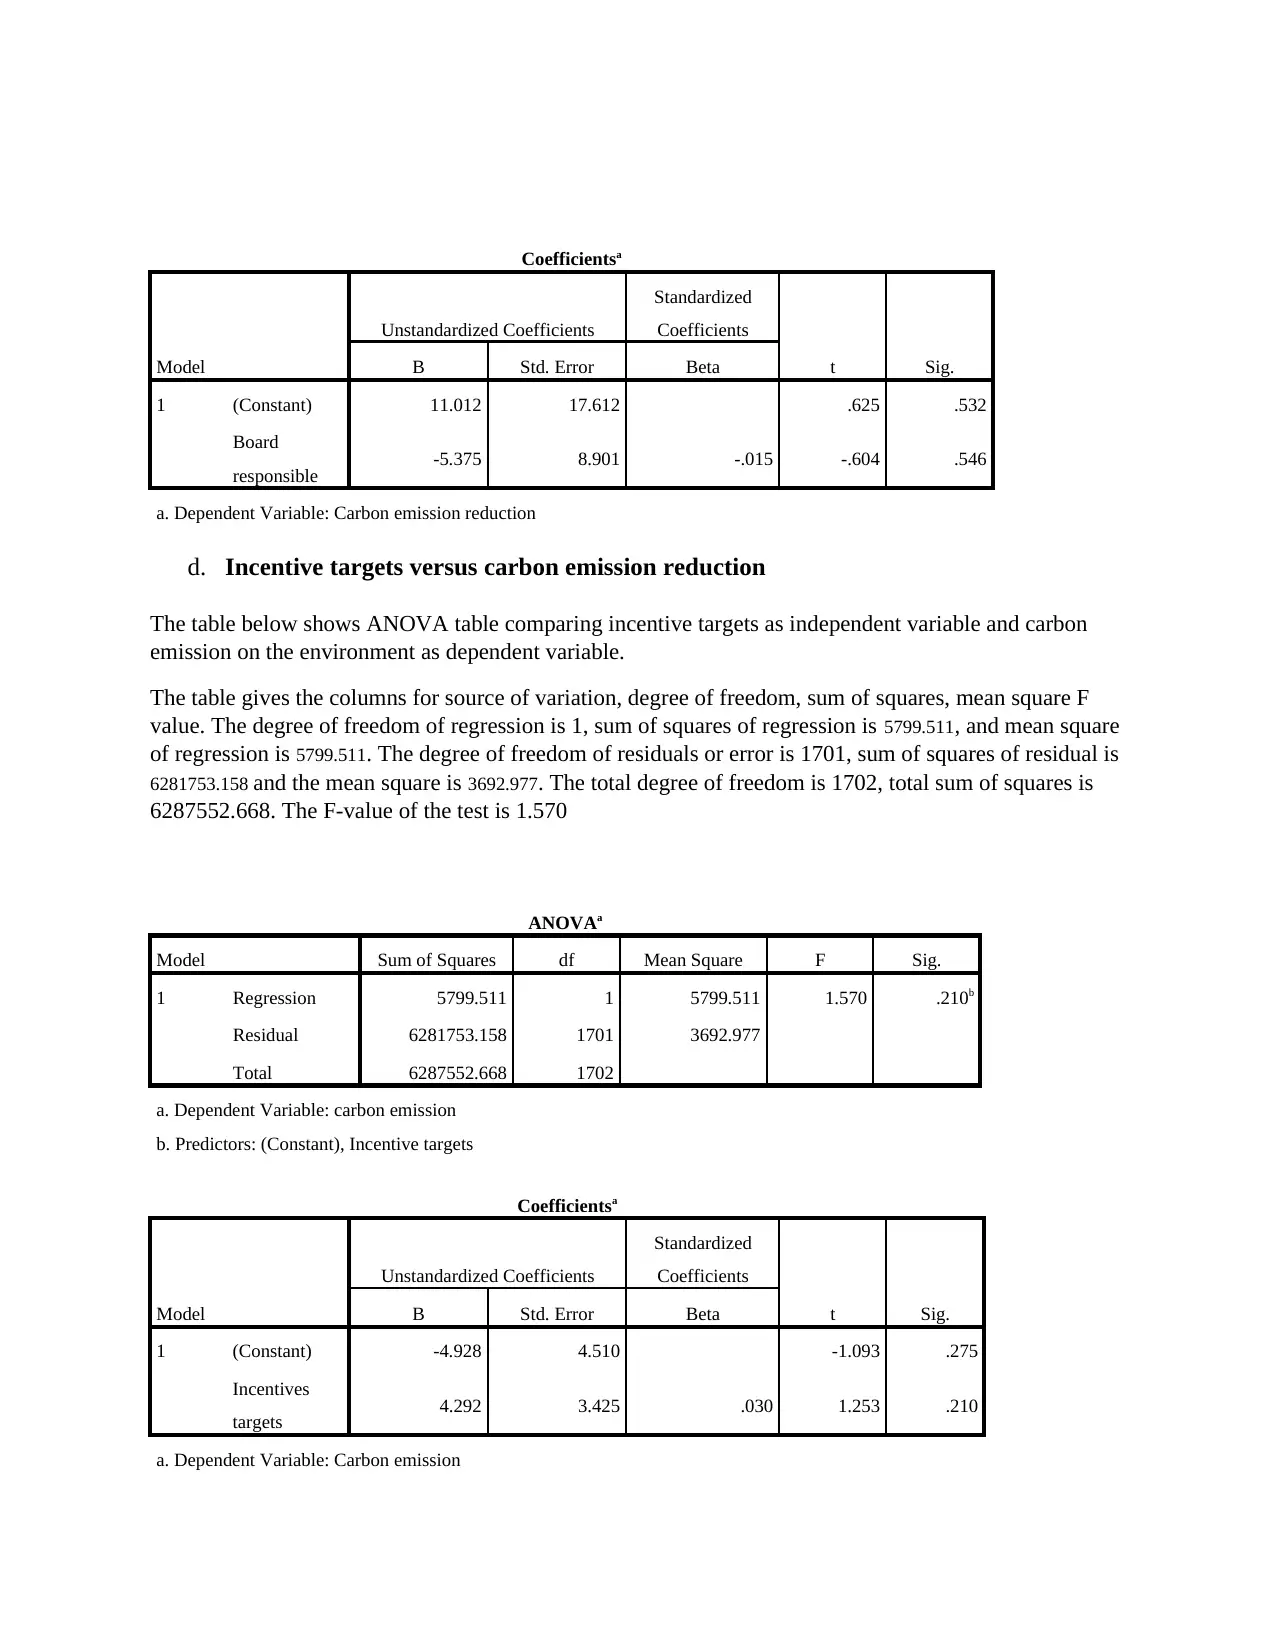
1 (Constant) 11.012 17.612 .625 .532
Board
responsible -5.375 8.901 -.015 -.604 .546
a. Dependent Variable: Carbon emission reduction
d. Incentive targets versus carbon emission reduction
The table below shows ANOVA table comparing incentive targets as independent variable and carbon
emission on the environment as dependent variable.
The table gives the columns for source of variation, degree of freedom, sum of squares, mean square F
value. The degree of freedom of regression is 1, sum of squares of regression is 5799.511, and mean square
of regression is 5799.511. The degree of freedom of residuals or error is 1701, sum of squares of residual is
6281753.158 and the mean square is 3692.977. The total degree of freedom is 1702, total sum of squares is
6287552.668. The F-value of the test is 1.570
ANOVAa
Model Sum of Squares df Mean Square F Sig.
1 Regression 5799.511 1 5799.511 1.570 .210b
Residual 6281753.158 1701 3692.977
Total 6287552.668 1702
a. Dependent Variable: carbon emission
b. Predictors: (Constant), Incentive targets
Coefficientsa
Model
Unstandardized Coefficients
Standardized
Coefficients
t Sig.B Std. Error Beta
1 (Constant) -4.928 4.510 -1.093 .275
Incentives
targets 4.292 3.425 .030 1.253 .210
a. Dependent Variable: Carbon emission
Model
Unstandardized Coefficients
Standardized
Coefficients
t Sig.B Std. Error Beta
1 (Constant) 11.012 17.612 .625 .532
Board
responsible -5.375 8.901 -.015 -.604 .546
a. Dependent Variable: Carbon emission reduction
d. Incentive targets versus carbon emission reduction
The table below shows ANOVA table comparing incentive targets as independent variable and carbon
emission on the environment as dependent variable.
The table gives the columns for source of variation, degree of freedom, sum of squares, mean square F
value. The degree of freedom of regression is 1, sum of squares of regression is 5799.511, and mean square
of regression is 5799.511. The degree of freedom of residuals or error is 1701, sum of squares of residual is
6281753.158 and the mean square is 3692.977. The total degree of freedom is 1702, total sum of squares is
6287552.668. The F-value of the test is 1.570
ANOVAa
Model Sum of Squares df Mean Square F Sig.
1 Regression 5799.511 1 5799.511 1.570 .210b
Residual 6281753.158 1701 3692.977
Total 6287552.668 1702
a. Dependent Variable: carbon emission
b. Predictors: (Constant), Incentive targets
Coefficientsa
Model
Unstandardized Coefficients
Standardized
Coefficients
t Sig.B Std. Error Beta
1 (Constant) -4.928 4.510 -1.093 .275
Incentives
targets 4.292 3.425 .030 1.253 .210
a. Dependent Variable: Carbon emission
Paraphrase This Document
Need a fresh take? Get an instant paraphrase of this document with our AI Paraphraser
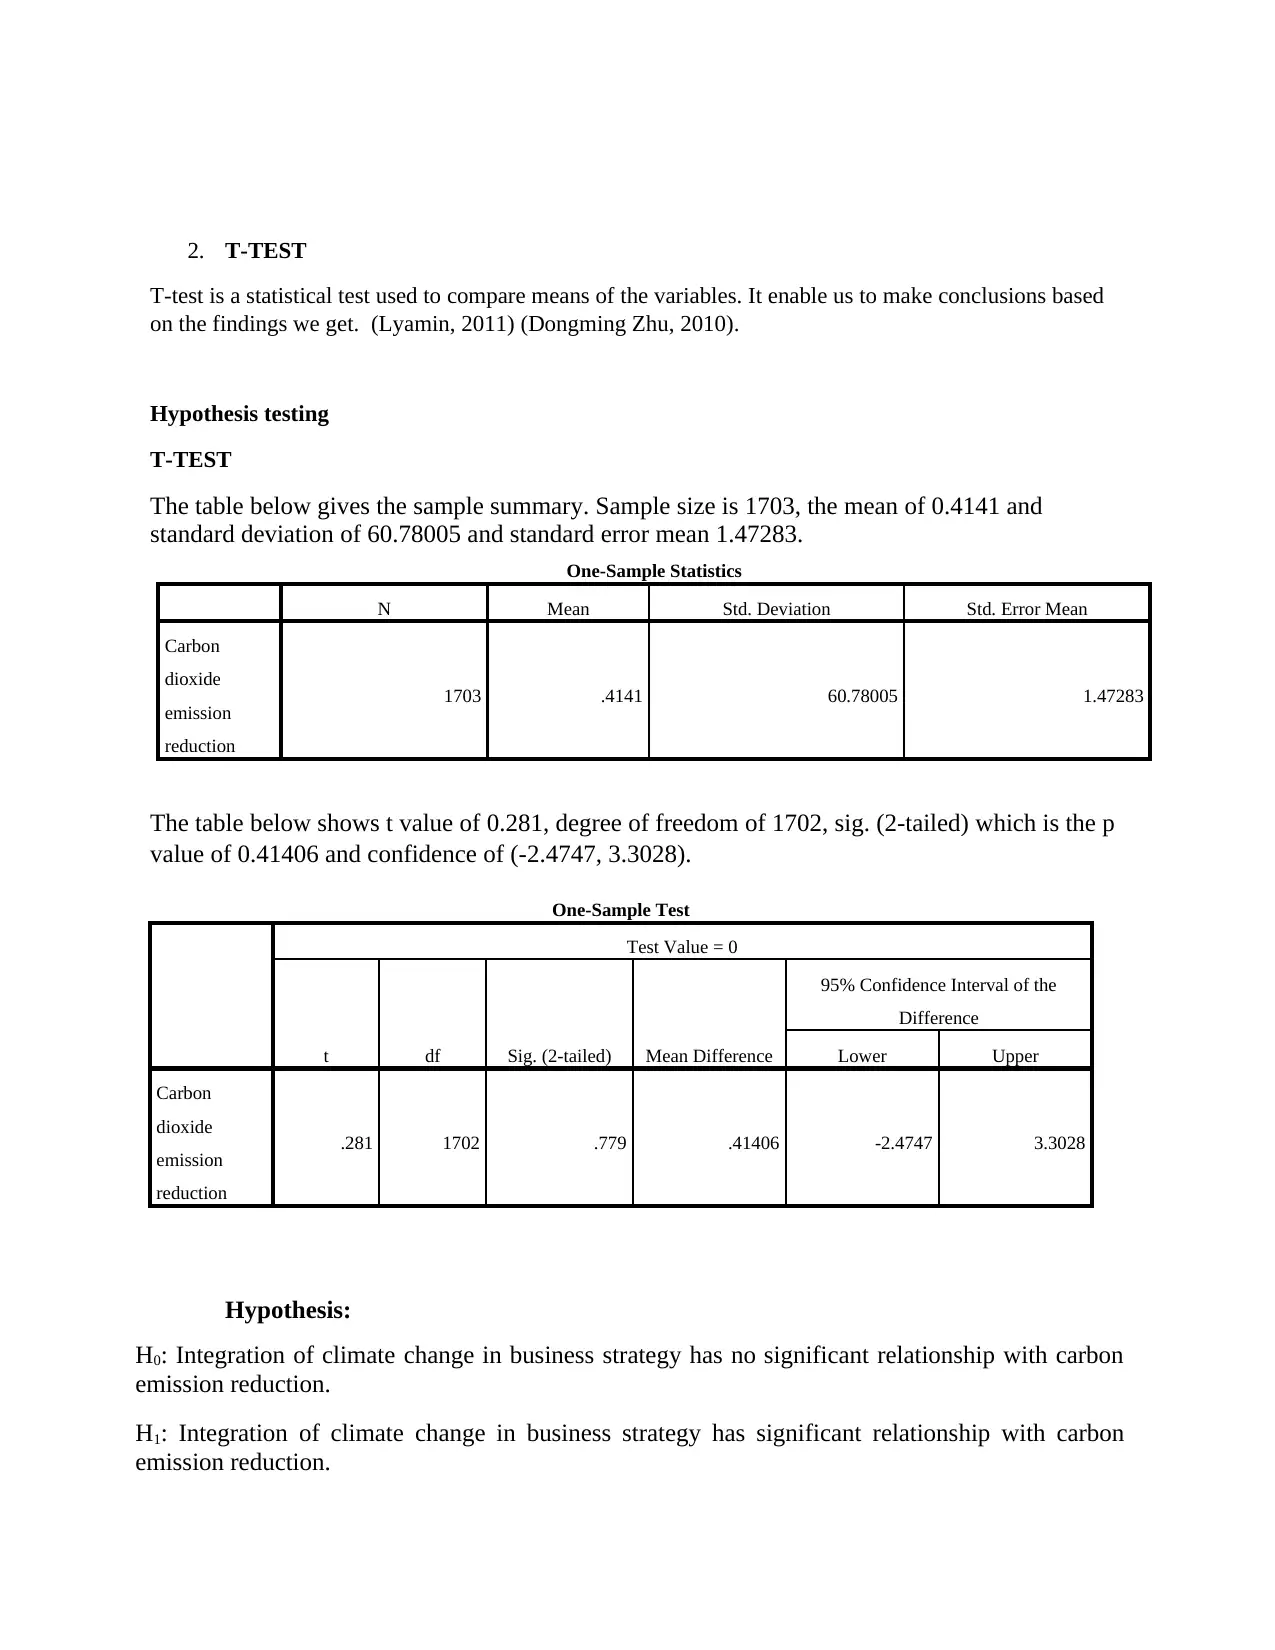
2. T-TEST
T-test is a statistical test used to compare means of the variables. It enable us to make conclusions based
on the findings we get. (Lyamin, 2011) (Dongming Zhu, 2010).
Hypothesis testing
T-TEST
The table below gives the sample summary. Sample size is 1703, the mean of 0.4141 and
standard deviation of 60.78005 and standard error mean 1.47283.
One-Sample Statistics
N Mean Std. Deviation Std. Error Mean
Carbon
dioxide
emission
reduction
1703 .4141 60.78005 1.47283
The table below shows t value of 0.281, degree of freedom of 1702, sig. (2-tailed) which is the p
value of 0.41406 and confidence of (-2.4747, 3.3028).
One-Sample Test
Test Value = 0
t df Sig. (2-tailed) Mean Difference
95% Confidence Interval of the
Difference
Lower Upper
Carbon
dioxide
emission
reduction
.281 1702 .779 .41406 -2.4747 3.3028
Hypothesis:
H0: Integration of climate change in business strategy has no significant relationship with carbon
emission reduction.
H1: Integration of climate change in business strategy has significant relationship with carbon
emission reduction.
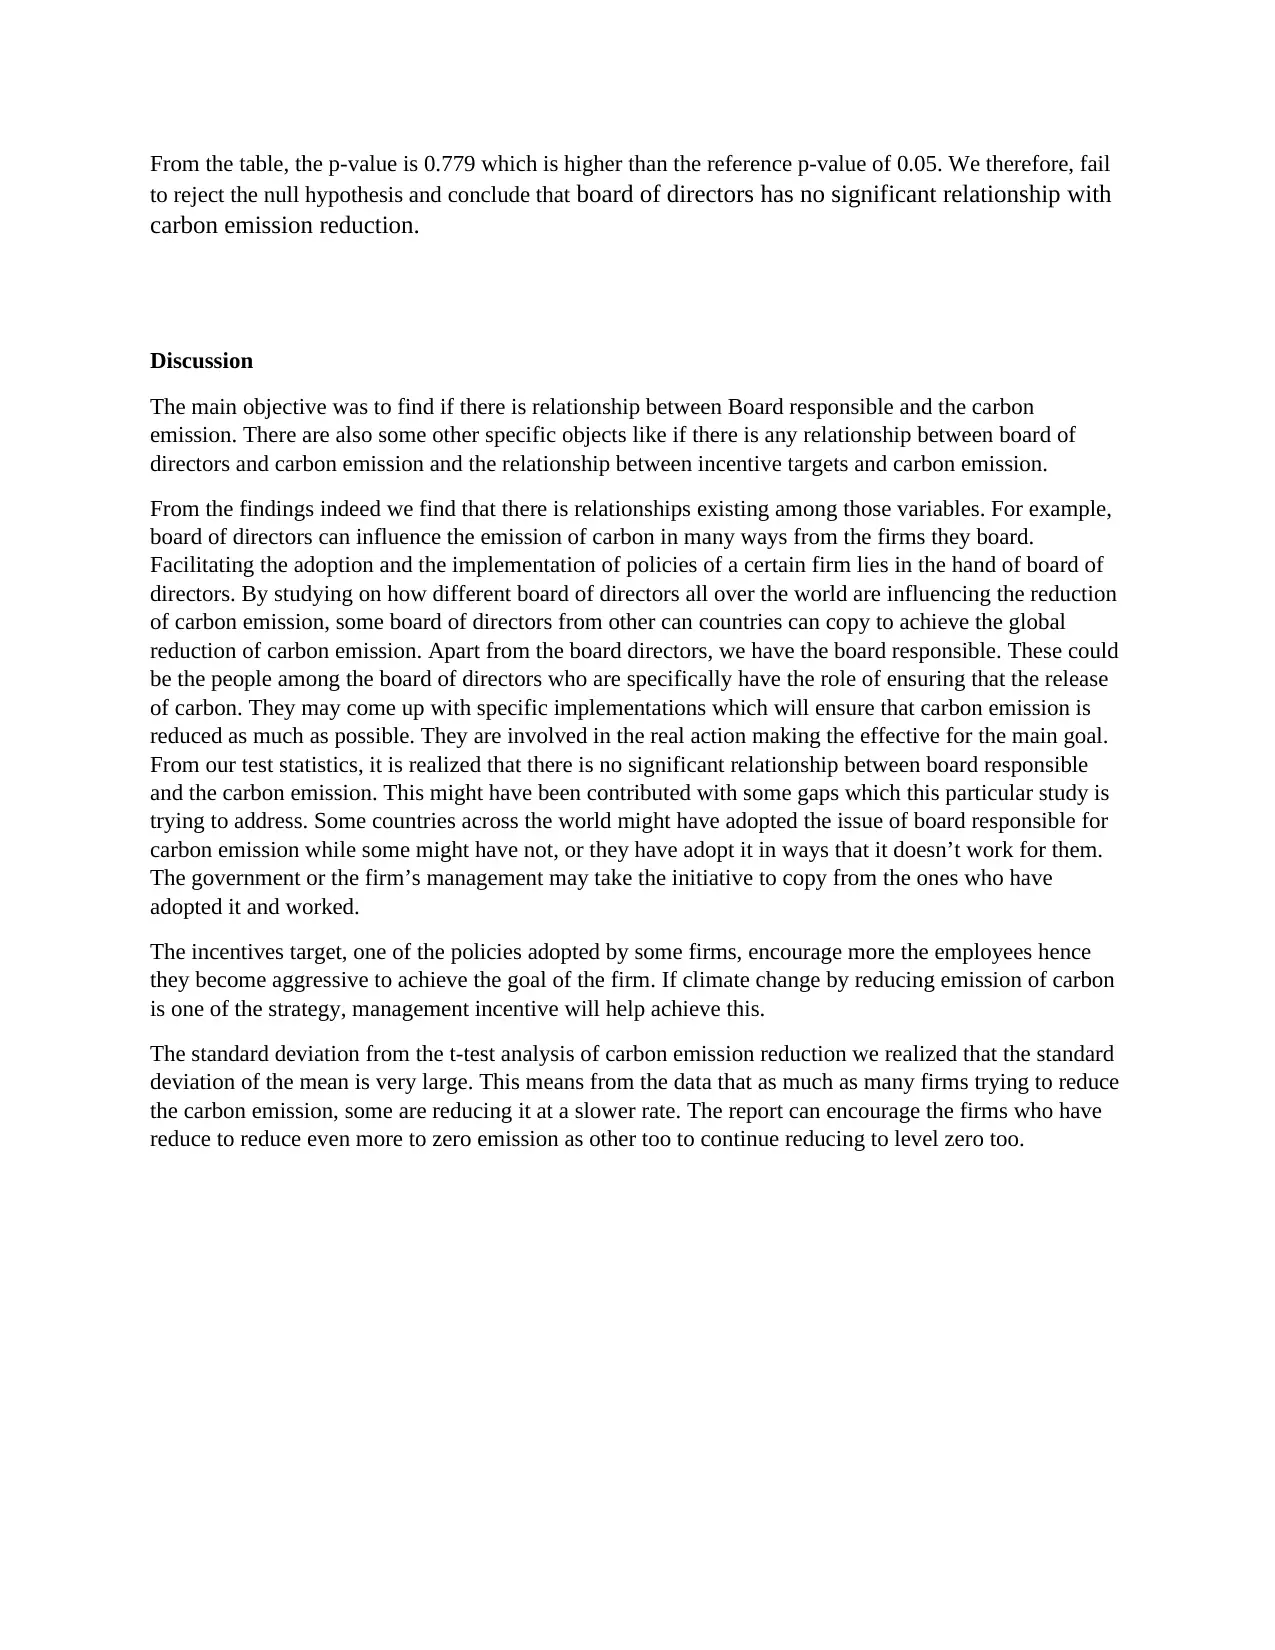
From the table, the p-value is 0.779 which is higher than the reference p-value of 0.05. We therefore, fail
to reject the null hypothesis and conclude that board of directors has no significant relationship with
carbon emission reduction.
Discussion
The main objective was to find if there is relationship between Board responsible and the carbon
emission. There are also some other specific objects like if there is any relationship between board of
directors and carbon emission and the relationship between incentive targets and carbon emission.
From the findings indeed we find that there is relationships existing among those variables. For example,
board of directors can influence the emission of carbon in many ways from the firms they board.
Facilitating the adoption and the implementation of policies of a certain firm lies in the hand of board of
directors. By studying on how different board of directors all over the world are influencing the reduction
of carbon emission, some board of directors from other can countries can copy to achieve the global
reduction of carbon emission. Apart from the board directors, we have the board responsible. These could
be the people among the board of directors who are specifically have the role of ensuring that the release
of carbon. They may come up with specific implementations which will ensure that carbon emission is
reduced as much as possible. They are involved in the real action making the effective for the main goal.
From our test statistics, it is realized that there is no significant relationship between board responsible
and the carbon emission. This might have been contributed with some gaps which this particular study is
trying to address. Some countries across the world might have adopted the issue of board responsible for
carbon emission while some might have not, or they have adopt it in ways that it doesn’t work for them.
The government or the firm’s management may take the initiative to copy from the ones who have
adopted it and worked.
The incentives target, one of the policies adopted by some firms, encourage more the employees hence
they become aggressive to achieve the goal of the firm. If climate change by reducing emission of carbon
is one of the strategy, management incentive will help achieve this.
The standard deviation from the t-test analysis of carbon emission reduction we realized that the standard
deviation of the mean is very large. This means from the data that as much as many firms trying to reduce
the carbon emission, some are reducing it at a slower rate. The report can encourage the firms who have
reduce to reduce even more to zero emission as other too to continue reducing to level zero too.
⊘ This is a preview!⊘
Do you want full access?
Subscribe today to unlock all pages.
Trusted by 1+ million students worldwide
Limitations to the study
There are some challenges encountered during the collection and analysis of data. The data was collected
from a secondary source since it would have been very expensive to get such kinds of data at a primary
level. This made it very difficult to come up with the variables which specifically address our main
objective. Developing a sample size which would represent the whole massive of data was very difficult
to come up. Coming up with proper statistical tool for data analysis was not easy since the data we were
using was mixture qualitative and quantitative data. Cleaning data wasted a lot of time as sometimes, it
makes some vital values disappearing making the clerks start all over again.
Being limited by the number of countries to choose from did not offer the opportunity to study as much as
possible many countries. Comparison from many countries could bring good conclusion on what to be
done and what not to be done to reduce carbon emission
Further Research
More research need to be done to address some of the challenges we encountered so that they don’t be the
barriers to the future researchers. More research should be conducted frequently on the issue of climate
change to see the progress and adoption of different types of carbon emission reduction strategies of
different firms all over the world. This will enable evaluation of the progress of carbon emission
reduction. To avoid struggling in choosing the proper tool for statistical analysis, the researcher can do
research on climate change data which are quantitative to ease the choice of a statistical tool.
Paraphrase This Document
Need a fresh take? Get an instant paraphrase of this document with our AI Paraphraser
References
ADESIJI G.B., B. S. T. I., 2013. EFFECTS OF CLIMATE CHANGE ON POULTRY PRODUCTION. p.
6.
Andre J. C., M. M. L. J. P., 2005. From GICC, the French research programme on management and
impacts of climate change, to circle, a coordinated European initiative including Russia. p. 7.
Anon., n.d.
Ballou,b, 2015. exploring the strategic integration of sustainbility. 26(sustanable development ), pp. 265-
288.
Brönnimann, S., 2015. [Advances in Global Change Research] Climatic Changes Since 1700 Volume 55
|| Climatic Changes Since 1700. p. 155.
Brönnimann, S., 2015. [Advances in Global Change Research] Climatic Changes Since 1700 Volume 55
|| The Machinery: Mechanisms Behind Climatic Changes. p. 96.
Dongming Zhu, J. W. G., 2010. A generalized asymmetric Student- distribution with application to
financial econometrics.
I., D. L., 2012. CR AND OTHER SPACE CLIMATE FACTORS INFLUENCED ON THE EARTH'S
CLIMATE CHANGE. DORMAN LEV I., p. 11.
Lyamin, O. O., 2011. On the rate of convergence of the distributions of certain statistics to the Laplace
and student distributions.
MABE FRANKLIN NANTUI, S. D. B. O.-A. Y., 2012. ADAPTIVE CAPACITIES OF FARMERS TO
CLIMATE CHANGE ADAPTATION STRATEGIES AND THEIR EFFECTS ON RICE
PRODUCTION IN THE NORTHERN REGION OF GHANA. p. 9.
OGUNBAMERU B.O., M. S. I. Y., 2013. CAPACITY BUILDING FOR CLIMATE CHANGE
ADAPTATION: MODULES FOR AGRICULTURAL EXTENSION CURRICULUM
DEVELOPMENT. p. 6.
PANOV VIKTOR I., K. S. R., 2011. CLIMATE CHANGE AND THE ECOLOGICAL PSYCHOLOGY.
p. 12.
Taeger, D. K. S., 2014. Statistical Hypothesis Testing with SAS and R (Taeger/Statistical Hypothesis
Testing with SAS and R) || Statistical hypothesis testing. p. 14.
Taeger, D. K. S., 2014. Statistical Hypothesis Testing with SAS and R (Taeger/Statistical Hypothesis
Testing with SAS and R) || Tests on the Mean. p. 17.
Taeger, D. K. S., 2014. Statistical Hypothesis Testing with SAS and R (Taeger/Statistical Hypothesis
Testing with SAS and R) || Tests on the variance. p. 12.
Wiley, 2011. british journal of management. What Makes Better Boards? A Closer Look at Diversity and
Ownership.

⊘ This is a preview!⊘
Do you want full access?
Subscribe today to unlock all pages.
Trusted by 1+ million students worldwide
1 out of 9
Related Documents


Your All-in-One AI-Powered Toolkit for Academic Success.
+13062052269
info@desklib.com
Available 24*7 on WhatsApp / Email
![[object Object]](/_next/static/media/star-bottom.7253800d.svg)
Unlock your academic potential
Copyright © 2020–2026 A2Z Services. All Rights Reserved. Developed and managed by ZUCOL.