Data Analysis: Sociodemographic, Health, and Lifestyle in the UK

Verified

Added on  2023/06/17

|29
|5419
|210
Report
AI Summary
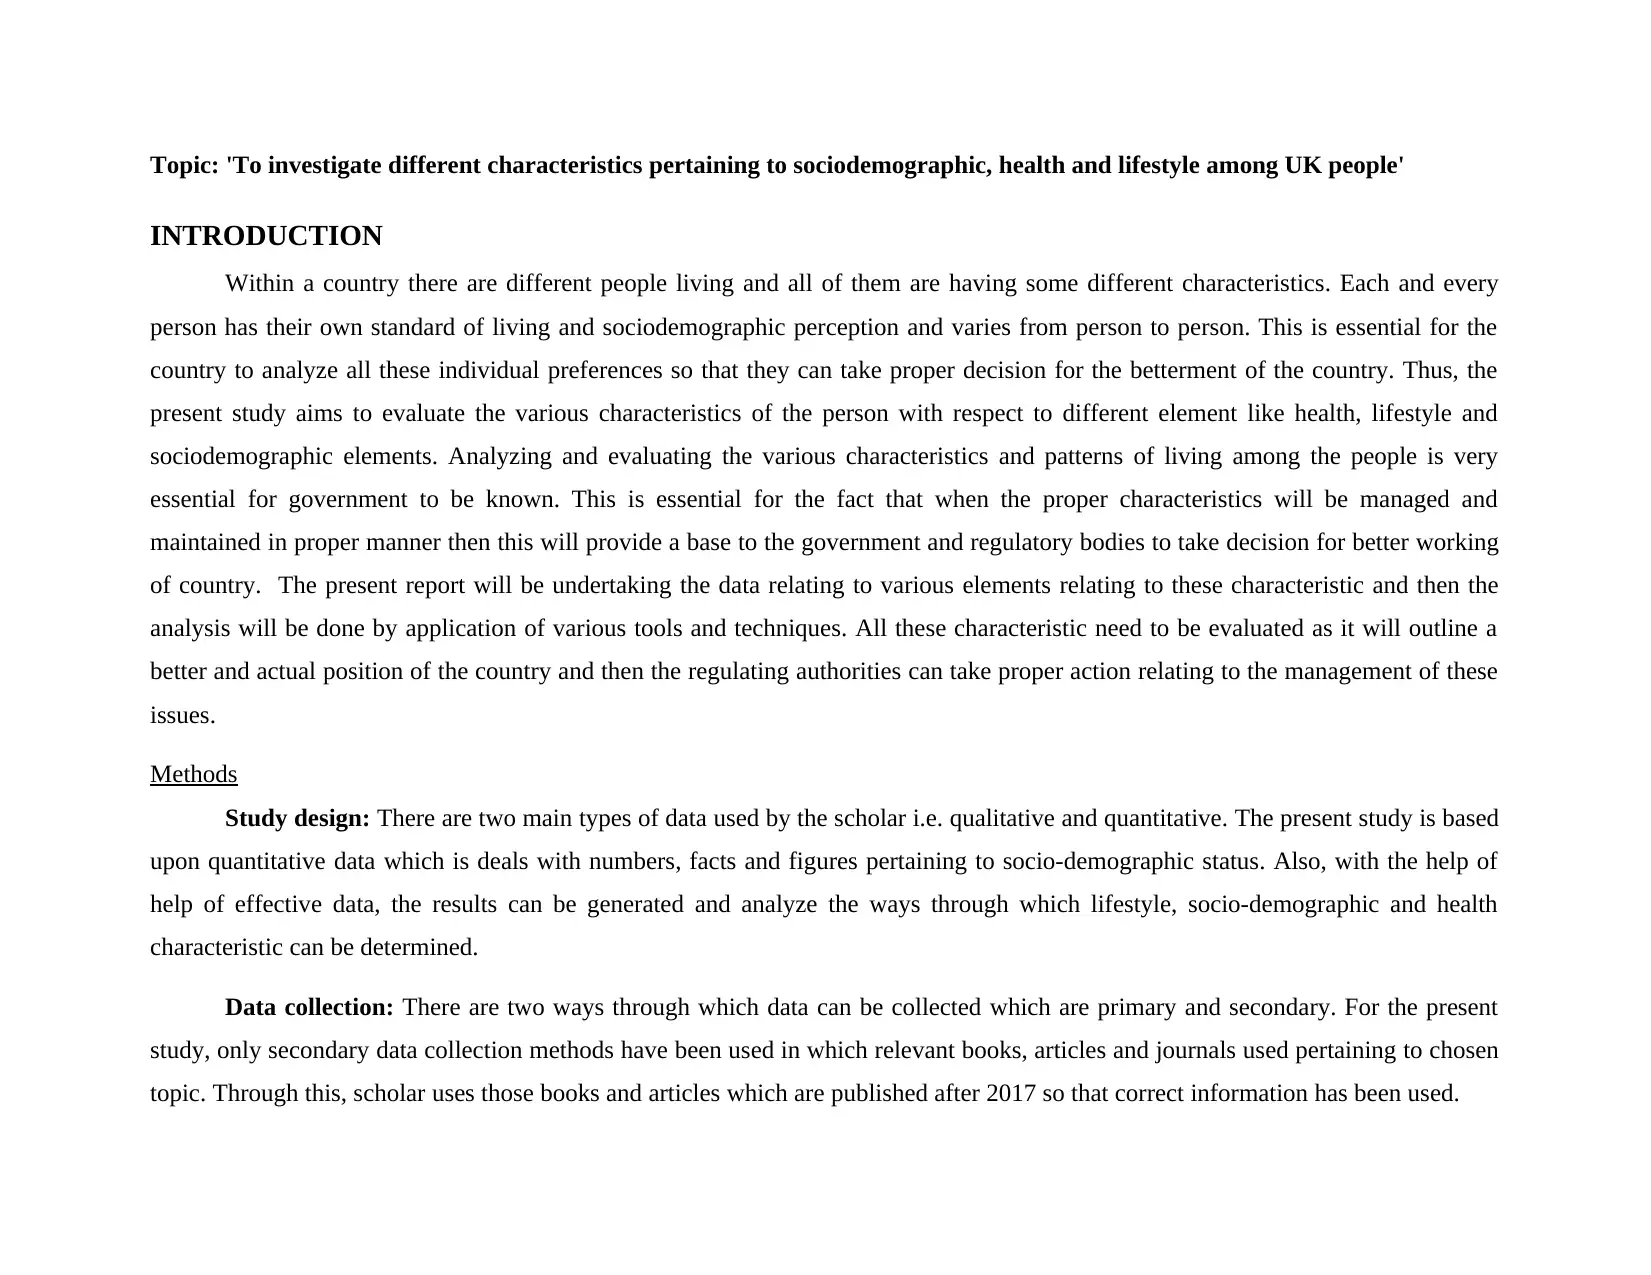
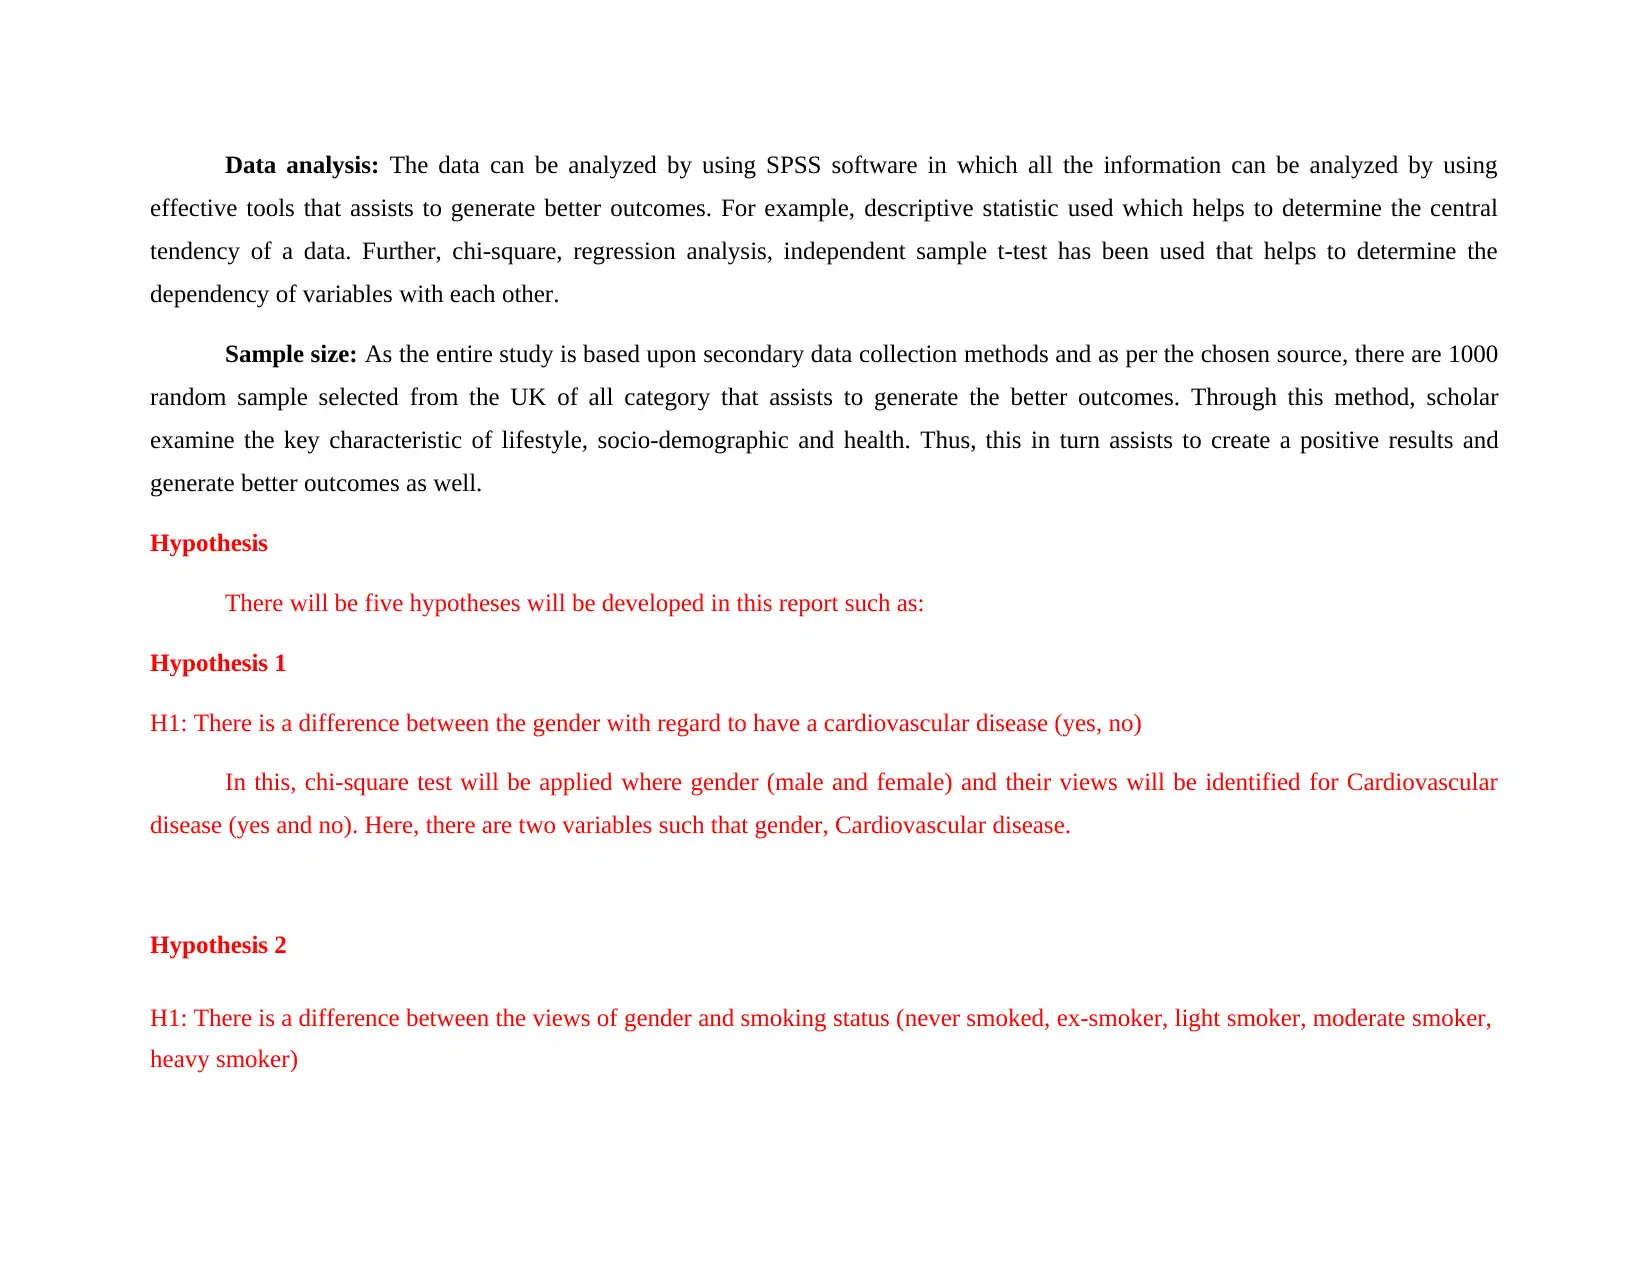
This report investigates sociodemographic, health, and lifestyle characteristics among UK residents using quantitative data and statistical analysis techniques such as descriptive statistics, chi-square tests, t-tests, correlation, and regression analysis. The study utilizes secondary data from a sample of 1000 individuals to explore relationships between variables like gender, cardiovascular disease, smoking status, BMI, and blood pressure. Key findings include insights into marital status, smoking habits, cardiovascular conditions, and the interplay between BMI and blood pressure. The analysis provides a comprehensive overview of the health and lifestyle factors influencing the UK population, offering valuable information for policymakers and healthcare professionals. Desklib provides access to this report and a wealth of similar academic resources for students.
Document Page
Data analysis and Interpretation
tabler-icon-diamond-filled.svg

Paraphrase This Document

Need a fresh take? Get an instant paraphrase of this document with our AI Paraphraser
Document Page
TABLE OF CONTENTS
INTRODUCTION.......................................................................................................................................................................................3
Methods...................................................................................................................................................................................................3
Results......................................................................................................................................................................................................4
Discussion..............................................................................................................................................................................................17
CONCLUSION..........................................................................................................................................................................................19
Recommendations..................................................................................................................................................................................19
REFERENCES..........................................................................................................................................................................................21
Document Page
Topic: 'To investigate different characteristics pertaining to sociodemographic, health and lifestyle among UK people'
INTRODUCTION
Within a country there are different people living and all of them are having some different characteristics. Each and every
person has their own standard of living and sociodemographic perception and varies from person to person. This is essential for the
country to analyze all these individual preferences so that they can take proper decision for the betterment of the country. Thus, the
present study aims to evaluate the various characteristics of the person with respect to different element like health, lifestyle and
sociodemographic elements. Analyzing and evaluating the various characteristics and patterns of living among the people is very
essential for government to be known. This is essential for the fact that when the proper characteristics will be managed and
maintained in proper manner then this will provide a base to the government and regulatory bodies to take decision for better working
of country. The present report will be undertaking the data relating to various elements relating to these characteristic and then the
analysis will be done by application of various tools and techniques. All these characteristic need to be evaluated as it will outline a
better and actual position of the country and then the regulating authorities can take proper action relating to the management of these
issues.
Methods
Study design: There are two main types of data used by the scholar i.e. qualitative and quantitative. The present study is based
upon quantitative data which is deals with numbers, facts and figures pertaining to socio-demographic status. Also, with the help of
help of effective data, the results can be generated and analyze the ways through which lifestyle, socio-demographic and health
characteristic can be determined.
Data collection: There are two ways through which data can be collected which are primary and secondary. For the present
study, only secondary data collection methods have been used in which relevant books, articles and journals used pertaining to chosen
topic. Through this, scholar uses those books and articles which are published after 2017 so that correct information has been used.
Document Page
Data analysis: The data can be analyzed by using SPSS software in which all the information can be analyzed by using
effective tools that assists to generate better outcomes. For example, descriptive statistic used which helps to determine the central
tendency of a data. Further, chi-square, regression analysis, independent sample t-test has been used that helps to determine the
dependency of variables with each other.
Sample size: As the entire study is based upon secondary data collection methods and as per the chosen source, there are 1000
random sample selected from the UK of all category that assists to generate the better outcomes. Through this method, scholar
examine the key characteristic of lifestyle, socio-demographic and health. Thus, this in turn assists to create a positive results and
generate better outcomes as well.
Hypothesis
There will be five hypotheses will be developed in this report such as:
Hypothesis 1
H1: There is a difference between the gender with regard to have a cardiovascular disease (yes, no)
In this, chi-square test will be applied where gender (male and female) and their views will be identified for Cardiovascular
disease (yes and no). Here, there are two variables such that gender, Cardiovascular disease.
Hypothesis 2
H1: There is a difference between the views of gender and smoking status (never smoked, ex-smoker, light smoker, moderate smoker,
heavy smoker)
tabler-icon-diamond-filled.svg

Paraphrase This Document

Need a fresh take? Get an instant paraphrase of this document with our AI Paraphraser
Document Page
In this, chi-square test will be applicable because it will help to examine the views of gender (male and female) pertaining to
smoking status (never smoked, ex-smoker, light smoker, moderate smoker, heavy smoker). So, there are two variables such that
gender, smoking status
Hypothesis 3
H1: There is a significant difference between the mean value of gender and BMI
In this, t-test will be determine because the group of means will be identified and for that BMI is considered as an independent
variable and gender (male and female) is another variable.
Hypothesis 4
H1: There is significant relation being present in BMI and BP
Here, correlation tool will be applied in order to identify the association between both variable such that BMI and BP and these are
two variables used for the same.
Hypothesis 5:
H1: There is a statistical relationship present in the BP and gender and BMI
Under this hypothesis, regression as an inferential tool will be applied which helps to examine the impact of independent variable
upon dependent. In this, BP and BMI are considered as an independent variable and gender as dependent.
Results
Descriptive statistics
Document Page
Sta
tisti
cs
Ma
rita
l
stat
us
Hou
seho
ld
tenu
re
No.
of
bed
roo
ms
in
hou
seh
old
Wh
eth
er
nor
mal
ly
has
acc
ess
to
car
NC
AR
S
No.
car
s
ava
ilab
le
for
use
W
het
her
rec
eiv
es
inc
om
e
sup
por
t
W
het
her
rec
eiv
es
ho
usi
ng
be
nef
it
No.
pers
ons
in
hou
seh
old
Age
of
you
nge
st
chil
d in
hou
seh
old
Sta
te
of
ge
ner
al
he
alt
h
Syst
olic
BP
(me
an
2nd/
3rd)
Dia
stoli
c
BP
(me
an
2nd/
3rd)
Age
in
year
s
Alch
ol
cons
umpt
ion
grou
ped
(unit
s) -
men
Alco
hol
cons
umpt
ion
grou
pes
(units
)
wom
en
Chol
ester
ol
level
s -
grou
ped
Ext
end
ed
sm
oki
ng
stat
us
Bo
dy
Ma
ss
Ind
ex
Eco
no
mic
acti
vity
stat
us
High
est
quali
ficati
on
attain
ed
(excl
FTS)
sm
oki
ng
stat
us
W
het
her
ma
le
or
fe
ma
le
N
Va
lid 998 996 100
0 998 799 99
3
24
1
100
0 299 99
9
100
0
100
0 999 456 543 838 998 968 993 997 99
8
99
5
Mi
ssi
ng
2 4 0 2 201 7 75
9 0 701 1 0 0 1 544 457 162 2 32 7 3 2 5
Mean
2.0
060
1
2.08
835
3.64
300
1.1
933
9
1.4
818
5
1.8
73
11
1.5
64
32
2.76
200
6.03
344
1.9
68
97
134.
468
00
74.2
970
0
46.7
937
9
4.673
25
3.937
38
2.10
621
3.8
286
6
25.
697
66
3.3
857
0
4.72
718
2.1
12
2
1.5
45
73
Median
1.0
000
0
2.00
000
3.00
000
1.0
000
0
1.0
000
0
2.0
00
00
2.0
00
00
2.00
000
5.00
000
2.0
00
00
131.
000
00
73.0
000
0
45.0
000
0
4.000
00
4.000
00
2.00
000
2.0
000
0
24.
964
80
2.0
000
0
5.00
000
2.0
00
0
2.0
00
00
Mode 1.0
00
1.00
0
3.00
0
1.0
00
1.0
00
2.0
00
2.0
00
2.00
0
.000
a
2.0
00
127.
000
66.0
00
47.0
00 4.000 4.000 2.00
0
1.0
00
21.
754
a
1.0
00
7.00
0
1.0
0
2.0
00
Document Page
Std.
Deviatio
n
1.4
127
82
1.55
444
7
8.62
844
1
.39
515
2
.64
061
3
.33
30
15
.49
68
78
1.37
595
4
4.88
583
3
.89
64
63
20.1
545
82
12.8
584
65
18.2
348
72
1.709
902
1.465
389
.928
474
3.4
434
39
4.6
098
59
2.5
406
53
2.23
3326
1.3
20
86
.49
81
55
Varianc
e
1.9
96
2.41
6
74.4
50
.15
6
.41
0
.11
1
.24
7
1.89
3
23.8
71
.80
4
406.
207
165.
340
332.
511 2.924 2.147 .862 11.
857
21.
251
6.4
55
4.98
8
1.7
45
.24
8
Skewne
ss
1.1
29
1.83
1
10.8
28
1.5
55
.98
5
-
2.2
45
-.2
61
1.04
1 .419 .89
7
1.00
0 .590 .269 -.015 .201 .515 .74
8
1.2
47
.40
2 -.248 .97
8
-.1
84
Std.
Error of
Skewne
ss
.07
7 .077 .077 .07
7
.08
6
.07
8
.15
7 .077 .141 .07
7 .077 .077 .077 .114 .105 .084 .07
7
.07
9
.07
8 .077 .07
7
.07
8
Kurtosis .12
3
3.30
5
117.
167
.41
9
-.1
31
3.0
48
-
1.9
48
2.56
7
-
1.17
1
.83
4
1.16
8 .738 -.91
8 .108 .595 -.56
9
-
1.1
46
2.9
43
-
1.5
77
-
1.27
7
-.2
95
-
1.9
70
Std.
Error of
Kurtosis
.15
5 .155 .155 .15
5
.17
3
.15
5
.31
2 .155 .281 .15
5 .155 .155 .155 .228 .209 .169 .15
5
.15
7
.15
5 .155 .15
5
.15
5
tabler-icon-diamond-filled.svg

Paraphrase This Document

Need a fresh take? Get an instant paraphrase of this document with our AI Paraphraser
Document Page
a.
Mu
ltipl
e
mo
des
exis
t.
The
sma
lles
t
val
ue
is
sho
wn
Socio-demographic information
Characteristic Number of mean n = 1000
Age Not applicable (46.79)
Gender Female: 448
Male: 540 (0.49)
Marital status Married (1.41)
Document Page
Interpretation: In accordance with the above table, it has been interpreted that there are three categories through which the
variables are chosen which are as mentioned below:
Socio-demographic characteristics of all the respondents are reflected that average of the people have cohabit according to
their marital status. Further, majority of them have the housing tenure is rent which indicted that selected respondents live in rented
house. Also, majority of them stated that there is no information available regarding how many people live in the house. Further, all
the selected respondents have the age limit 45 whereas the economic activity status depicts that they are working in undefined hours.
Moreover, majority of them are female as compared to males.
Lifestyle: The descriptive statistics clearly entails that all respondents have 3 bedrooms and they all have an access to car
which entails that their lifestyle is good. Also, majority of them have one cars and 50% of them also stated that they all have at least
one car. The table also entails that all of them have received the income support and that is why, they get enough health benefits as
well.
Health: As per the table, it has been identified that most of them have good health which indicated that they have strong
mental health. Further, as per the alcohol consumption rate, it has been identified that all the selected respondents have low alcohol
consumption rate and average people have cholesterol level less that indicated their health is good. Whereas, most of them have
undefined body mass index and their smoking status also reflected that majority of them are ex-smoker.
Frequencies:
Theme 1: Marital status of majority of the respondents is married
Marital status
Frequency Percent
Document Page
Valid
Married 604 60.4
Cohabiting 51 5.1
Single 173 17.3
Widowed 97 9.7
Divorced 49 4.9
Separated 24 2.4
Total 998 99.8
Missing Not answered 2 .2
Total 1000 100.0
tabler-icon-diamond-filled.svg

Paraphrase This Document

Need a fresh take? Get an instant paraphrase of this document with our AI Paraphraser
Document Page
Theme 2: Most of the respondents are never smoked
smoking status
Frequency Percent
Valid never smoked 456 45.6
ex smoker 249 24.9
Document Page
light smoker 107 10.7
moderate smoker 97 9.7
heavy smoker 89 8.9
Total 998 99.8
Missing no answer 2 .2
Total 1000 100.0
Theme 4: Respondents do not have any cardio-vascular condition
chevron_up_icon
1 out of 29
circle_padding
hide_on_mobile
zoom_out_icon
[object Object]