Data Manipulation and Statistical Management Report using SPSS
VerifiedAdded on 2021/01/02
|22
|4907
|368
Report
AI Summary
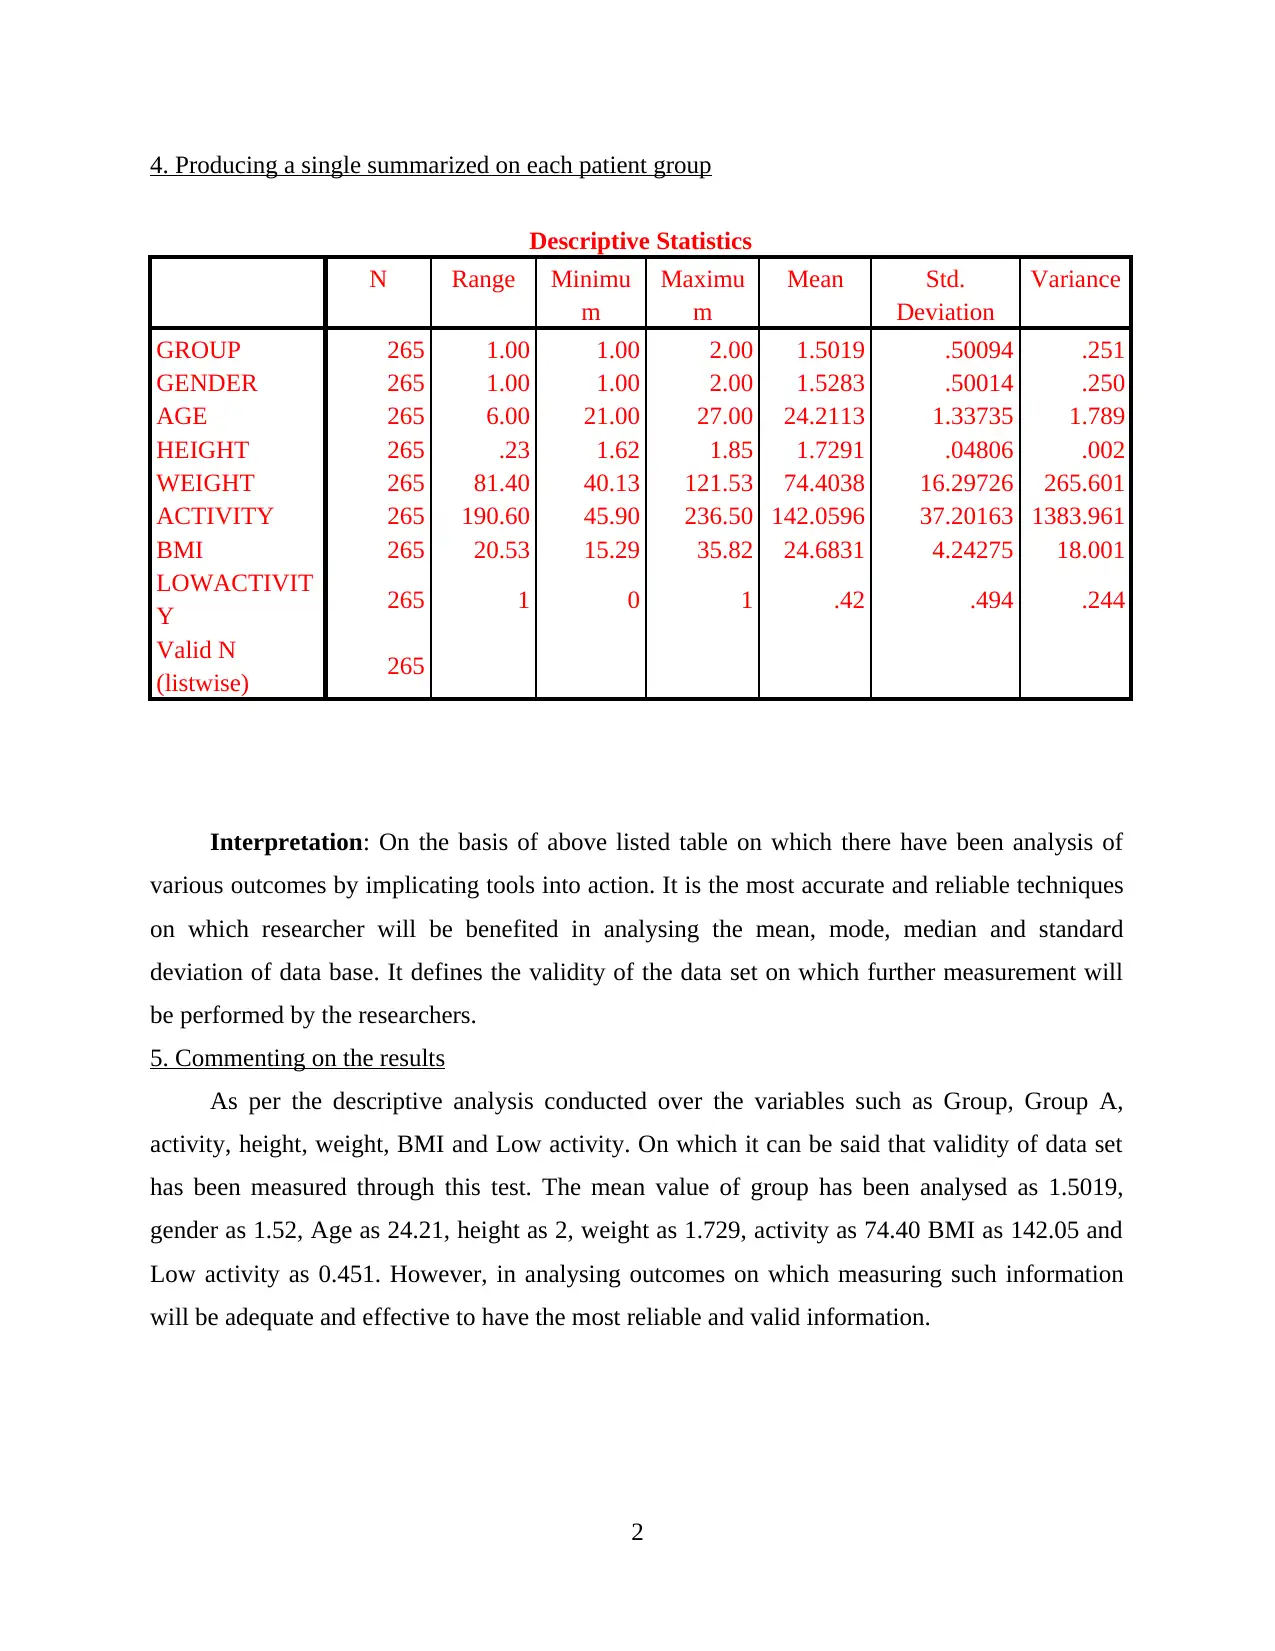
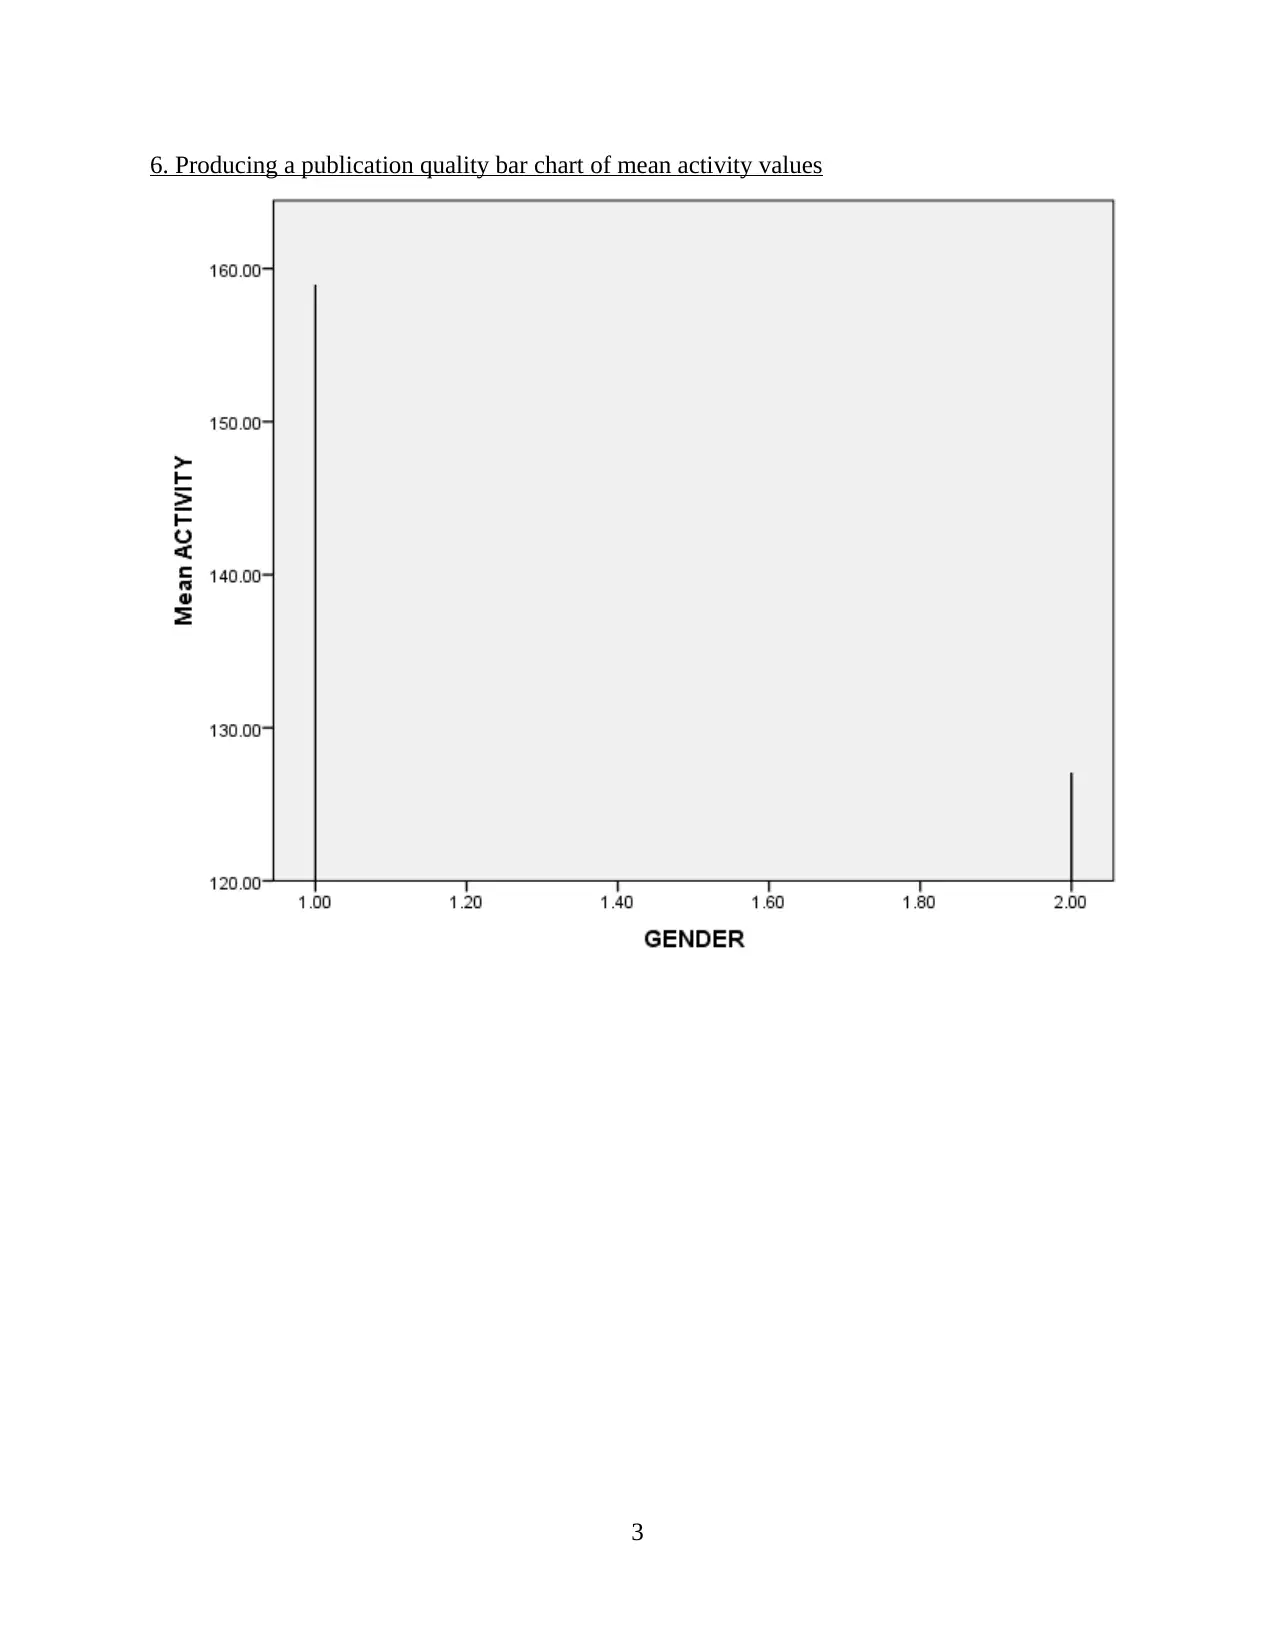
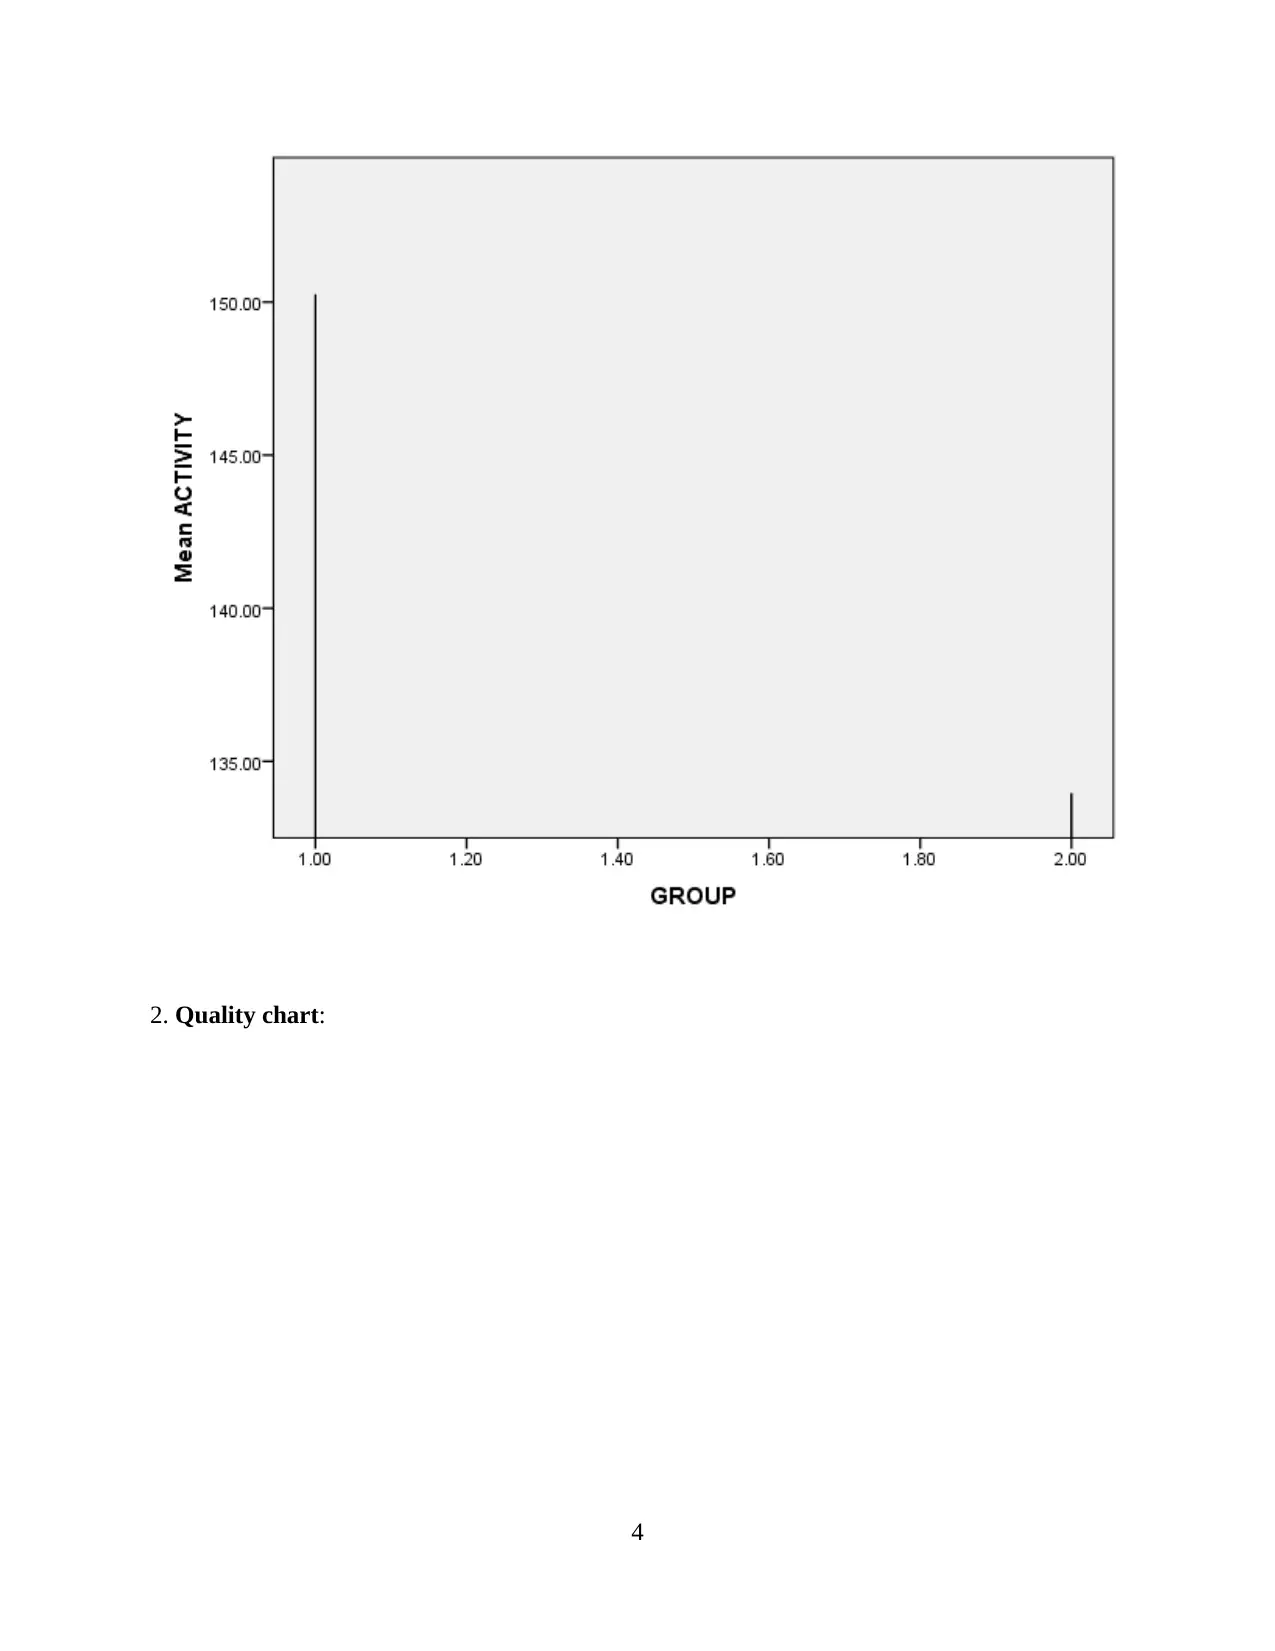
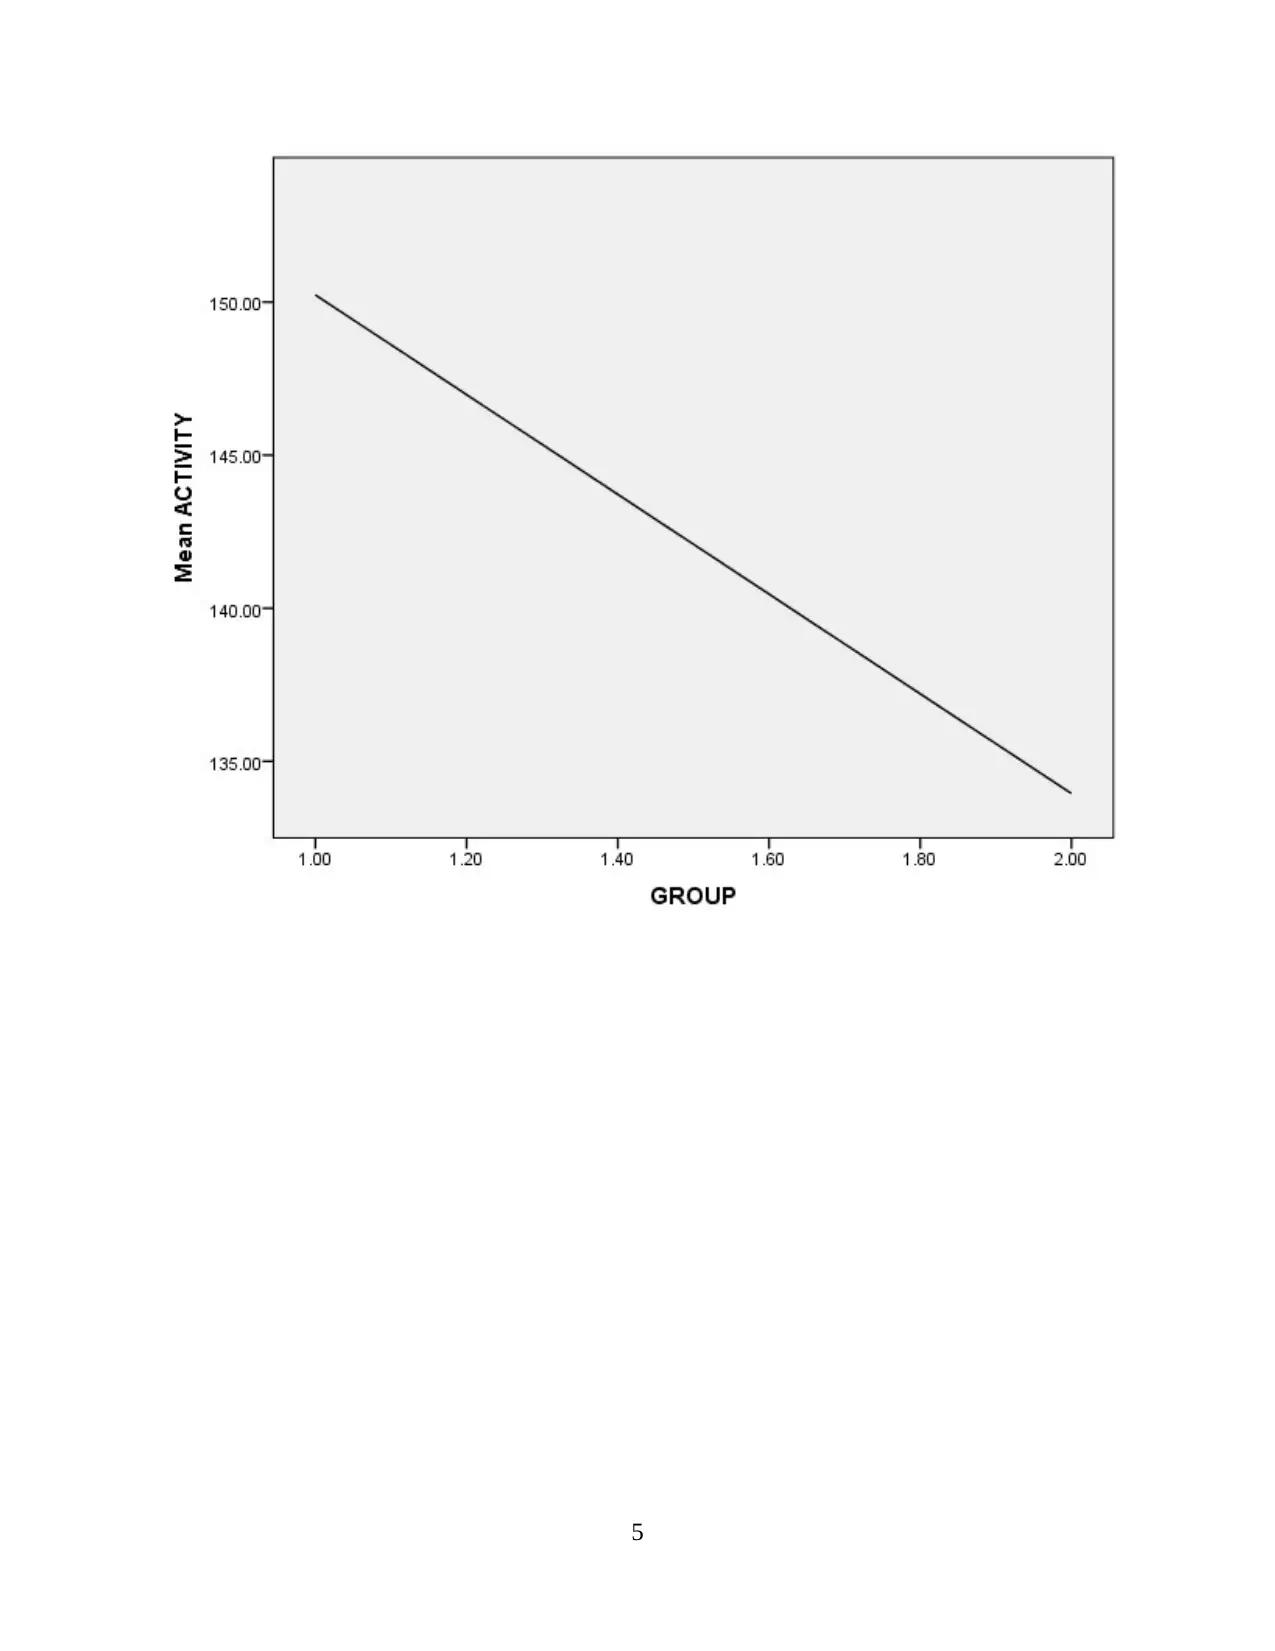
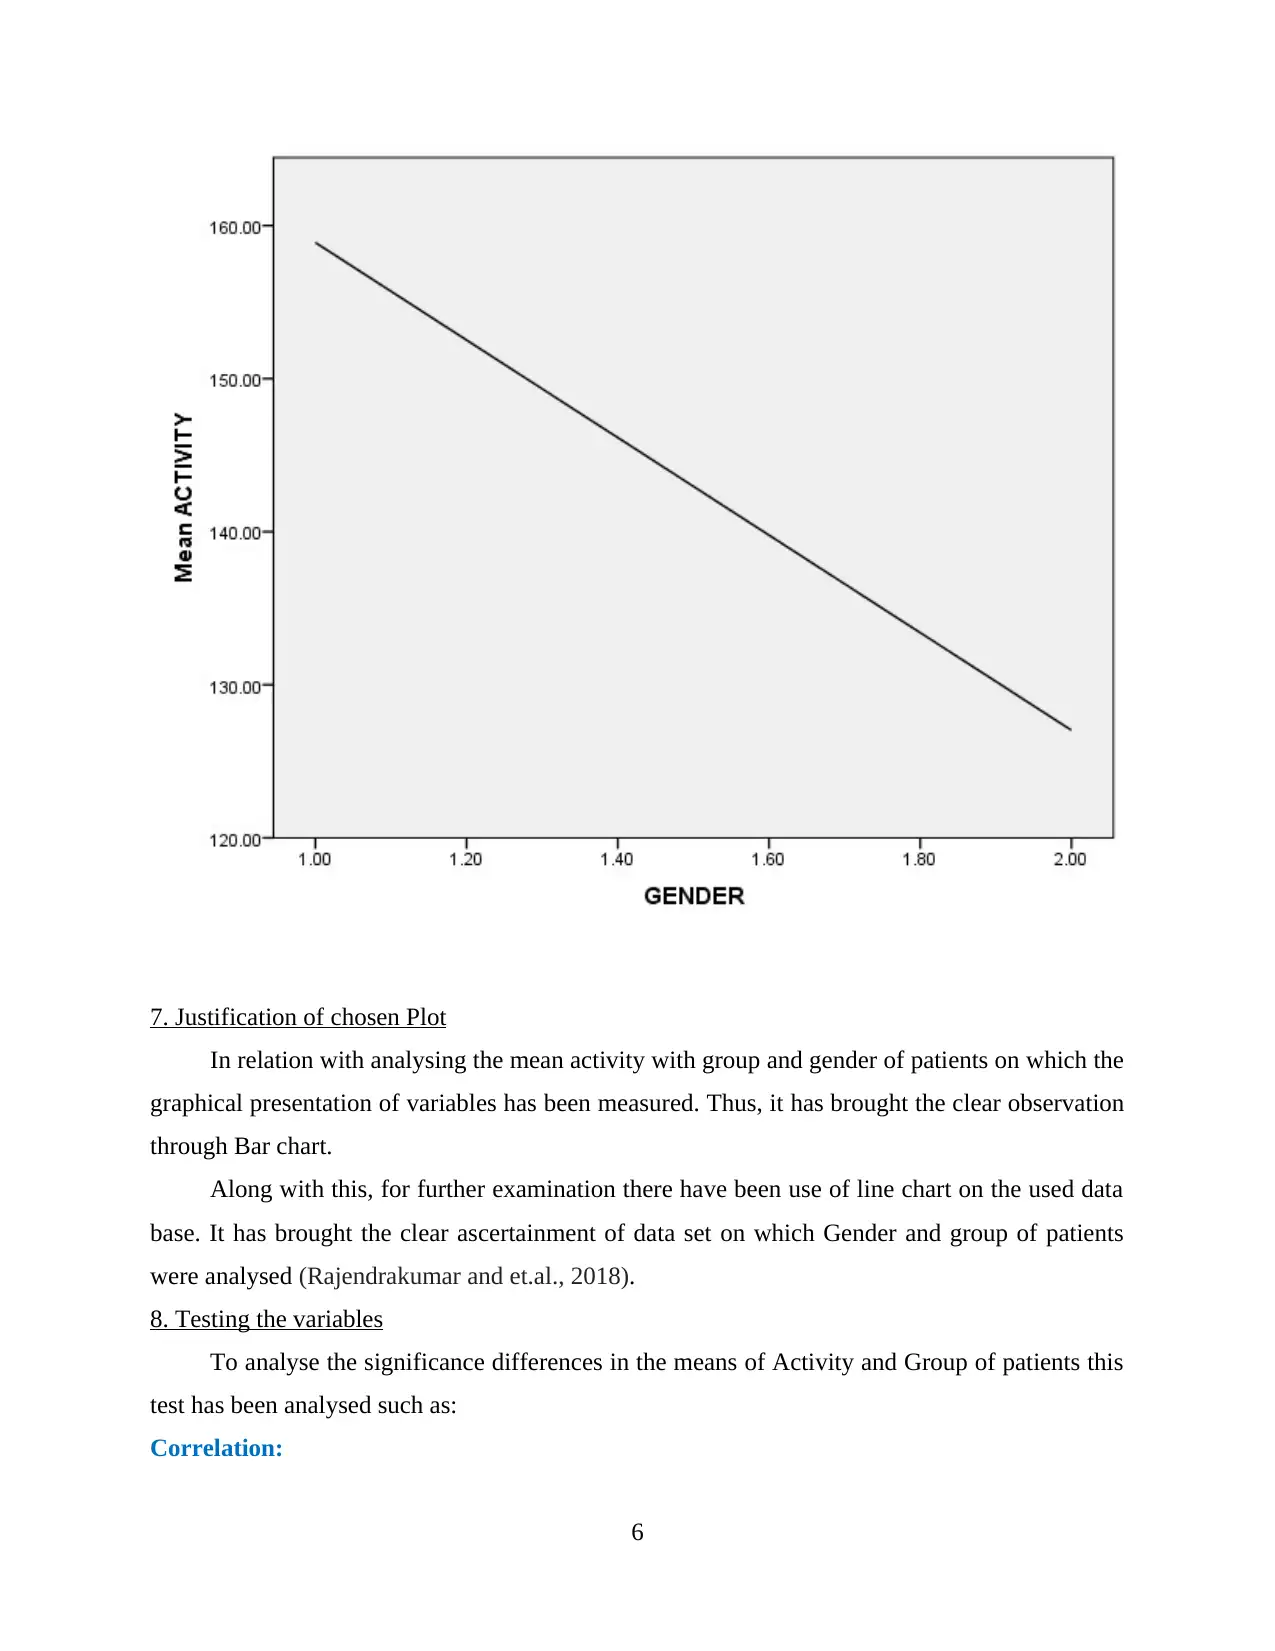
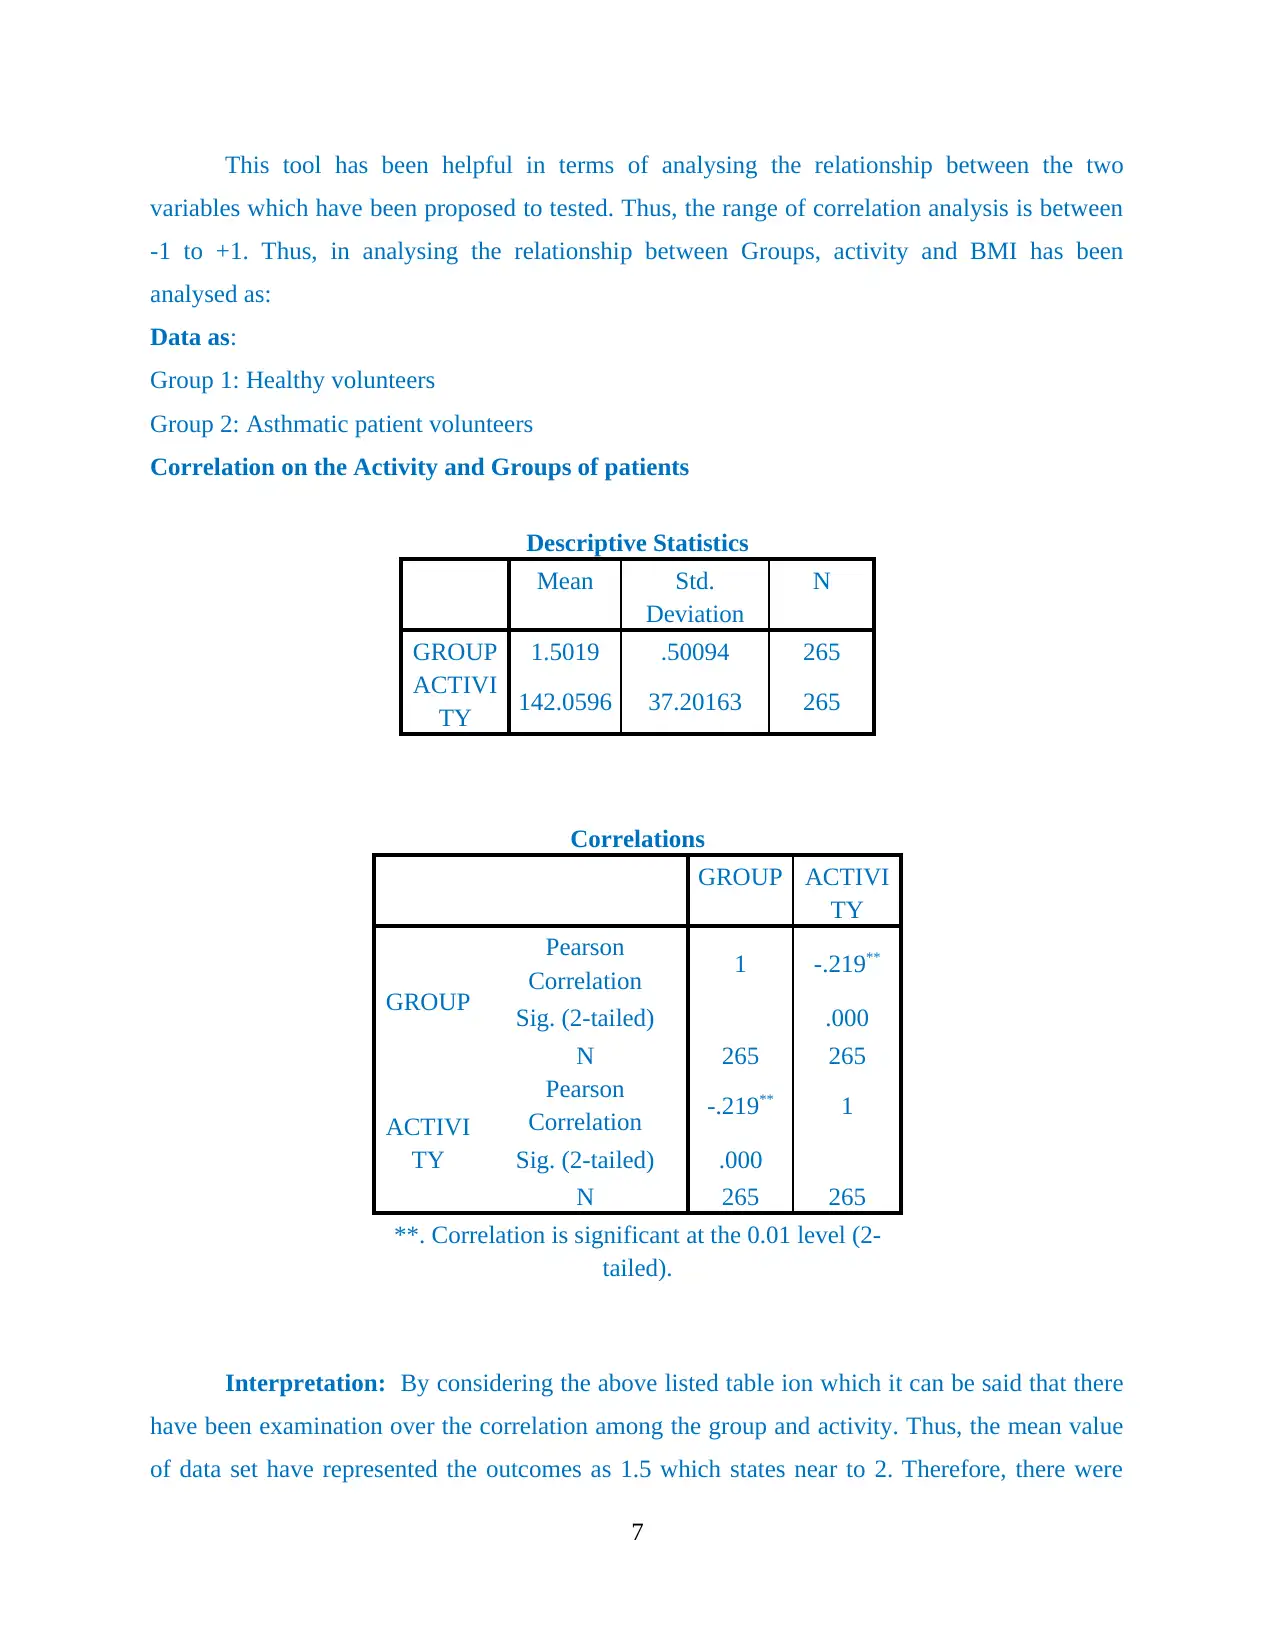
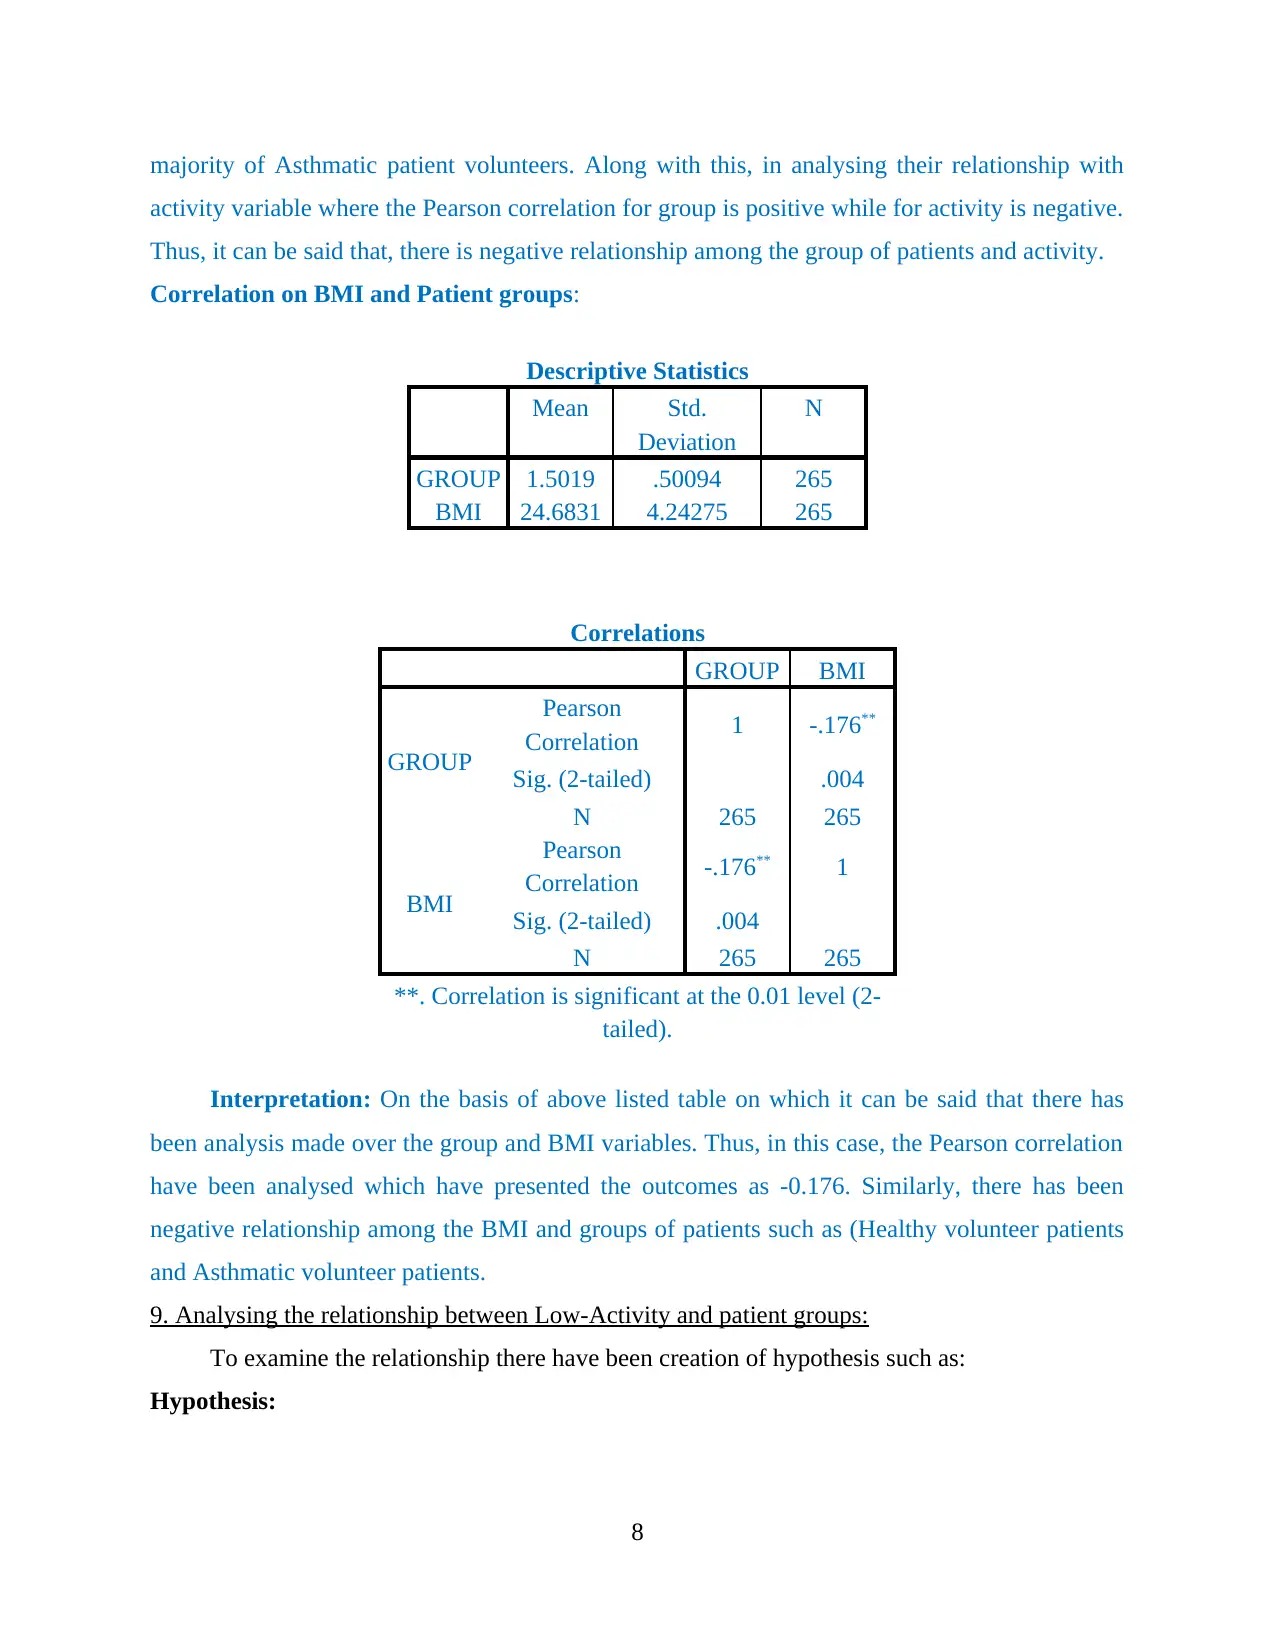
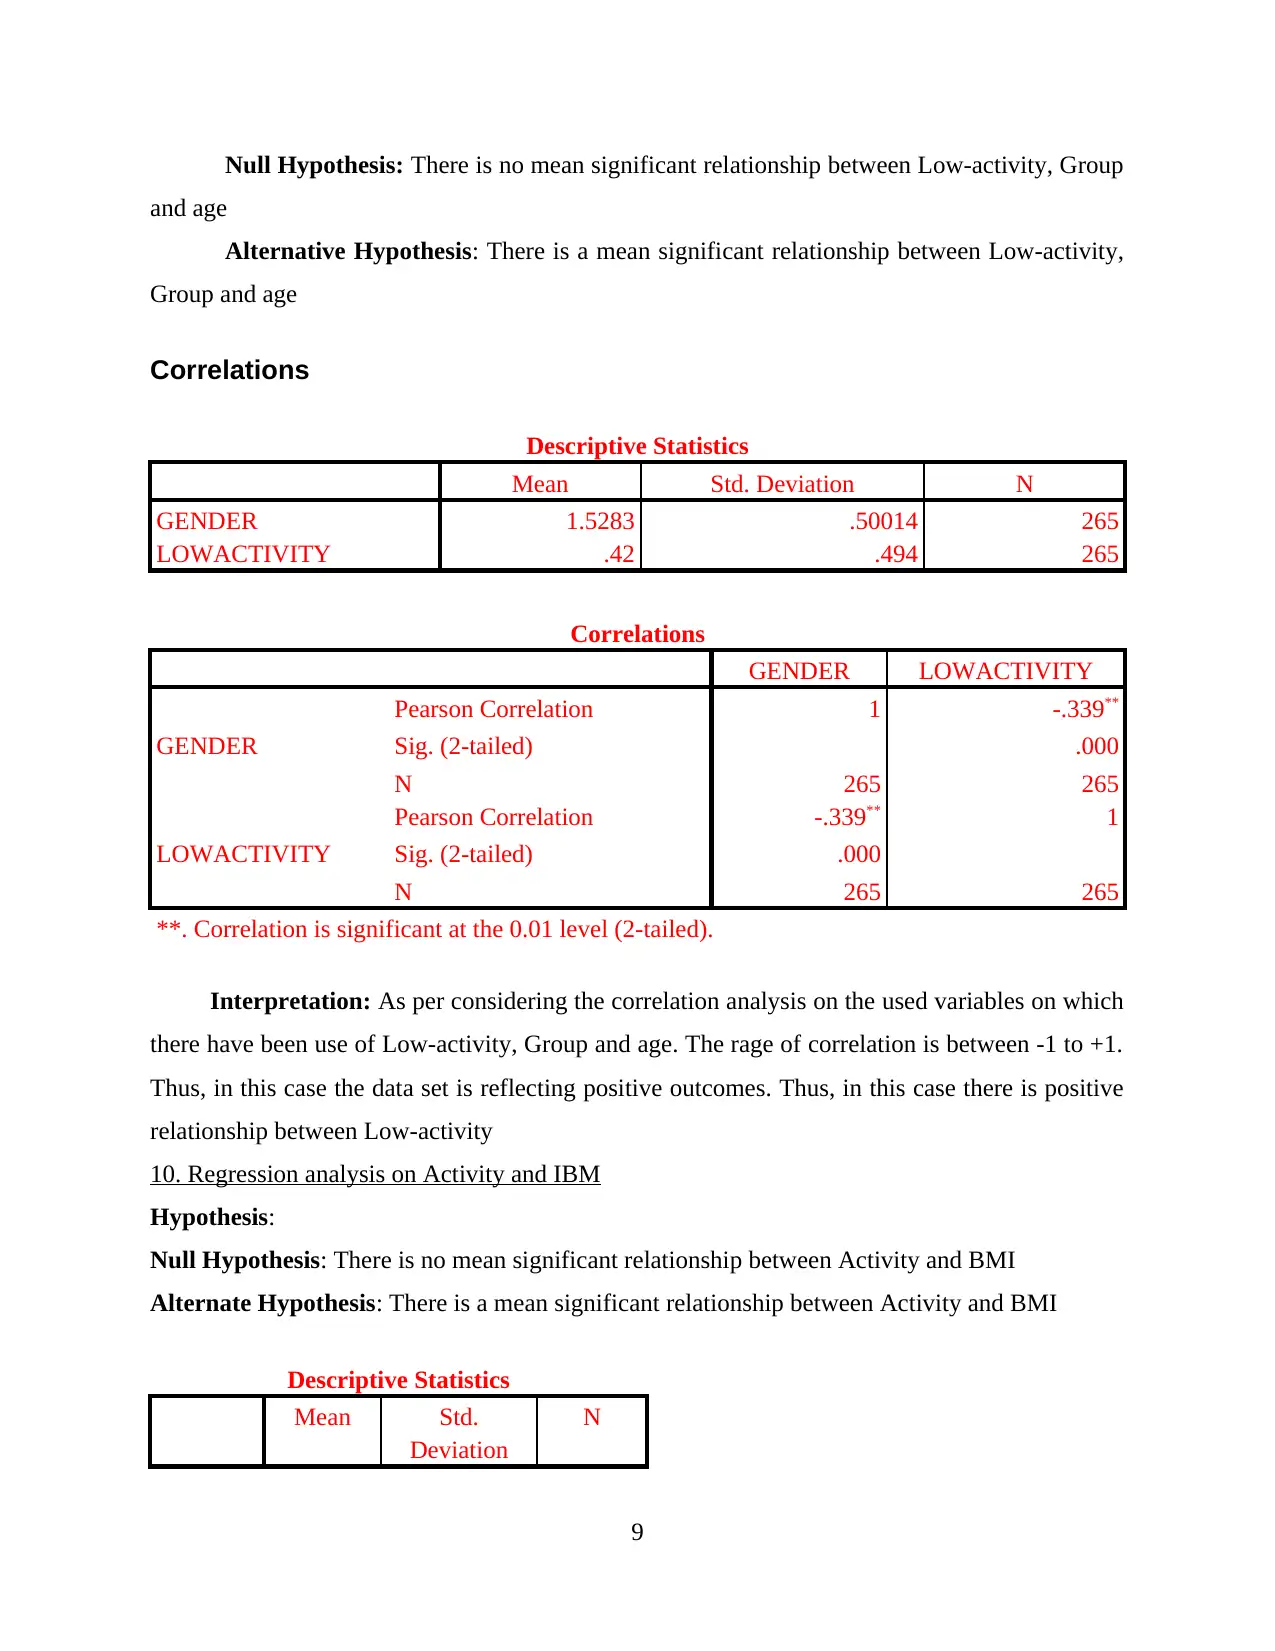
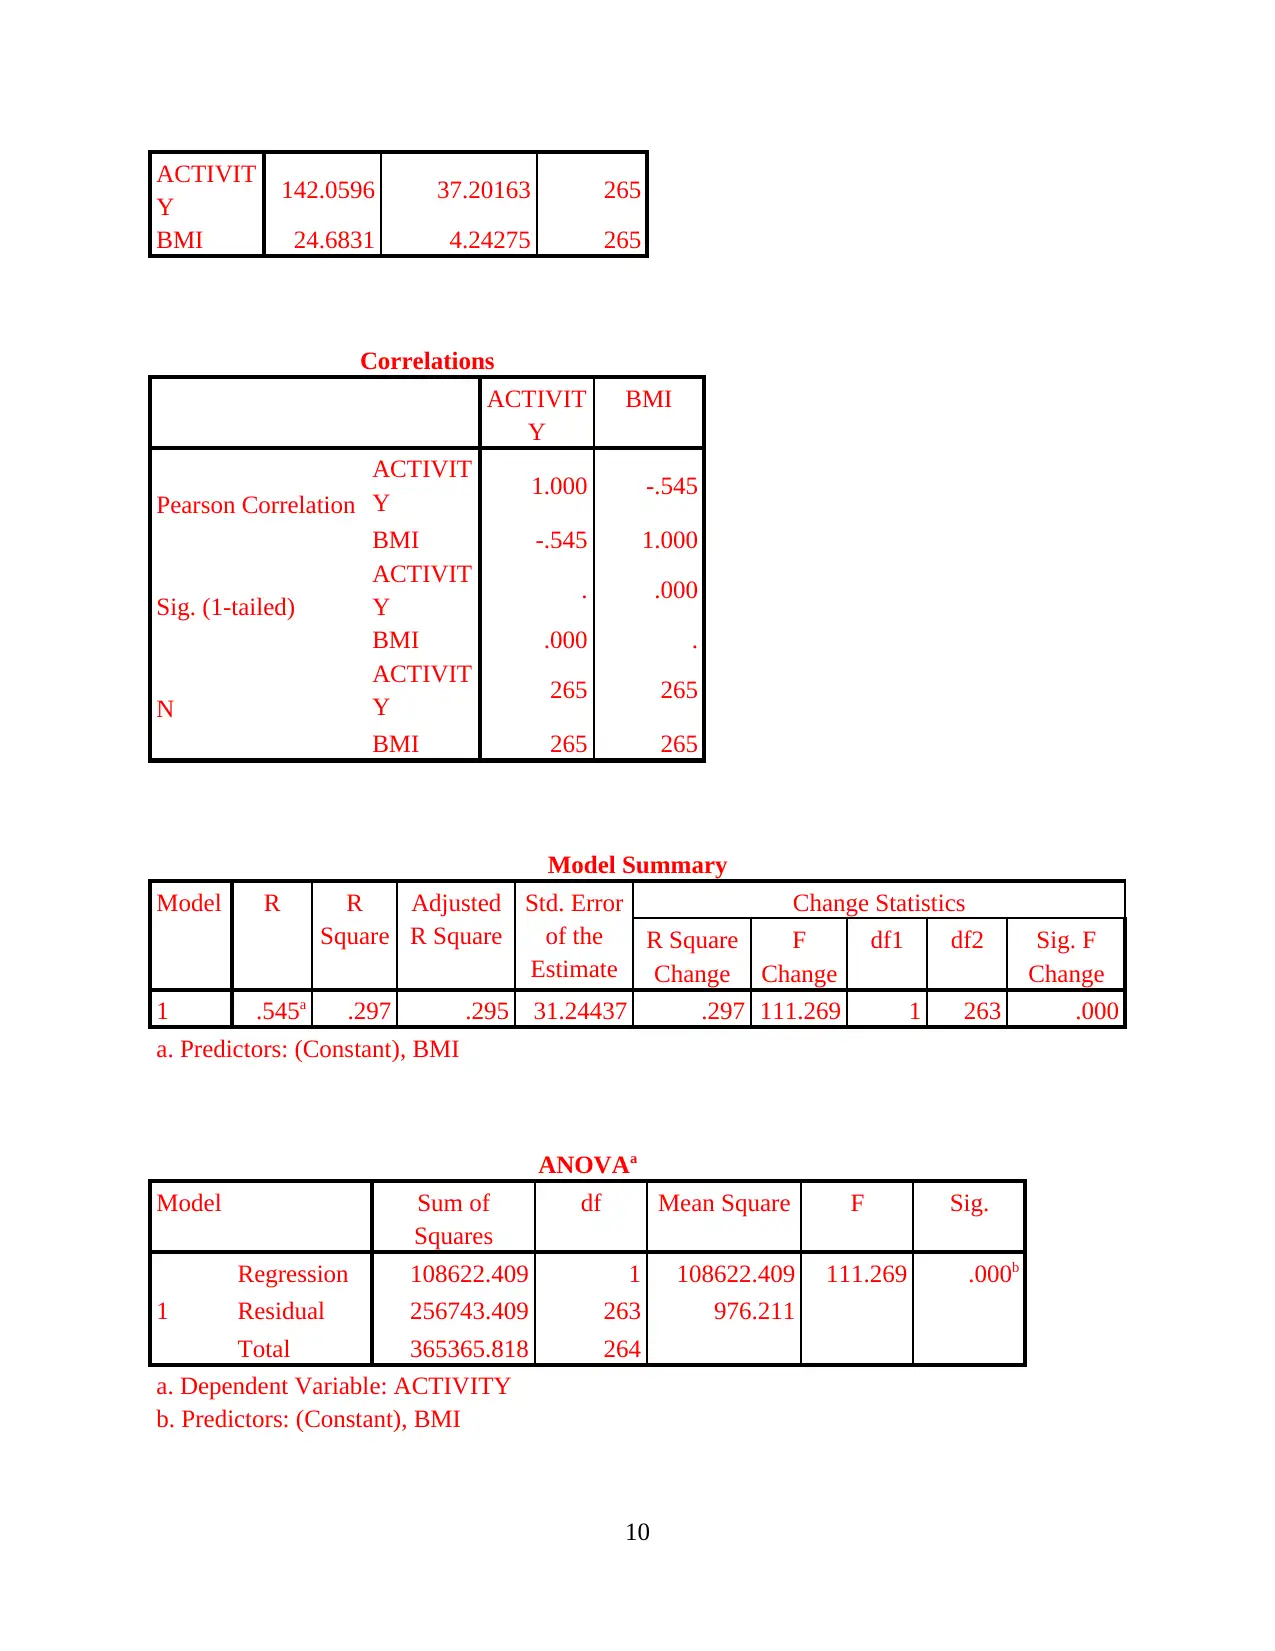
This report details the process of data manipulation and statistical analysis using SPSS. It begins with an introduction to the dataset, followed by calculations like BMI and the creation of new variables such as 'low activity'. The report then presents descriptive statistics, correlation analyses, and regression analyses to examine relationships between variables like patient group, activity levels, and BMI. Statistical methods used include descriptive statistics, t-tests, and regression analysis. The report concludes with a discussion of the findings, emphasizing the use of SPSS tools to derive accurate outcomes and test hypotheses. The analysis explores the relationship between various factors, drawing conclusions based on statistical significance and correlation values. The appendix includes the dataset used for the analysis.
1 out of 22
Related Documents


Your All-in-One AI-Powered Toolkit for Academic Success.
+13062052269
info@desklib.com
Available 24*7 on WhatsApp / Email
![[object Object]](/_next/static/media/star-bottom.7253800d.svg)
Copyright © 2020–2026 A2Z Services. All Rights Reserved. Developed and managed by ZUCOL.