Data Analysis: Humidity Forecasting with Descriptive Statistics

Verified

Added on  2023/06/14

|9
|1502
|142
Report
AI Summary
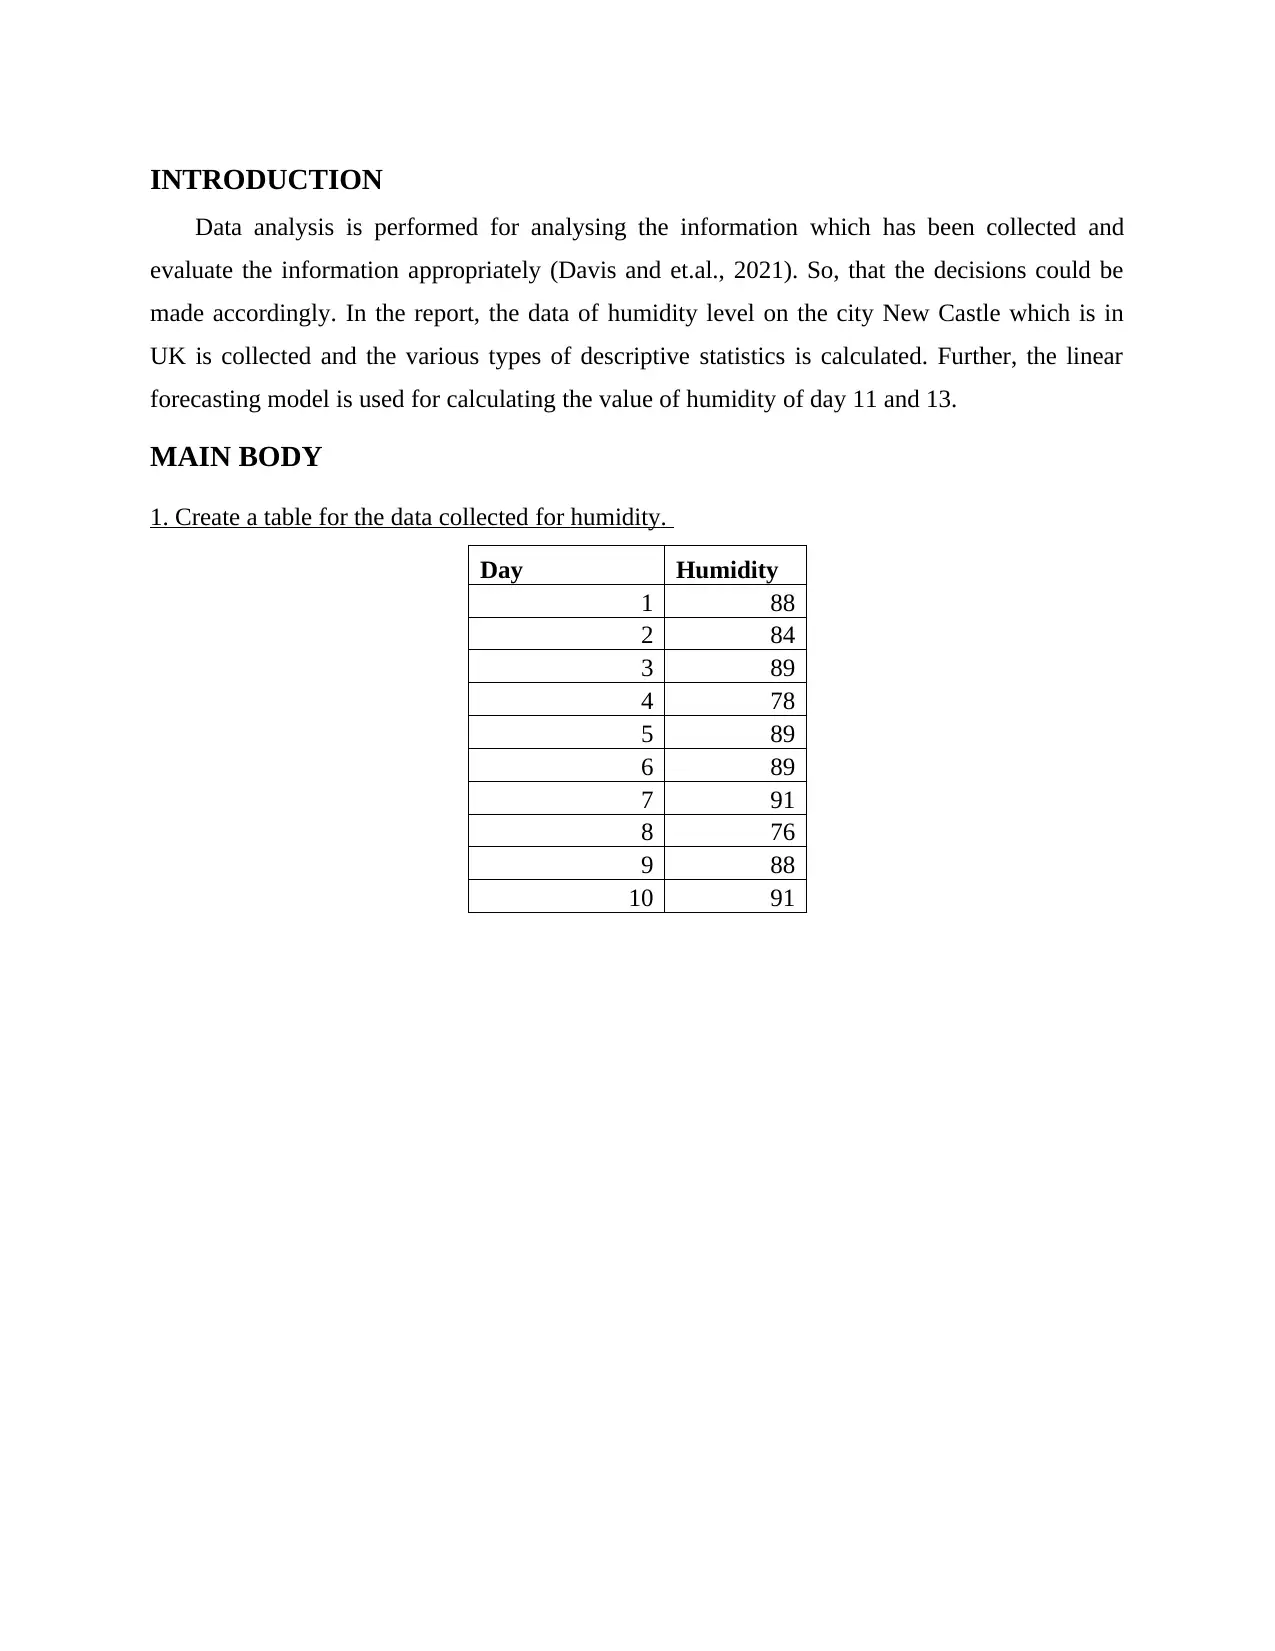
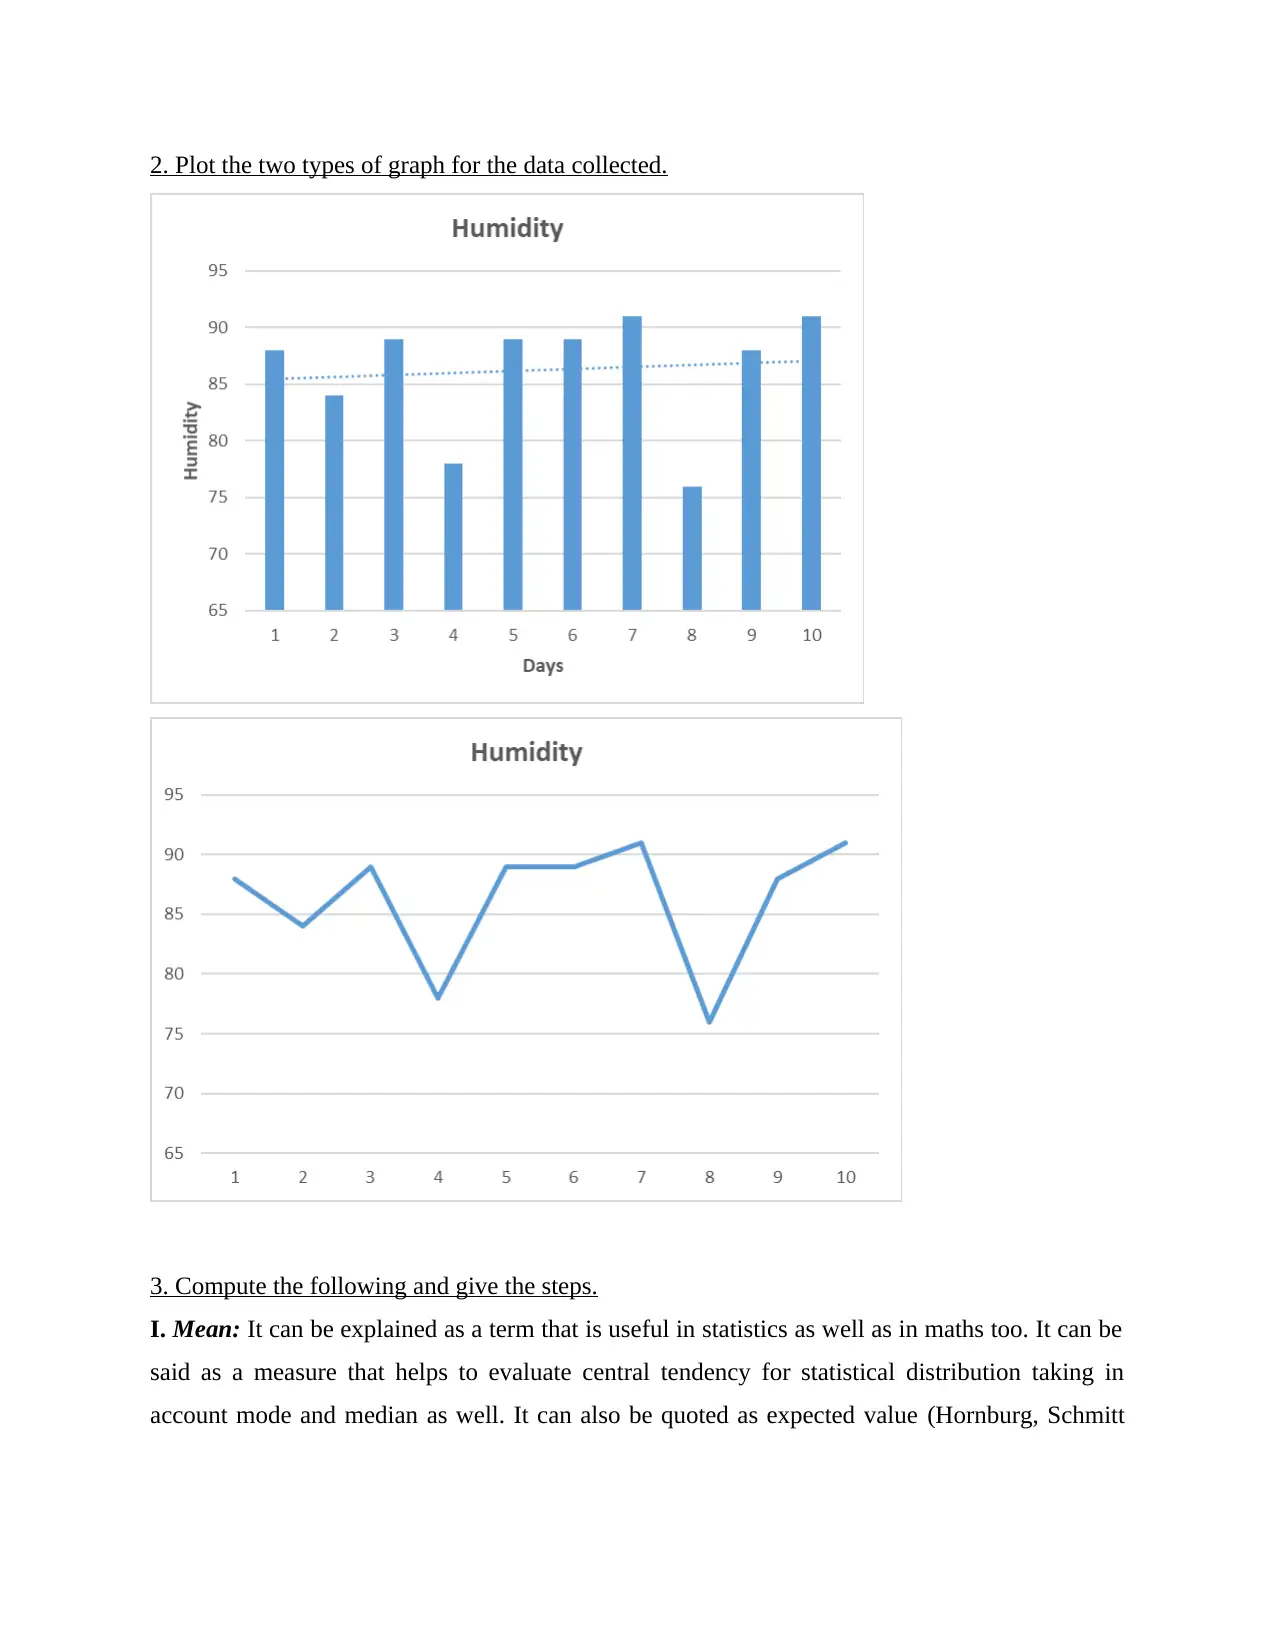
This report presents a data analysis of humidity levels in New Castle, UK, utilizing descriptive statistics and a linear forecasting model. The analysis includes calculating the mean, mode, median, range, and standard deviation of the collected humidity data over ten consecutive days. The report details the steps for computing each statistical measure. Furthermore, a linear forecasting model is applied to predict humidity levels for day 11 and day 13, providing a comprehensive overview of humidity trends based on the provided dataset. Desklib provides a platform for students to access this and other solved assignments.
Document Page
Data Analysis
tabler-icon-diamond-filled.svg

Paraphrase This Document

Need a fresh take? Get an instant paraphrase of this document with our AI Paraphraser
Document Page
Table of Contents
INTRODUCTION...........................................................................................................................3
MAIN BODY...................................................................................................................................3
1. Create a table for the data collected for humidity..............................................................3
2. Plot the two types of graph for the data collected..............................................................4
3. Compute the following and give the steps.........................................................................4
4. Calculate the values using the linear forecasting model....................................................6
CONCLUSION:...............................................................................................................................8
REFERENCES................................................................................................................................9
Document Page
INTRODUCTION
Data analysis is performed for analysing the information which has been collected and
evaluate the information appropriately (Davis and et.al., 2021). So, that the decisions could be
made accordingly. In the report, the data of humidity level on the city New Castle which is in
UK is collected and the various types of descriptive statistics is calculated. Further, the linear
forecasting model is used for calculating the value of humidity of day 11 and 13.
MAIN BODY
1. Create a table for the data collected for humidity.
Day Humidity
1 88
2 84
3 89
4 78
5 89
6 89
7 91
8 76
9 88
10 91
Document Page
2. Plot the two types of graph for the data collected.
3. Compute the following and give the steps.
I. Mean: It can be explained as a term that is useful in statistics as well as in maths too. It can be
said as a measure that helps to evaluate central tendency for statistical distribution taking in
account mode and median as well. It can also be quoted as expected value (Hornburg, Schmitt
tabler-icon-diamond-filled.svg

Paraphrase This Document

Need a fresh take? Get an instant paraphrase of this document with our AI Paraphraser
Document Page
and Purpura, 2018). Thus, mean can be defined as a term that carries a broader meaning in areas
related to finance. It is applied and helpful in different finance related fields.
Steps to calculate Mean –
1. First step for calculating Mean is to add all the figures present in the series formed.
2. The result obtained after summation, afterwards is divided by total digits forming the
series.
Mean = Sum of individual terms / Total no. of days
= 863 / 10 = 86.3
II. Mode: It can be explained as a term that takes place on a frequent basis in a series. If there
are more than one value recorded in mode, then the highest value is chosen and given preference.
It helps to examine categorical data and provides guidance for measuring central tendency
(Fielding and Harbon, 2020). It contributes in finding ways that would contribute in improving
and maximising efficiency of an organisation and its working.
Steps for calculating mode –
Step 1 – Initially, Sort the data for understaffing it quickly and in a better manner.
Step 2 – Sorting of information in available series would help to find the frequent value
recorded.
Step 3 – Find out if there is only one term recorded of repetitive nature.
Step 4 –If more than one digit is recorded to recur then the figure possessing higher value would
be chosen.
Mode = The frequent term recorded in series given is 89.
III. Median: It is a method that contributes in finding mid value from the data laid skewed at a
higher degree. It helps to arrange data in ascending order first and then search for the term that
reflects the searched term. It also gives an opinion about how the distribution of data is
processed. It is helpful because it is a quick indicator of complex scores and help to understand
the working in case of nominal level variable. It helps to evaluate odd series and even series as
well.
Median = (n/2)
76, 78, 84, 88, 88, 89, 89, 89, 91, 91.
10/2 = 5th term
Median = 88.
Document Page
Steps for calculating median -
1. Sort the data and arrange the series in ascending order in first place.
2. After sorting count the terms that form a chain of value i.e. series.
3. In case of series having count as even number it simply demands to divide the series by 2
whereas in case of odd series the formula changes to (n+1/2).
IV. Range: It is the difference in the highest and the lowest value of humidity (Cadet and et.al.,
2021).
Steps of computing Range:
1. Firsly arrange the data in ascending order.
2. Then identify the lowest and the greatest number.
3. Then subtract the values.
Range = Maximum Value – minimum Value
= 91 - 76
= 15
V. Standard Deviation: It is the value which tell about the deviation of the data from the mean
value (Murphy, 2020). It can be ascertained by following the below steps:
1. Find out value of mean by applying formula as stated above
2. Square every digit and find its distance with relation to mean.
3. Find value by summation of result obtained from step 2.
4. After divide the term by number of values forming a series.
5. Find out square root and finally put the values calculated so far in the formula.
Standard Deviation= √ (xi – μ)2 / N
= √ (252.1) / 10
= √ 25.21
= 5.021
4. Calculate the values using the linear forecasting model.
a) Steps of computing the value of m.
1. The value of both the variable are multiplied.
Document Page
2. Then the sum of those multiplied variables is determined.
3. Then both the factors are summed individually.
4. Further, the value of m is computed.
m = [10 * 4761 – (55 * 863)] / [10 * 385 – (55)2]
= [47610 – 47465] / [3850 – 3025]
= 145 / 825
= 0.18
b) Compute the value of c by discussing is steps of computation.
1. The value of y is computed by totally the figure of the humidity of then consecutive
days.
2. Then the sum of x is done which is the day variable.
3. The value of x is multiple by the above computed value m.
4. Then the difference is found between the values of both the variables and divided by N,
the number of days.
= [863 – (0.18 * 55)] / 10
= [863 – 9.9] / 10
= 853.1 / 10
= 85.31
c) Forecast the humidity level on day 11 and 13 using the value of m and c.
Humidity of Day 11:
m = 0.18, c = 85.31, x= 11,
y = mx + c
y= 0.18 (11) + 85.31
y = 1.98 + 85.31
y = 87.29
tabler-icon-diamond-filled.svg

Paraphrase This Document

Need a fresh take? Get an instant paraphrase of this document with our AI Paraphraser
Document Page
Humidity level of Day 13:
m = 0.18, c = 85.31, x= 13,
y = mx + c
y= 0.18 (13) + 85.31
y = 2.34 + 85.31
y = 87.65
CONCLUSION:
From the above asserted computation and steps it can be said that the descriptive statistics is
computed by acknowledging the average of the variable or the data collected. In this report, the
humidity level is collected of the 10 days consecutively which helped in ascertaining the
forecasted level of humidity for day 11 and 13 using the linear forecasting model.
Document Page
REFERENCES
Books and Journals
Cadet, T. and et.al., 2021. Effects by educational attainment of a mammography screening
patient decision aid for women aged 75 years and older. Cancer. 127(23). pp.4455-
4463.
Davis, K.W. and et.al., 2021. Testing a best practices risk result format to communicate genetic
risks. Patient Education and Counseling. 104(5). pp.936-943.
Fielding, R. and Harbon, L., 2020. Dispelling the monolingual myth: exploring literacy outcomes
in Australian bilingual programmes. International Journal of Bilingual Education and
Bilingualism, pp.1-24.
Hornburg, C.B., Schmitt, S.A. and Purpura, D.J., 2018. Relations between preschoolers’
mathematical language understanding and specific numeracy skills. Journal of
experimental child psychology. 176. pp.84-100.
Murphy, S., 2020. Science education success in a rural Australian school: Practices and
arrangements contributing to high senior science enrolments and achievement in an
isolated rural school. Research in Science Education. pp.1-13.
chevron_up_icon
1 out of 9
circle_padding
hide_on_mobile
zoom_out_icon
[object Object]