Ask a question from expert
Analytical Tools for Healthcare Firms
21 Pages2934 Words250 Views
Added on 2020-07-22
About This Document
|> ssp742-read.table("D:TapanA41593 Data| |analysisdata.csv",header=T,sep=",") | |> ssp-read.table("D:TapanA41593 Data| |analysis |data.csv",header=T,sep=",") | |> str(ssp) | |'data.frame':11
Analytical Tools for Healthcare Firms
Added on 2020-07-22
BookmarkShareRelated Documents
DATA ANALYSIS
TABLE OF CONTENTS1INTRODUCTION.....................................................................................................................................................................................32Data setup..................................................................................................................................................................................................33Exploratory data analysis...........................................................................................................................................................................43.1One variable analysis..........................................................................................................................................................................43.2Two variable analysis.........................................................................................................................................................................64Advanced analysis.....................................................................................................................................................................................84.1 Cluster analysis..................................................................................................................................................................................84.2Linear regression..............................................................................................................................................................................155Conclusion...............................................................................................................................................................................................206Reflection.................................................................................................................................................................................................20REFERENCES..........................................................................................................................................................................................21
1INTRODUCTIONIn current time period analytic tools are used at large scale by the firms to solve business related problems. Currently,healthcare firms that are operating at international level are facing problems in identifying way in which physical resources must beallocated in proper manner across the nations so that best use of cash and optimum utilization can be made in the business. Healthcaresector firms like hospital chains cares about this problem. If resources will not be allocated in systematic way then in that case firmmay failed to cater needs of patients in systematic way. Data is taken from the World Bank website for analysis purpose and on sameanalysis is done by applying cluster analysis and regression analysis techniques.2Data setupIn order to load the data specific syntax is used in the R software. By using below given code data is imported from CSV sheetto R software for analysis purpose. Libraries that is needed is hclust. > ssp<-read.table("D:\\Tapan\\A41593 Data analysis\\data.csv",header=T,sep=",")> ssp<-read.table("D:\\Tapan\\A41593 Data analysis\\data.csv",header=T,sep=",")> str(ssp)'data.frame': 11 obs. of 4 variables:$ Countries : Factor w/ 11 levels "Cambodia","China",..: 1 2 4 5 7 8 9 10 11 3 ...$ Death.rate : num 6.22 7.16 7.16 10.1 4.87 ...$ Immunization : int 90 99 86 93 99 99 86 99 95 99 ...$ Mortality.by.road.injury: num 17.4 18.8 15.3 4.7 24 21 20.3 3.6 24.5 5.8 ...Dimensions for data set is given below.> dim(ssp)[1] 11 4
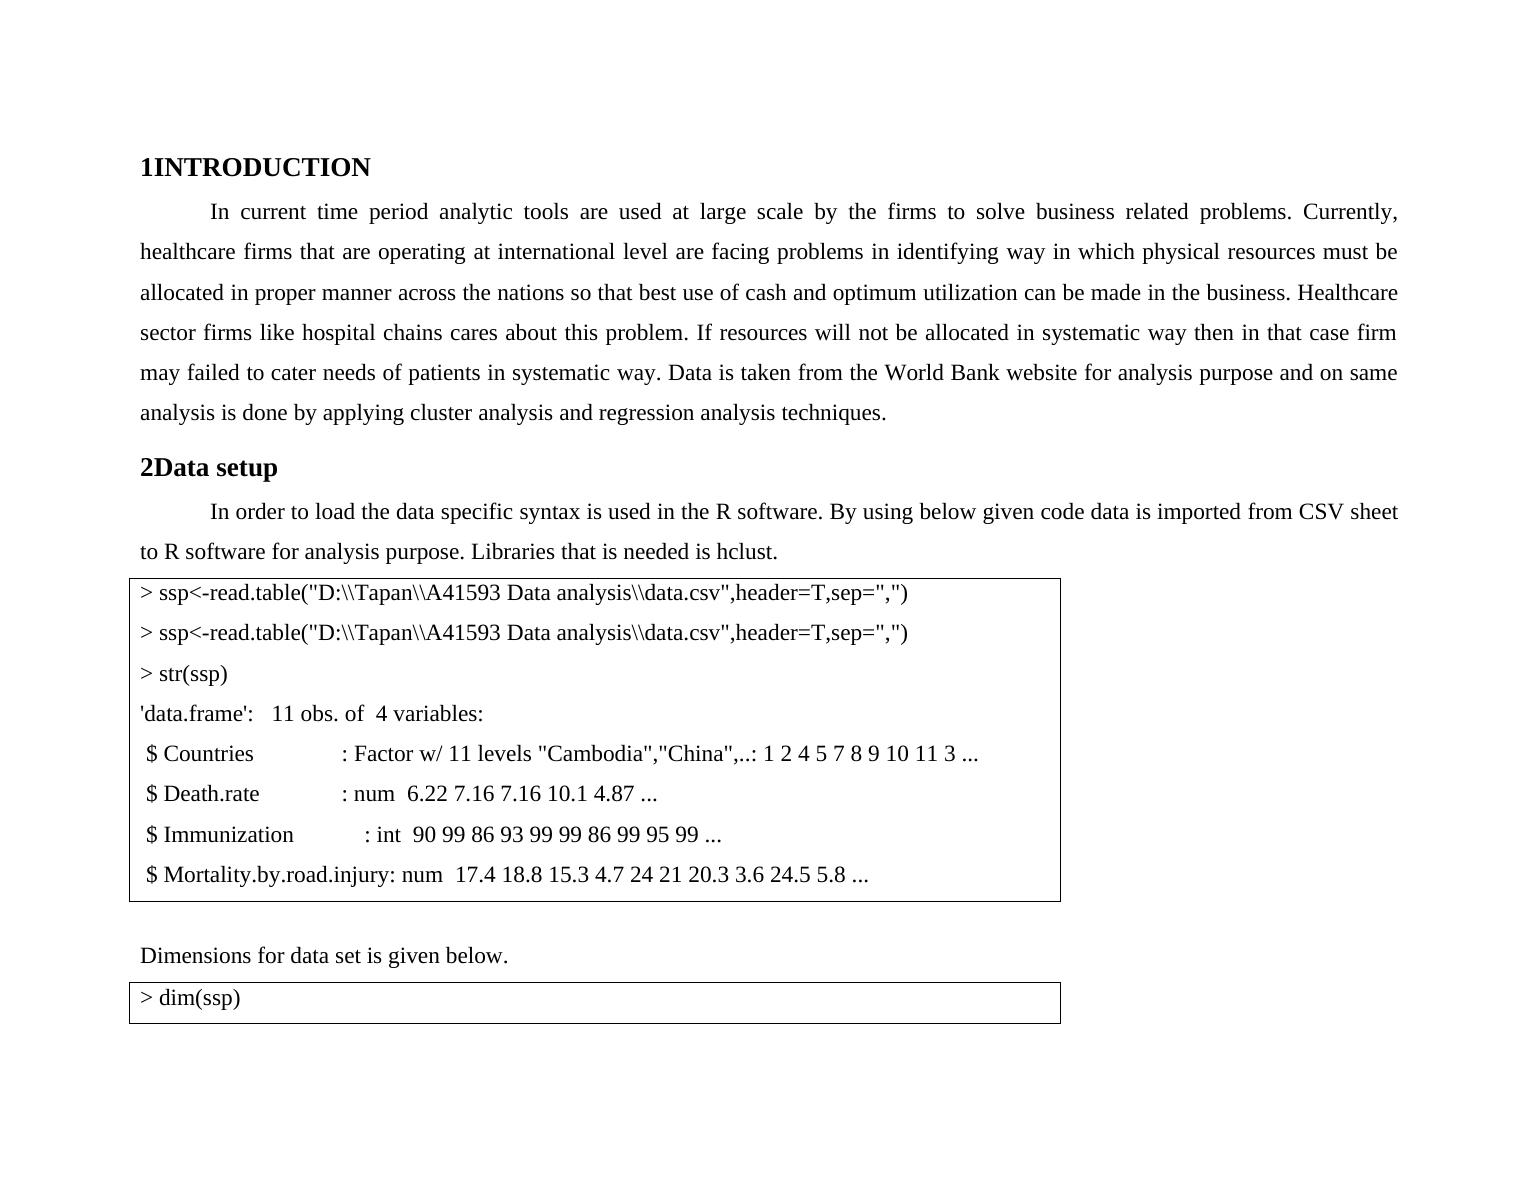
Results are reflecting that there are 11 rows and four columns in the dataset. It the dataset variables are countries, death rate,immunization and mortality by road injury. It can be said that there are categorical and continuous variables in the dataset. 3Exploratory data analysis3.1One variable analysisTable 1Descriptive statistics> summary(ssp)Countries Death.rate Immunization Mortality.by.road.injuryCambodia :1 Min. : 4.600 Min. :86.00 Min. : 2.90 China :1 1st Qu.: 5.976 1st Qu.:88.00 1st Qu.: 5.25 Fiji :1 Median : 6.815 Median :95.00 Median :17.40 Indonesia:1 Mean : 6.742 Mean :93.73 Mean :14.39 Japan :1 3rd Qu.: 7.160 3rd Qu.:99.00 3rd Qu.:20.65 Kirbati :1 Max. :10.100 Max. :99.00 Max. :24.50 (Other) :5
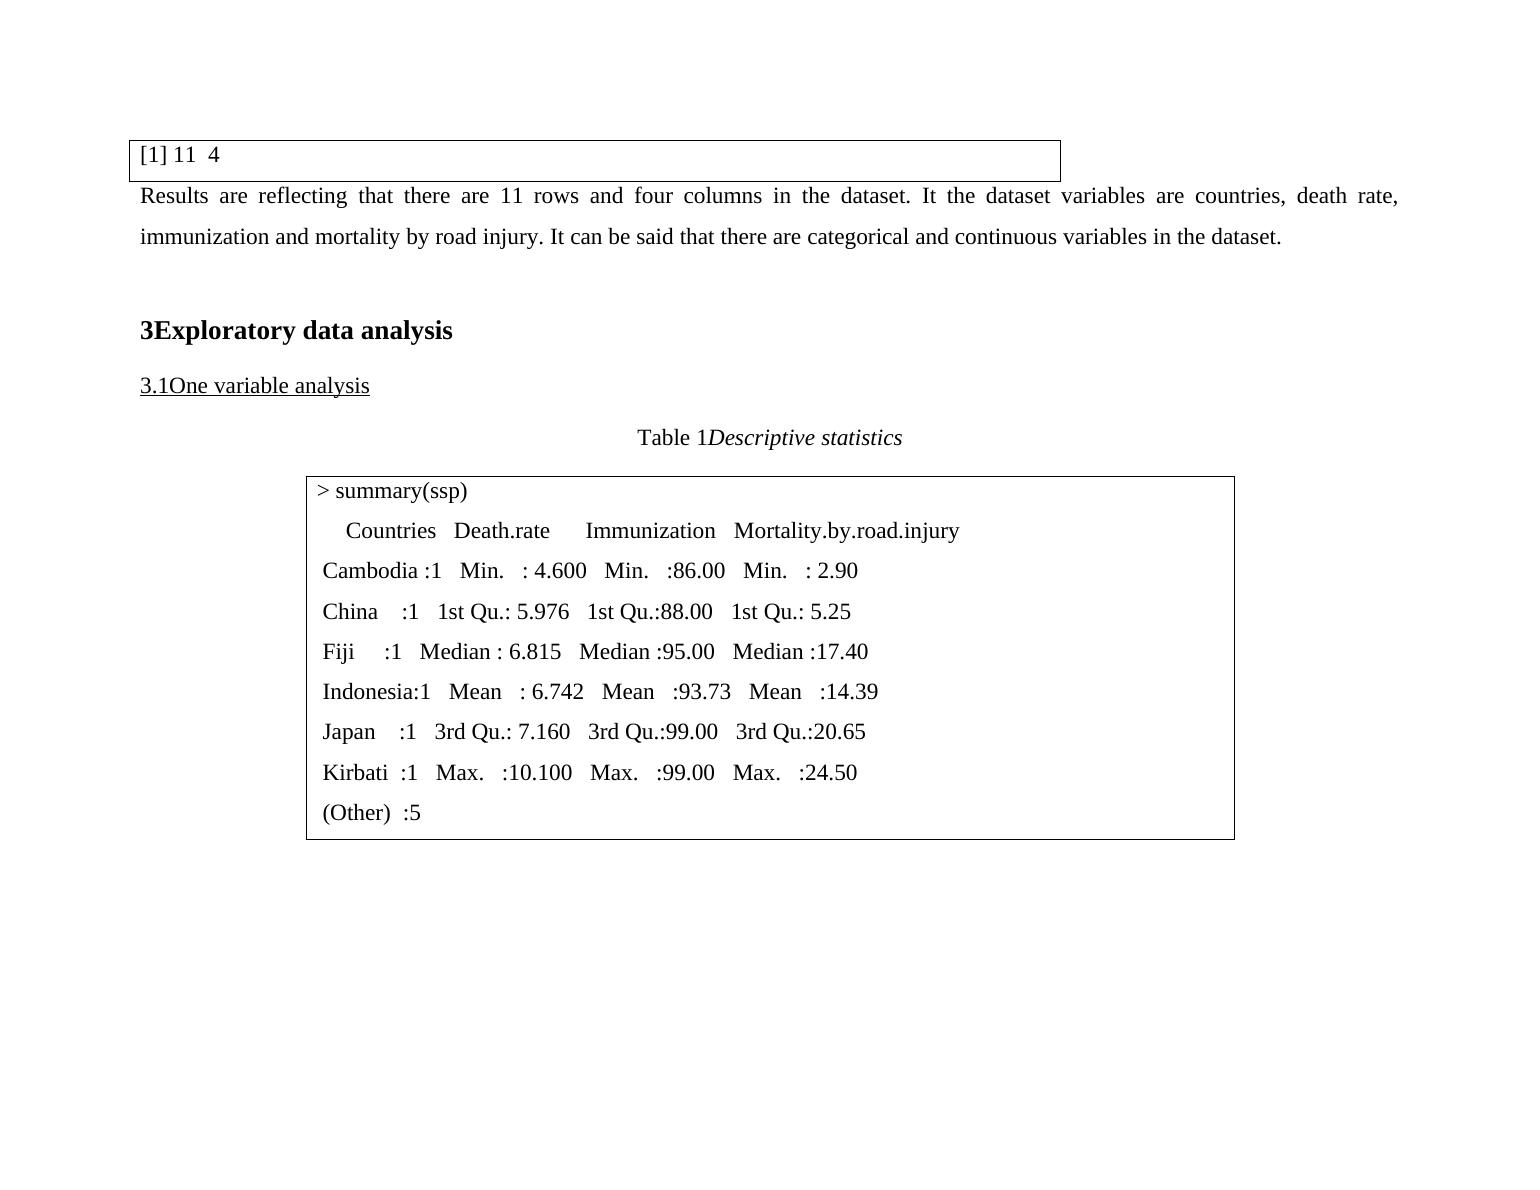
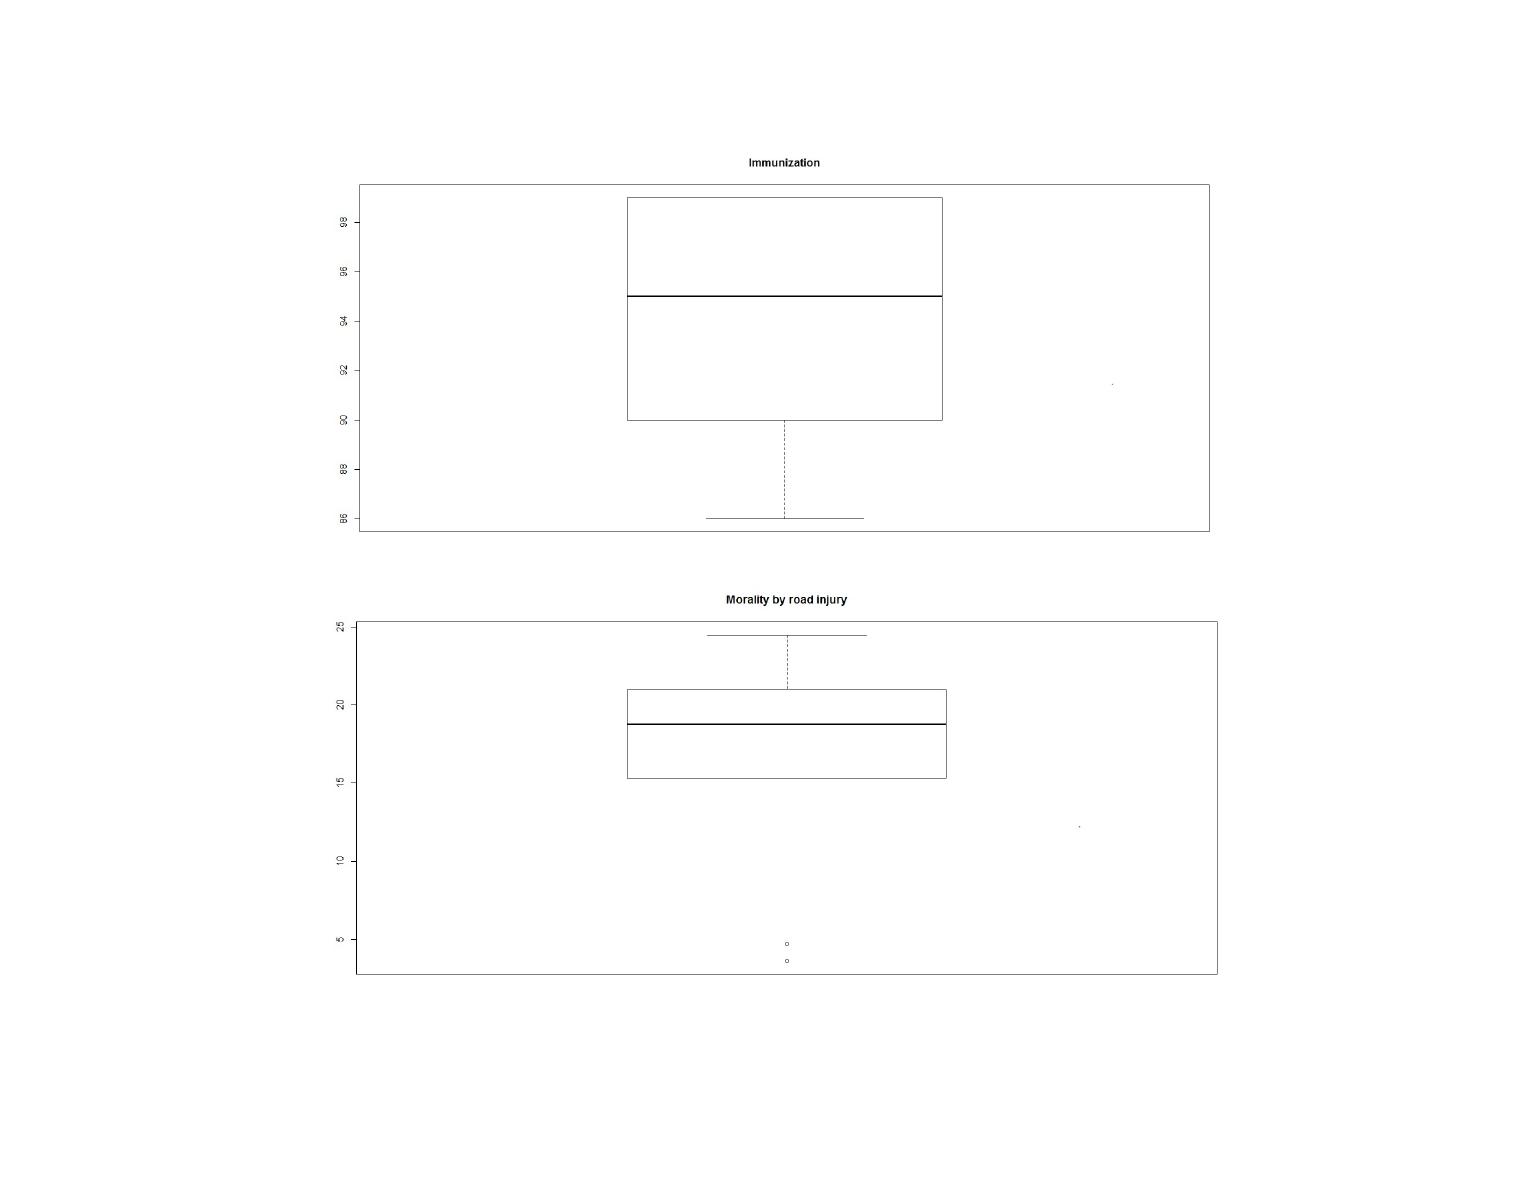
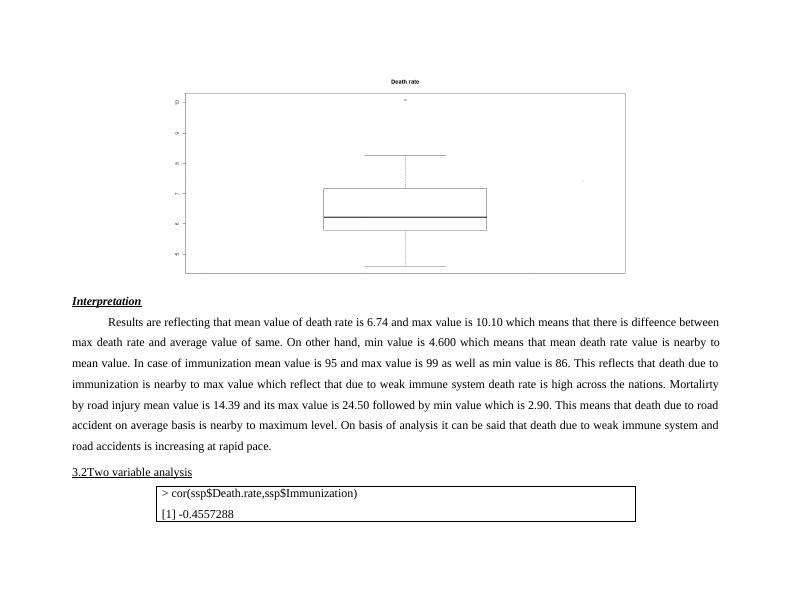
InterpretationResults are reflecting that mean value of death rate is 6.74 and max value is 10.10 which means that there is diffeence betweenmax death rate and average value of same. On other hand, min value is 4.600 which means that mean death rate value is nearby tomean value. In case of immunization mean value is 95 and max value is 99 as well as min value is 86. This reflects that death due toimmunization is nearby to max value which reflect that due to weak immune system death rate is high across the nations. Mortalirtyby road injury mean value is 14.39 and its max value is 24.50 followed by min value which is 2.90. This means that death due to roadaccident on average basis is nearby to maximum level. On basis of analysis it can be said that death due to weak immune system androad accidents is increasing at rapid pace.3.2Two variable analysis> cor(ssp$Death.rate,ssp$Immunization)[1] -0.4557288
End of preview
Want to access all the pages? Upload your documents or become a member.
Related Documents
Assignment on Health Status of the People in Countrylg...
|19
|2668
|116
Univariate Analysis II Regressionlg...
|28
|5189
|25
Maternal Health in Australia: Risk Factors and Analysislg...
|12
|1883
|486
Biostatistics Course Descriptions -lg...
|6
|892
|17