Data Analysis & Reporting to Management: ANOVA and Z-Test Analysis

Verified

Added on  2023/06/03

|5
|688
|66
Report
AI Summary
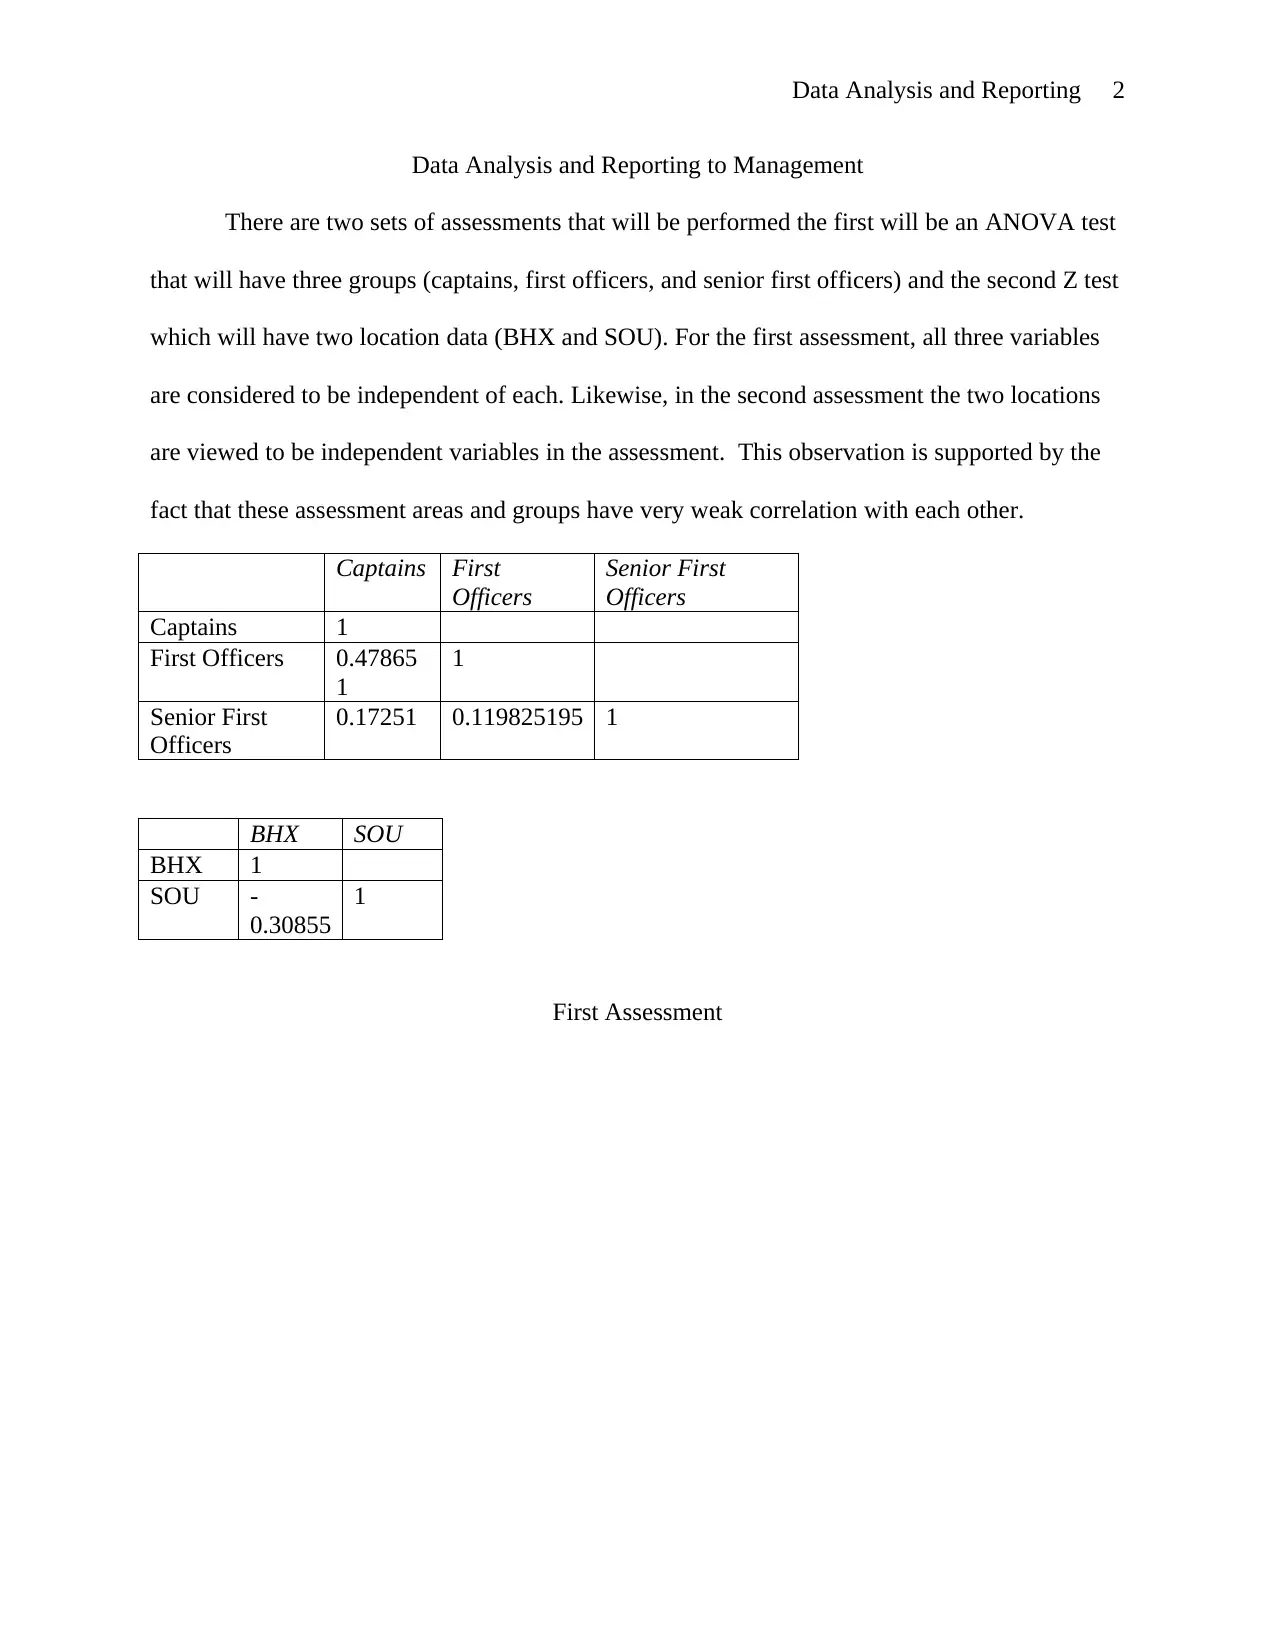
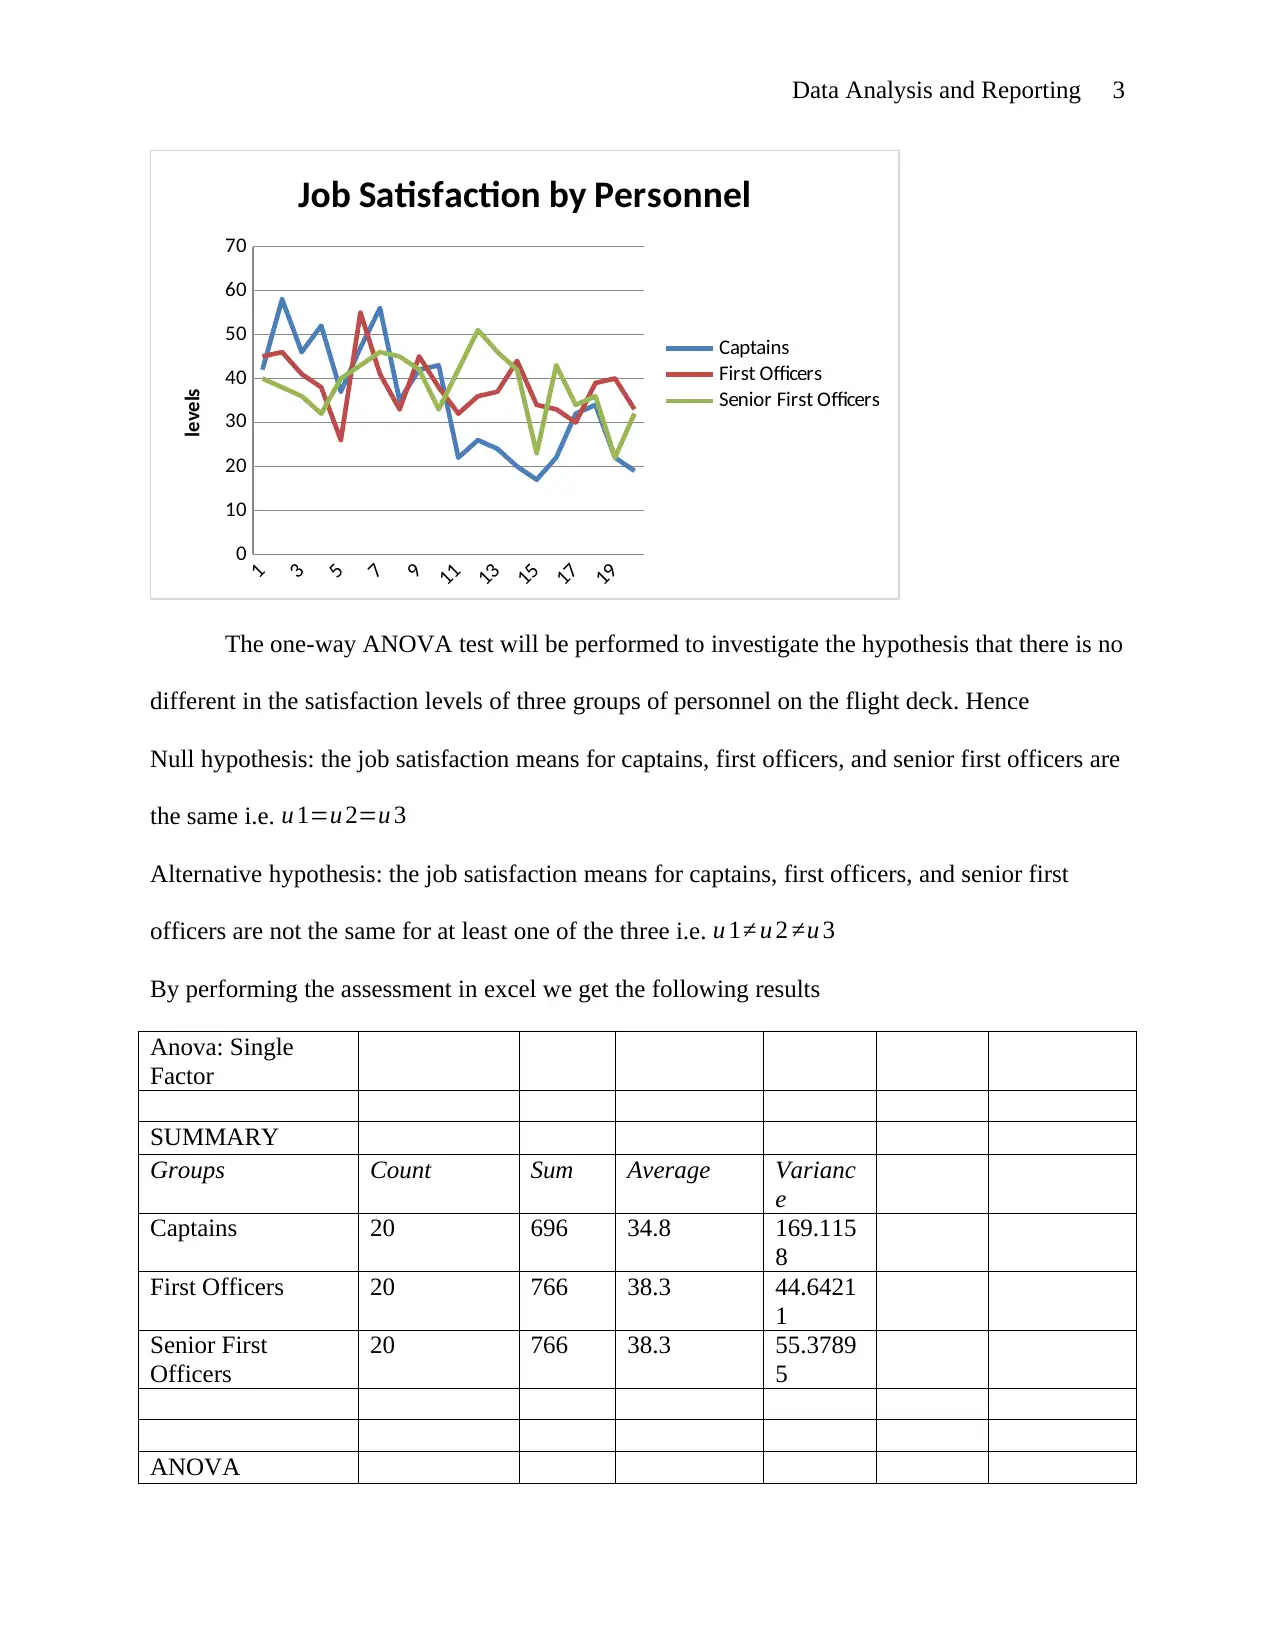
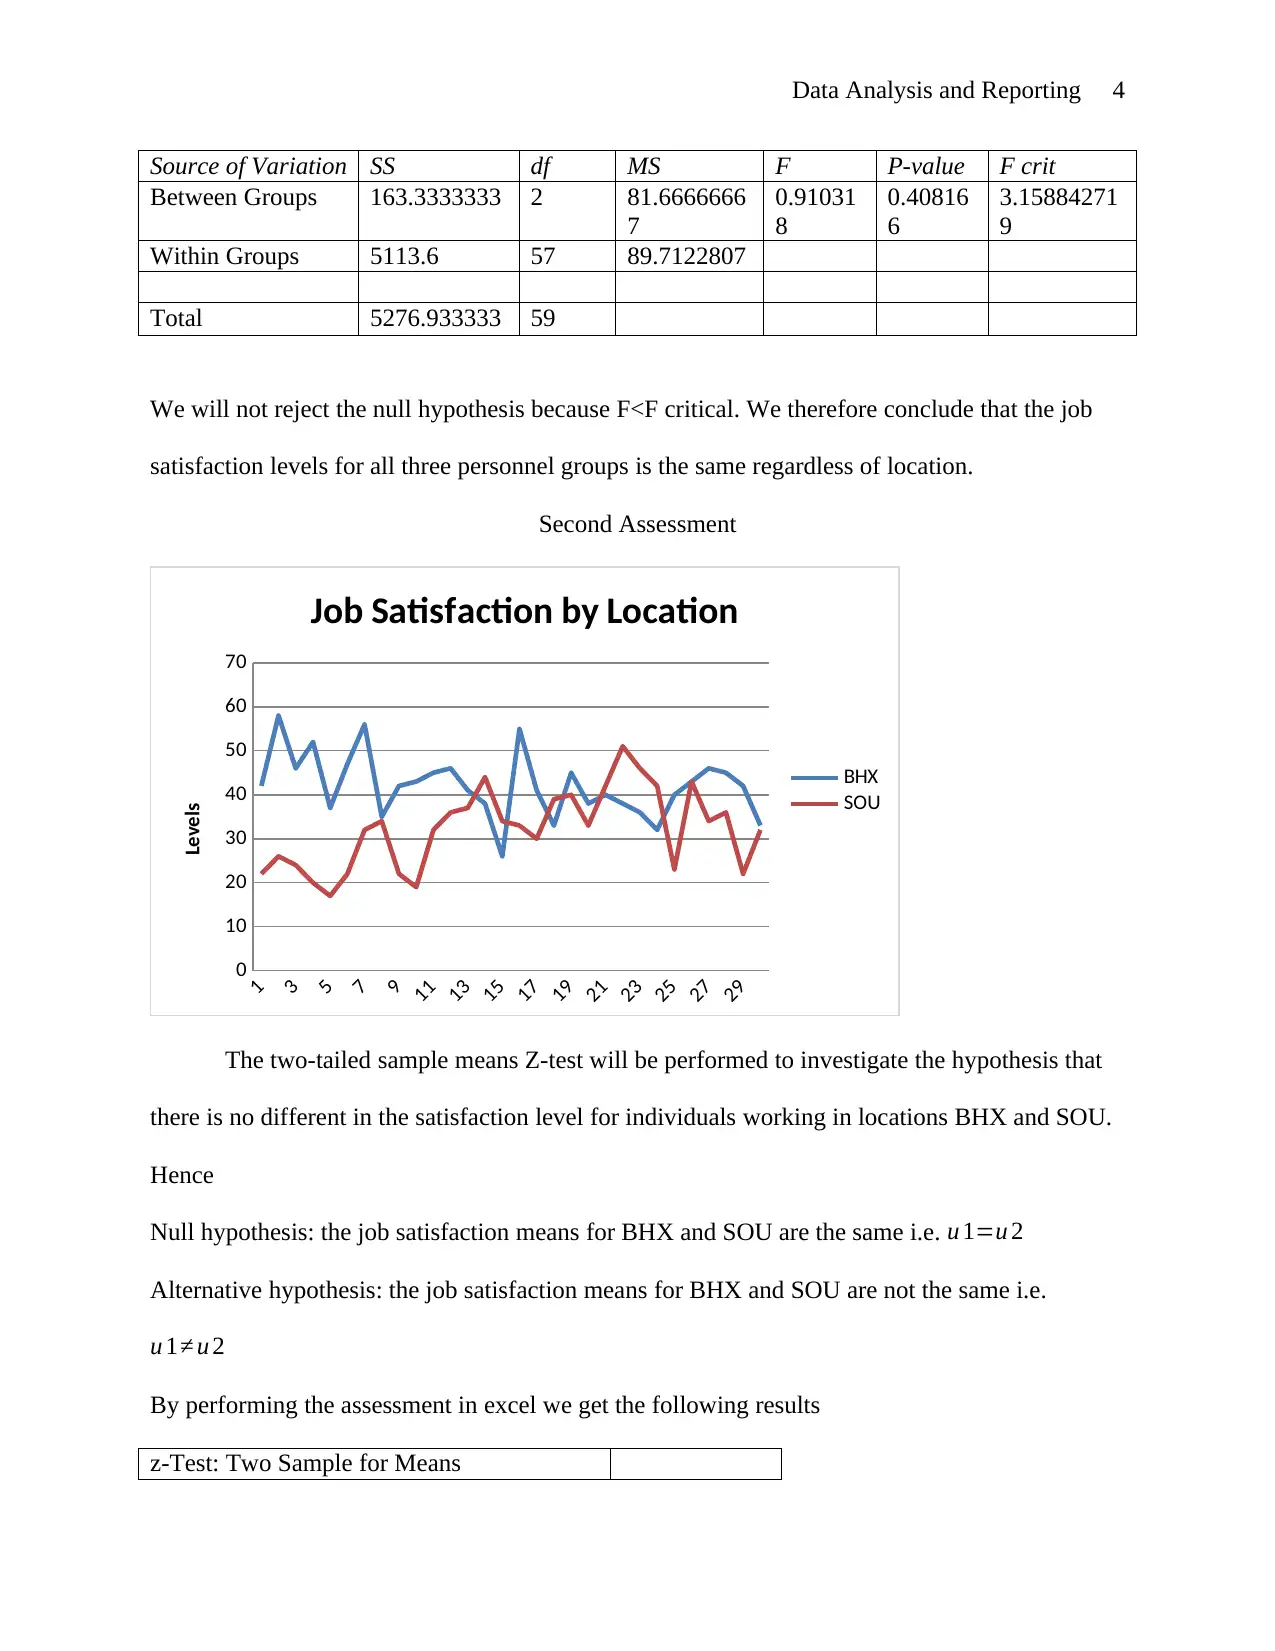
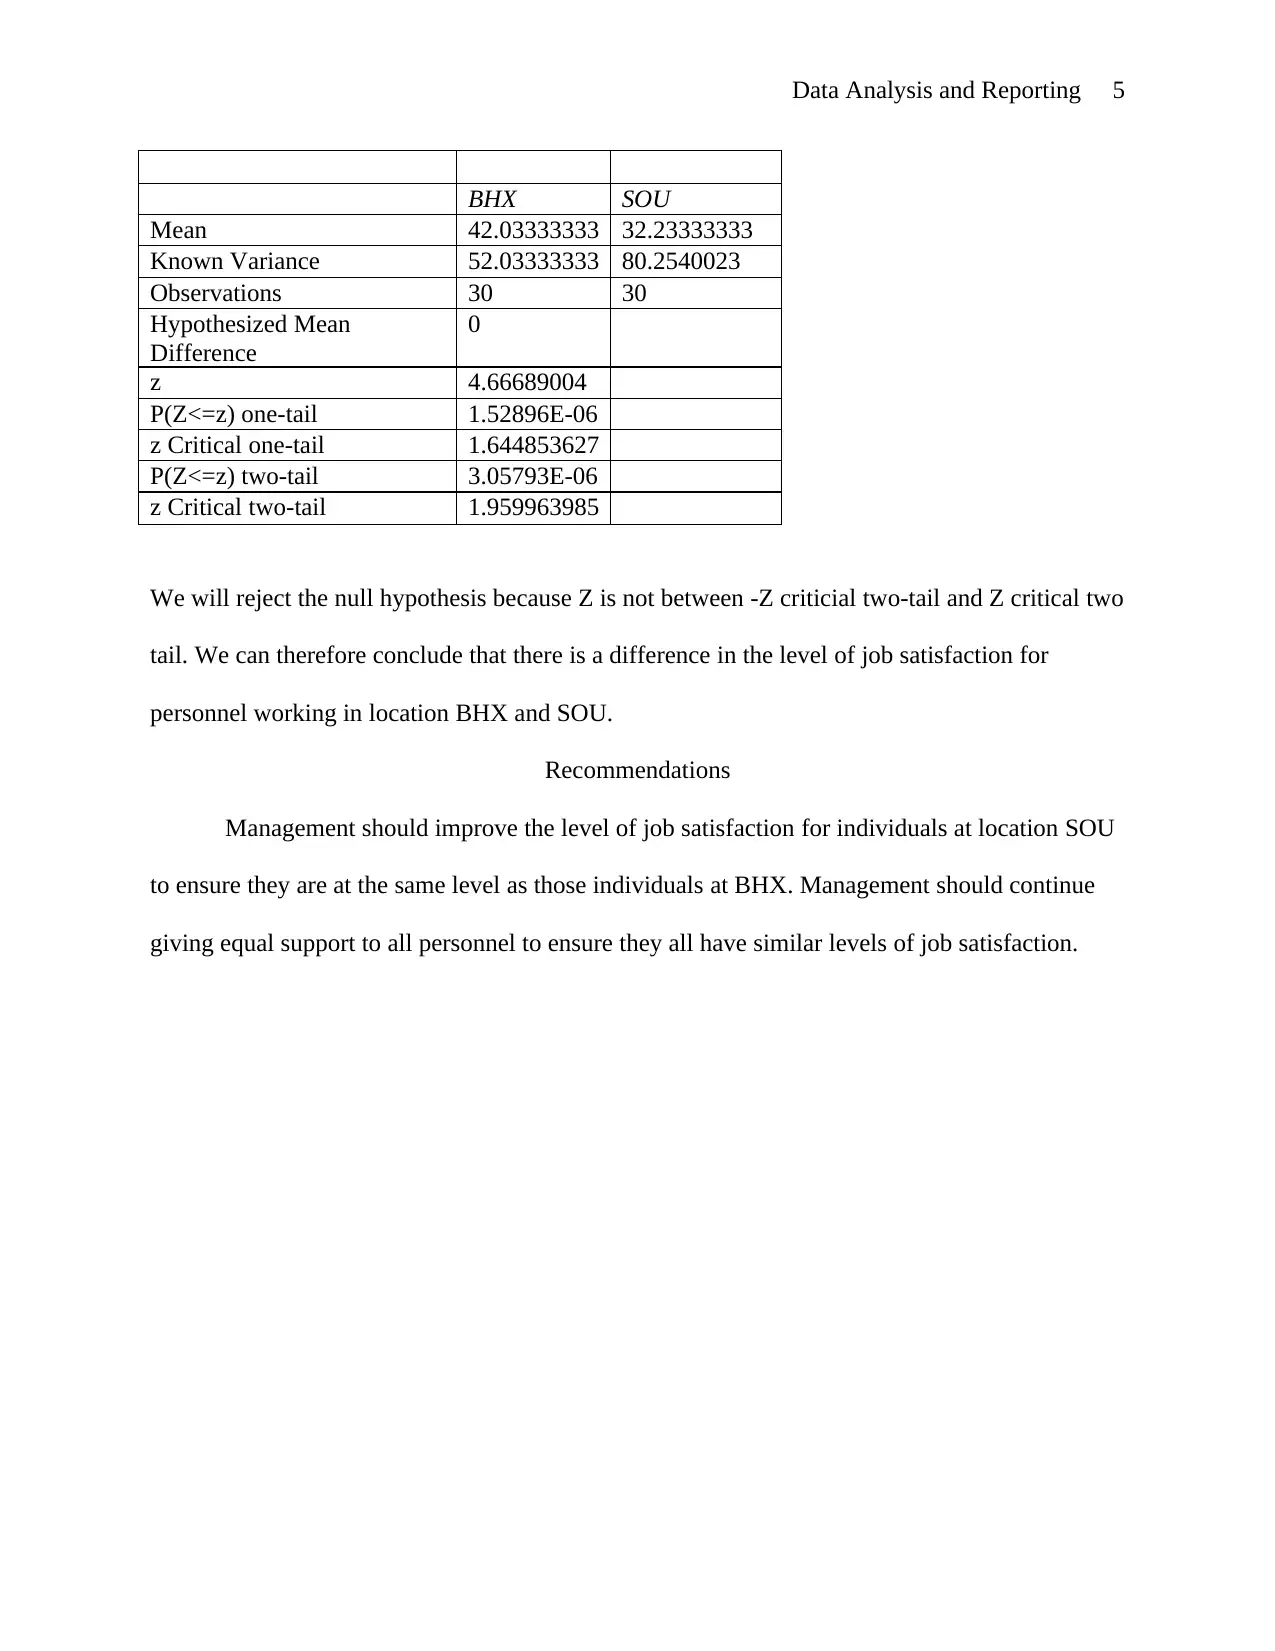
This report presents a data analysis employing ANOVA and Z-tests to evaluate job satisfaction levels across different personnel groups (captains, first officers, and senior first officers) and locations (BHX and SOU). The ANOVA test investigates whether there's a significant difference in job satisfaction among the three personnel groups, concluding that the job satisfaction levels are statistically the same across these groups. Conversely, the Z-test examines the difference in job satisfaction between the two locations, revealing a significant difference, with BHX showing higher satisfaction levels than SOU. The report recommends that management focus on improving job satisfaction at the SOU location to match the levels observed at BHX, while maintaining equitable support for all personnel groups to ensure consistently high job satisfaction across the board. Desklib provides access to similar past papers and solved assignments for students.
Document Page
Data Analysis and Reporting 1
DATA ANALYSIS AND REPORTING TO MANAGEMENT
By (Name)
The Name of the Class (Course)
Professor (Tutor)
The Name of the School (University)
The City and State where it is located
The Date
tabler-icon-diamond-filled.svg

Paraphrase This Document

Need a fresh take? Get an instant paraphrase of this document with our AI Paraphraser
Document Page
Data Analysis and Reporting 2
Data Analysis and Reporting to Management
There are two sets of assessments that will be performed the first will be an ANOVA test
that will have three groups (captains, first officers, and senior first officers) and the second Z test
which will have two location data (BHX and SOU). For the first assessment, all three variables
are considered to be independent of each. Likewise, in the second assessment the two locations
are viewed to be independent variables in the assessment. This observation is supported by the
fact that these assessment areas and groups have very weak correlation with each other.
Captains First
Officers
Senior First
Officers
Captains 1
First Officers 0.47865
1
1
Senior First
Officers
0.17251 0.119825195 1
BHX SOU
BHX 1
SOU -
0.30855
1
First Assessment
Document Page
Data Analysis and Reporting 3
1
3
5
7
9
11
13
15
17
19
0
10
20
30
40
50
60
70
Job Satisfaction by Personnel
Captains
First Officers
Senior First Officers
levels
The one-way ANOVA test will be performed to investigate the hypothesis that there is no
different in the satisfaction levels of three groups of personnel on the flight deck. Hence
Null hypothesis: the job satisfaction means for captains, first officers, and senior first officers are
the same i.e. u 1=u 2=u 3
Alternative hypothesis: the job satisfaction means for captains, first officers, and senior first
officers are not the same for at least one of the three i.e. u 1 u 2 u 3
By performing the assessment in excel we get the following results
Anova: Single
Factor
SUMMARY
Groups Count Sum Average Varianc
e
Captains 20 696 34.8 169.115
8
First Officers 20 766 38.3 44.6421
1
Senior First
Officers
20 766 38.3 55.3789
5
ANOVA
Document Page
Data Analysis and Reporting 4
Source of Variation SS df MS F P-value F crit
Between Groups 163.3333333 2 81.6666666
7
0.91031
8
0.40816
6
3.15884271
9
Within Groups 5113.6 57 89.7122807
Total 5276.933333 59
We will not reject the null hypothesis because F<F critical. We therefore conclude that the job
satisfaction levels for all three personnel groups is the same regardless of location.
Second Assessment
1
3
5
7
9
11
13
15
17
19
21
23
25
27
29
0
10
20
30
40
50
60
70
Job Satisfaction by Location
BHX
SOU
Levels
The two-tailed sample means Z-test will be performed to investigate the hypothesis that
there is no different in the satisfaction level for individuals working in locations BHX and SOU.
Hence
Null hypothesis: the job satisfaction means for BHX and SOU are the same i.e. u 1=u 2
Alternative hypothesis: the job satisfaction means for BHX and SOU are not the same i.e.
u 1 u 2
By performing the assessment in excel we get the following results
z-Test: Two Sample for Means
tabler-icon-diamond-filled.svg

Paraphrase This Document

Need a fresh take? Get an instant paraphrase of this document with our AI Paraphraser
Document Page
Data Analysis and Reporting 5
BHX SOU
Mean 42.03333333 32.23333333
Known Variance 52.03333333 80.2540023
Observations 30 30
Hypothesized Mean
Difference
0
z 4.66689004
P(Z<=z) one-tail 1.52896E-06
z Critical one-tail 1.644853627
P(Z<=z) two-tail 3.05793E-06
z Critical two-tail 1.959963985
We will reject the null hypothesis because Z is not between -Z criticial two-tail and Z critical two
tail. We can therefore conclude that there is a difference in the level of job satisfaction for
personnel working in location BHX and SOU.
Recommendations
Management should improve the level of job satisfaction for individuals at location SOU
to ensure they are at the same level as those individuals at BHX. Management should continue
giving equal support to all personnel to ensure they all have similar levels of job satisfaction.
chevron_up_icon
1 out of 5
circle_padding
hide_on_mobile
zoom_out_icon
[object Object]