Data Analysis Techniques: Statistical Values and Wind Speed Prediction

Verified

Added on  2021/02/20

|9
|1279
|53
Homework Assignment
AI Summary
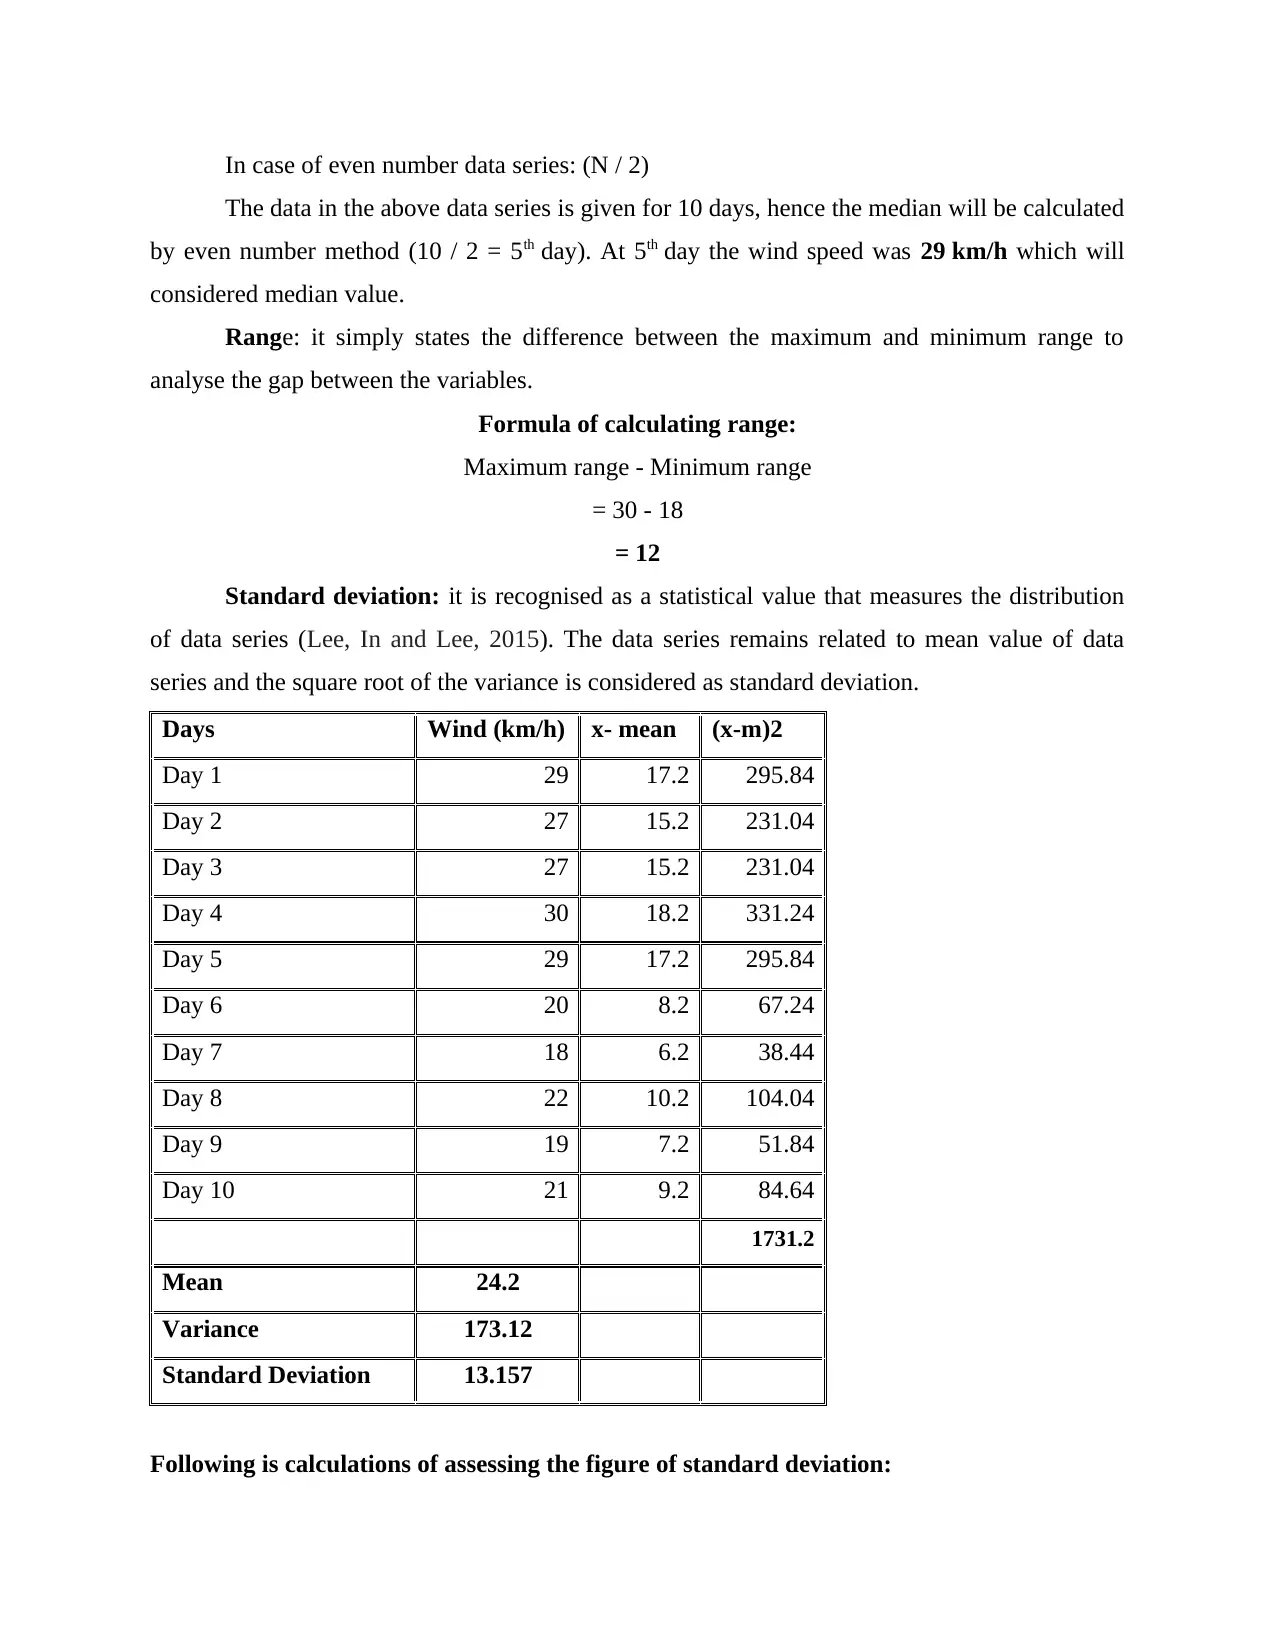
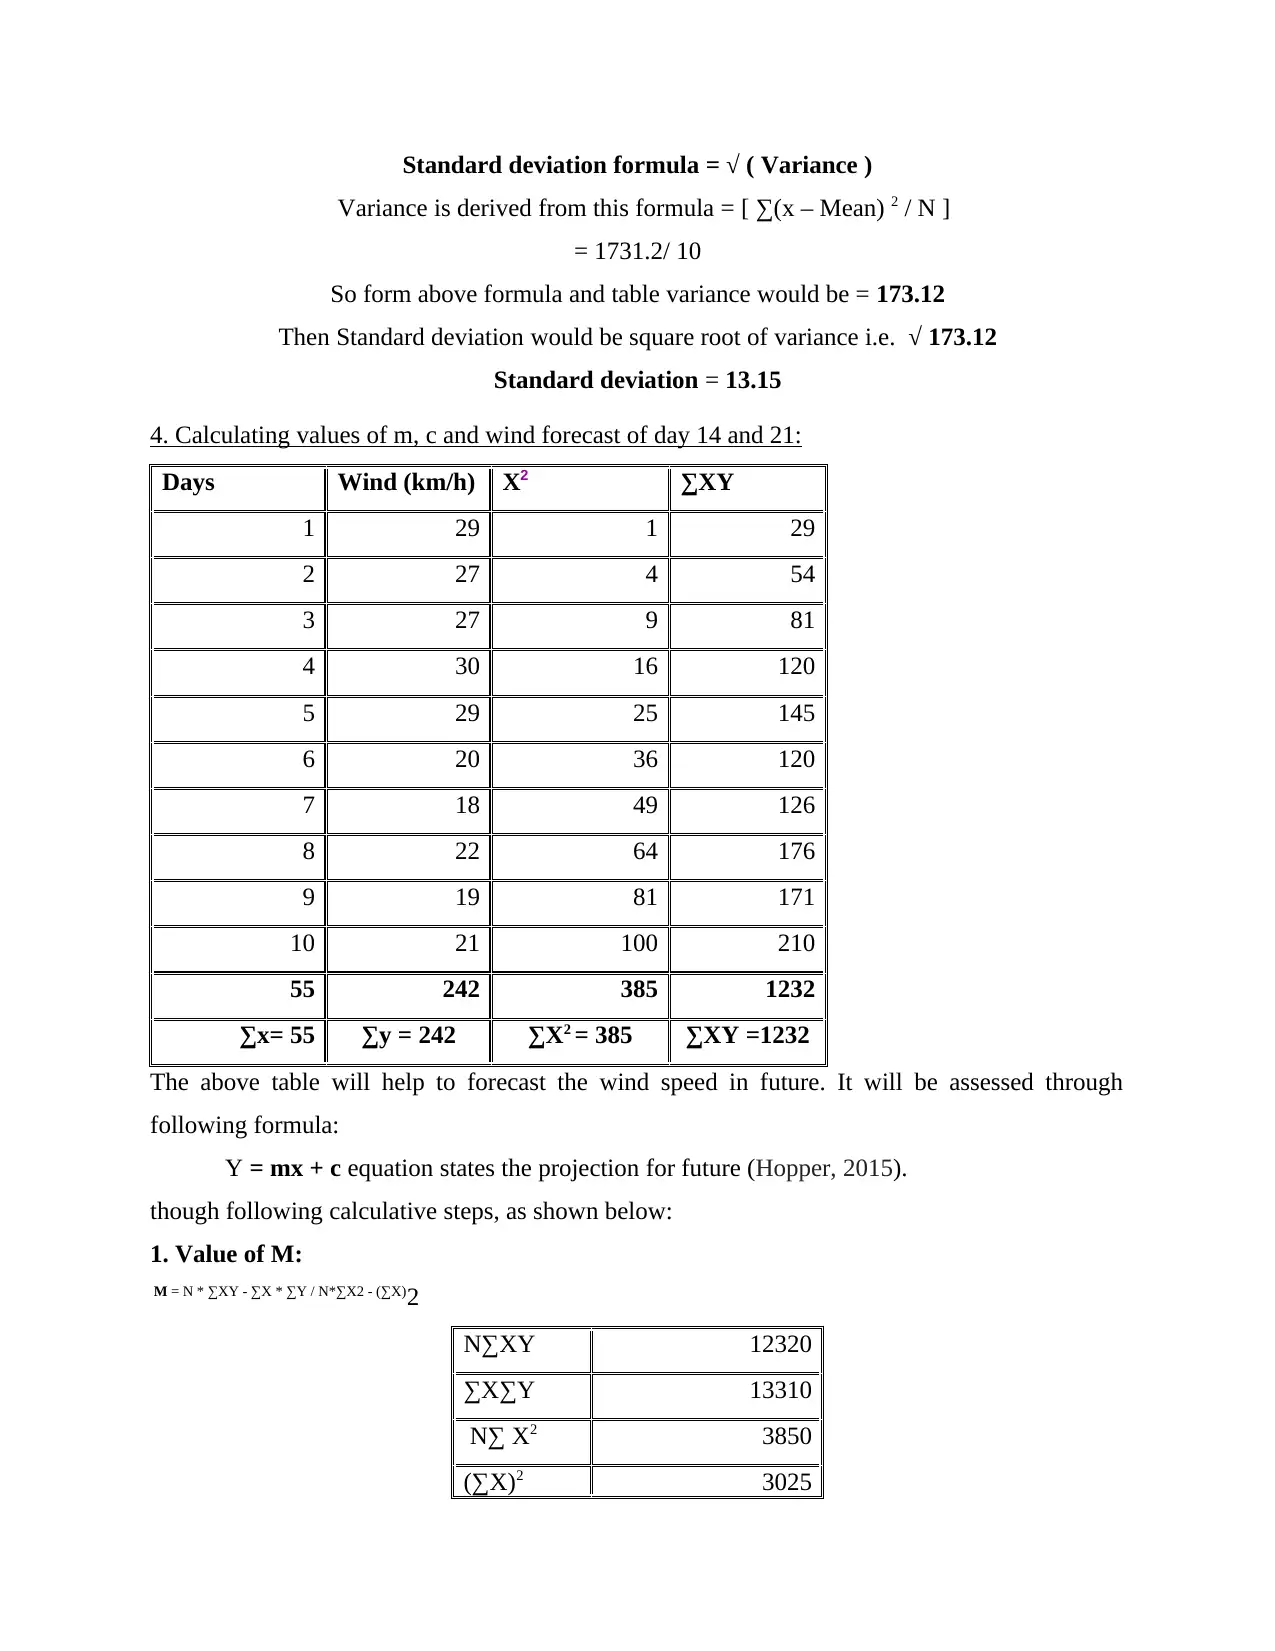
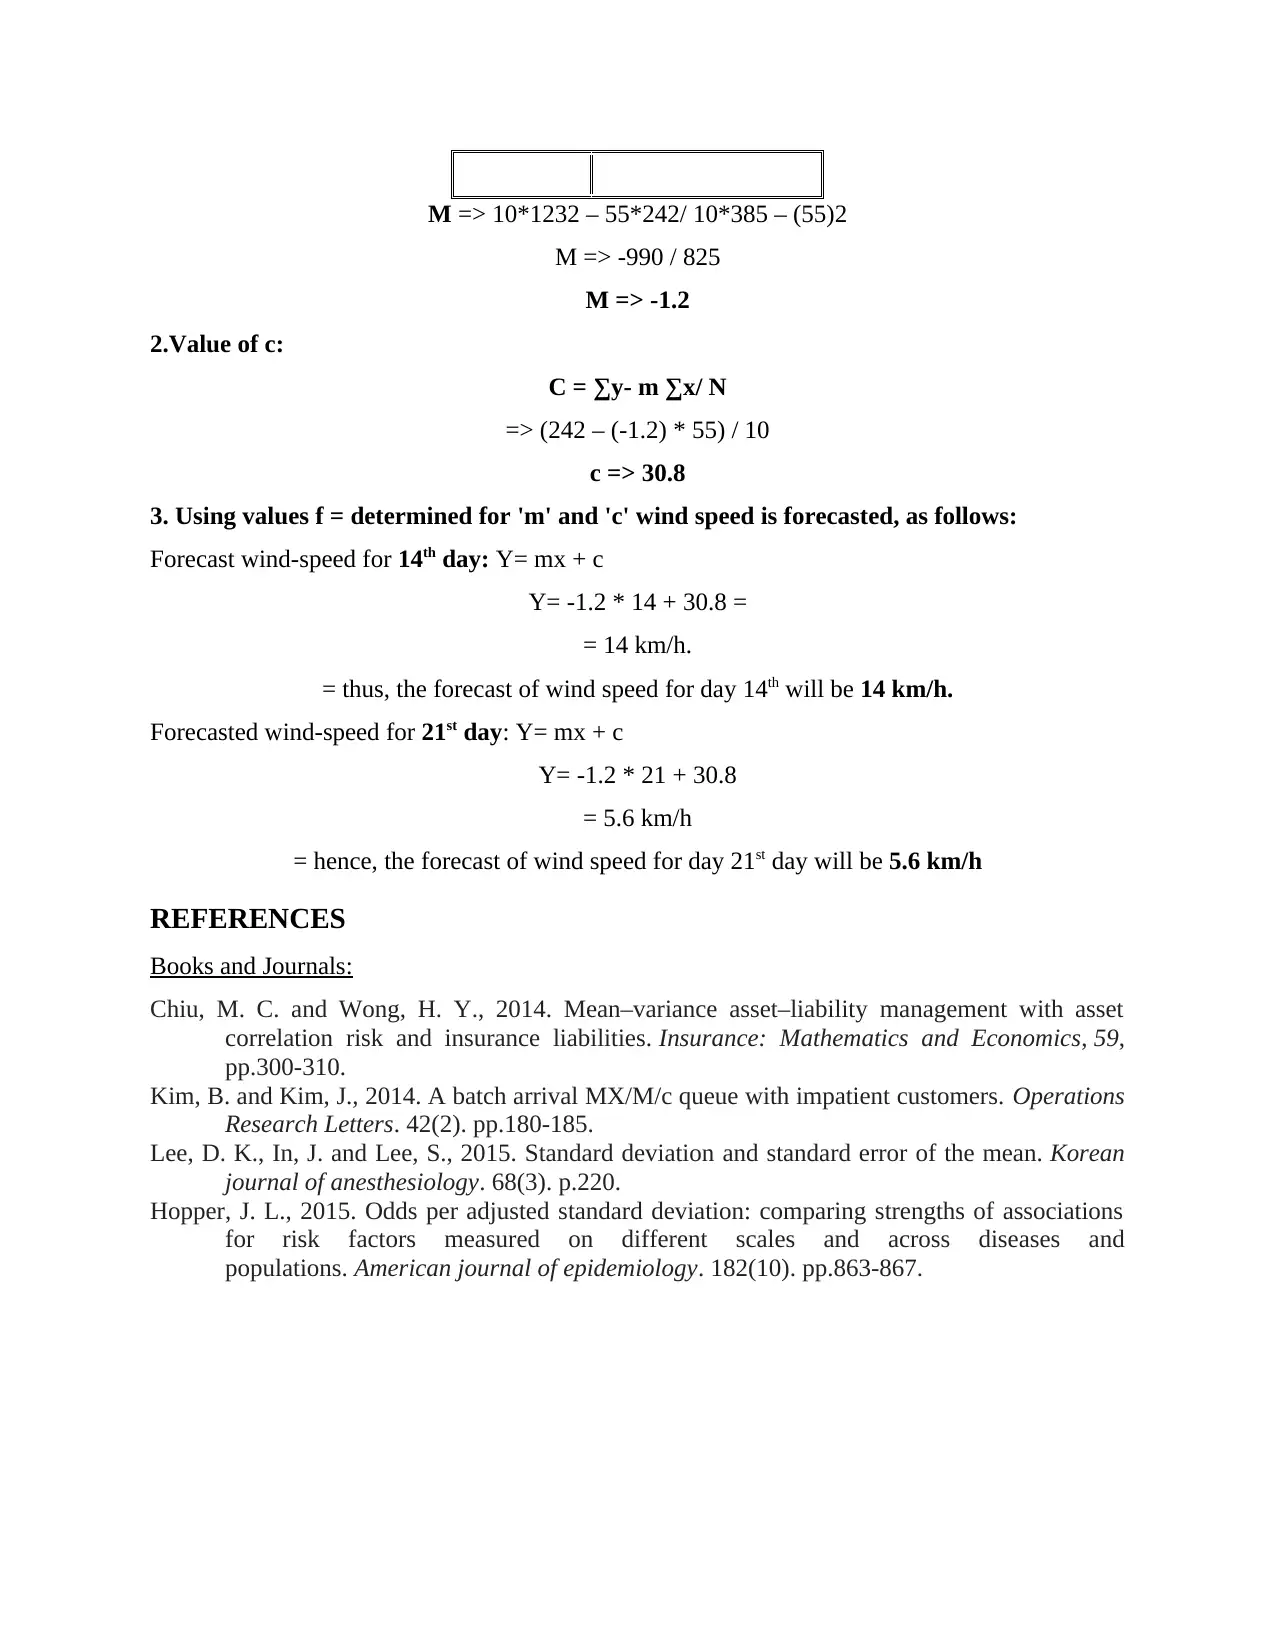
This assignment provides a comprehensive analysis of data analysis techniques, focusing on statistical values and forecasting. The solution begins with data arrangement in a table and its presentation through bar and column charts. It then delves into the calculation of key statistical values, including mean, mode, median, range, and standard deviation, providing formulas and step-by-step calculations. Furthermore, the assignment explores forecasting techniques, using regression analysis to predict wind speed for future days. The document includes the calculation of 'm' and 'c' values, followed by forecasts for the 14th and 21st days, illustrating the application of statistical principles to real-world scenarios. Finally, the assignment concludes with a list of cited references, including books and journals, providing sources for the methods and concepts discussed.
Document Page
Data Analysis
Techniques
tabler-icon-diamond-filled.svg

Paraphrase This Document

Need a fresh take? Get an instant paraphrase of this document with our AI Paraphraser
Document Page
Table of Contents
Document Page
1. Arrangement of data in table...................................................................................................3
2. Data presentation in the form of charts....................................................................................3
3. Measurement of statistical values (Mean, mode, median, range and standard deviation):.....4
4. Calculating values of m, c and wind forecast of day 14 and 21:.............................................7
REFERENCES................................................................................................................................8
Document Page
1. Arrangement of data in table
Day Wind (km/h)
Day 1 29
Day 2 27
Day 3 27
Day 4 30
Day 5 29
Day 6 20
Day 7 18
Day 8 22
Day 9 19
Day 10 21
2. Data presentation in the form of charts
Bar chart: these type of charts is prepared to compare the variables horizontally.
tabler-icon-diamond-filled.svg

Paraphrase This Document

Need a fresh take? Get an instant paraphrase of this document with our AI Paraphraser
Document Page
The above bar chart presents the wind blow speed km/h for consecutive ten days. The
information can be extractes as the on 4th day wind speed was 30 km/h.
Column chart: It is also a type of chart helps in comparing the variables vertically.
As the abive chart states that how organisation presents the wind speed in km/h for
different different consecutive 10 days.
3. Measurement of statistical values (Mean, mode, median, range and standard deviation):
Day Wind (km/h)
Day 1 29
Day 2 27
Day 3 27
Day 4 30
Day 5 29
Day 6 20
Day 7 18
Day 8 22
Day 9 19
Document Page
Day 10 21
X 242
Mean 24.2
Median 29
Mode 29
Range 12
Maximum range 30
Minimum 18
Mean: It is considered as an average value among the number of series (Chiu and Wong,
2014). Here in the above case mean value is calculated to evaluate average wind speed and the
average wind speed is calculated as 24.2 km/h.
Formula of mean: ∑x / N
= (29+27+27+30+29+20+18+22+19+21) / 10
= 242/ 10 = 24.2 km/h
Mode: It states the most frequent number in a data series (Kim and Kim, 2014). From the
above table of wind km/h it is assessed that wind speed 29 km/h and 27 km/h is frequent figure
subsequently for day 1st, 5th and day 2nd, 3rd. Maximum speed of wind-speed will be considered as
most frequent figure. Hence, 29 km/h will be considered as mode. The following table is
extracted below:
1st 29
5th 29
Median: this is one of the method of calculating average value among the number series.
It is calculated by following ways defined as follows:
In cases of Odd number series: (N +1) / 2
Document Page
In case of even number data series: (N / 2)
The data in the above data series is given for 10 days, hence the median will be calculated
by even number method (10 / 2 = 5th day). At 5th day the wind speed was 29 km/h which will
considered median value.
Range: it simply states the difference between the maximum and minimum range to
analyse the gap between the variables.
Formula of calculating range:
Maximum range - Minimum range
= 30 - 18
= 12
Standard deviation: it is recognised as a statistical value that measures the distribution
of data series (Lee, In and Lee, 2015). The data series remains related to mean value of data
series and the square root of the variance is considered as standard deviation.
Days Wind (km/h) x- mean (x-m)2
Day 1 29 17.2 295.84
Day 2 27 15.2 231.04
Day 3 27 15.2 231.04
Day 4 30 18.2 331.24
Day 5 29 17.2 295.84
Day 6 20 8.2 67.24
Day 7 18 6.2 38.44
Day 8 22 10.2 104.04
Day 9 19 7.2 51.84
Day 10 21 9.2 84.64
1731.2
Mean 24.2
Variance 173.12
Standard Deviation 13.157
Following is calculations of assessing the figure of standard deviation:
tabler-icon-diamond-filled.svg

Paraphrase This Document

Need a fresh take? Get an instant paraphrase of this document with our AI Paraphraser
Document Page
Standard deviation formula = √ ( Variance )
Variance is derived from this formula = [ ∑(x – Mean) 2 / N ]
= 1731.2/ 10
So form above formula and table variance would be = 173.12
Then Standard deviation would be square root of variance i.e. √ 173.12
Standard deviation = 13.15
4. Calculating values of m, c and wind forecast of day 14 and 21:
Days Wind (km/h) X2 ∑XY
1 29 1 29
2 27 4 54
3 27 9 81
4 30 16 120
5 29 25 145
6 20 36 120
7 18 49 126
8 22 64 176
9 19 81 171
10 21 100 210
55 242 385 1232
∑x= 55 ∑y = 242 ∑X2 = 385 ∑XY =1232
The above table will help to forecast the wind speed in future. It will be assessed through
following formula:
Y = mx + c equation states the projection for future (Hopper, 2015).
though following calculative steps, as shown below:
1. Value of M:
M = N * ∑XY - ∑X * ∑Y / N*∑X2 - (∑X)2
N∑XY 12320
∑X∑Y 13310
N∑ X2 3850
(∑X)2 3025
Document Page
M => 10*1232 – 55*242/ 10*385 – (55)2
M => -990 / 825
M => -1.2
2.Value of c:
C = ∑y- m ∑x/ N
=> (242 – (-1.2) * 55) / 10
c => 30.8
3. Using values f = determined for 'm' and 'c' wind speed is forecasted, as follows:
Forecast wind-speed for 14th day: Y= mx + c
Y= -1.2 * 14 + 30.8 =
= 14 km/h.
= thus, the forecast of wind speed for day 14th will be 14 km/h.
Forecasted wind-speed for 21st day: Y= mx + c
Y= -1.2 * 21 + 30.8
= 5.6 km/h
= hence, the forecast of wind speed for day 21st day will be 5.6 km/h
REFERENCES
Books and Journals:
Chiu, M. C. and Wong, H. Y., 2014. Mean–variance asset–liability management with asset
correlation risk and insurance liabilities. Insurance: Mathematics and Economics, 59,
pp.300-310.
Kim, B. and Kim, J., 2014. A batch arrival MX/M/c queue with impatient customers. Operations
Research Letters. 42(2). pp.180-185.
Lee, D. K., In, J. and Lee, S., 2015. Standard deviation and standard error of the mean. Korean
journal of anesthesiology. 68(3). p.220.
Hopper, J. L., 2015. Odds per adjusted standard deviation: comparing strengths of associations
for risk factors measured on different scales and across diseases and
populations. American journal of epidemiology. 182(10). pp.863-867.
chevron_up_icon
1 out of 9
circle_padding
hide_on_mobile
zoom_out_icon
[object Object]