Numeracy And Data Analysis

Verified

Added on  2021/02/20

|10
|1453
|333
AI Summary
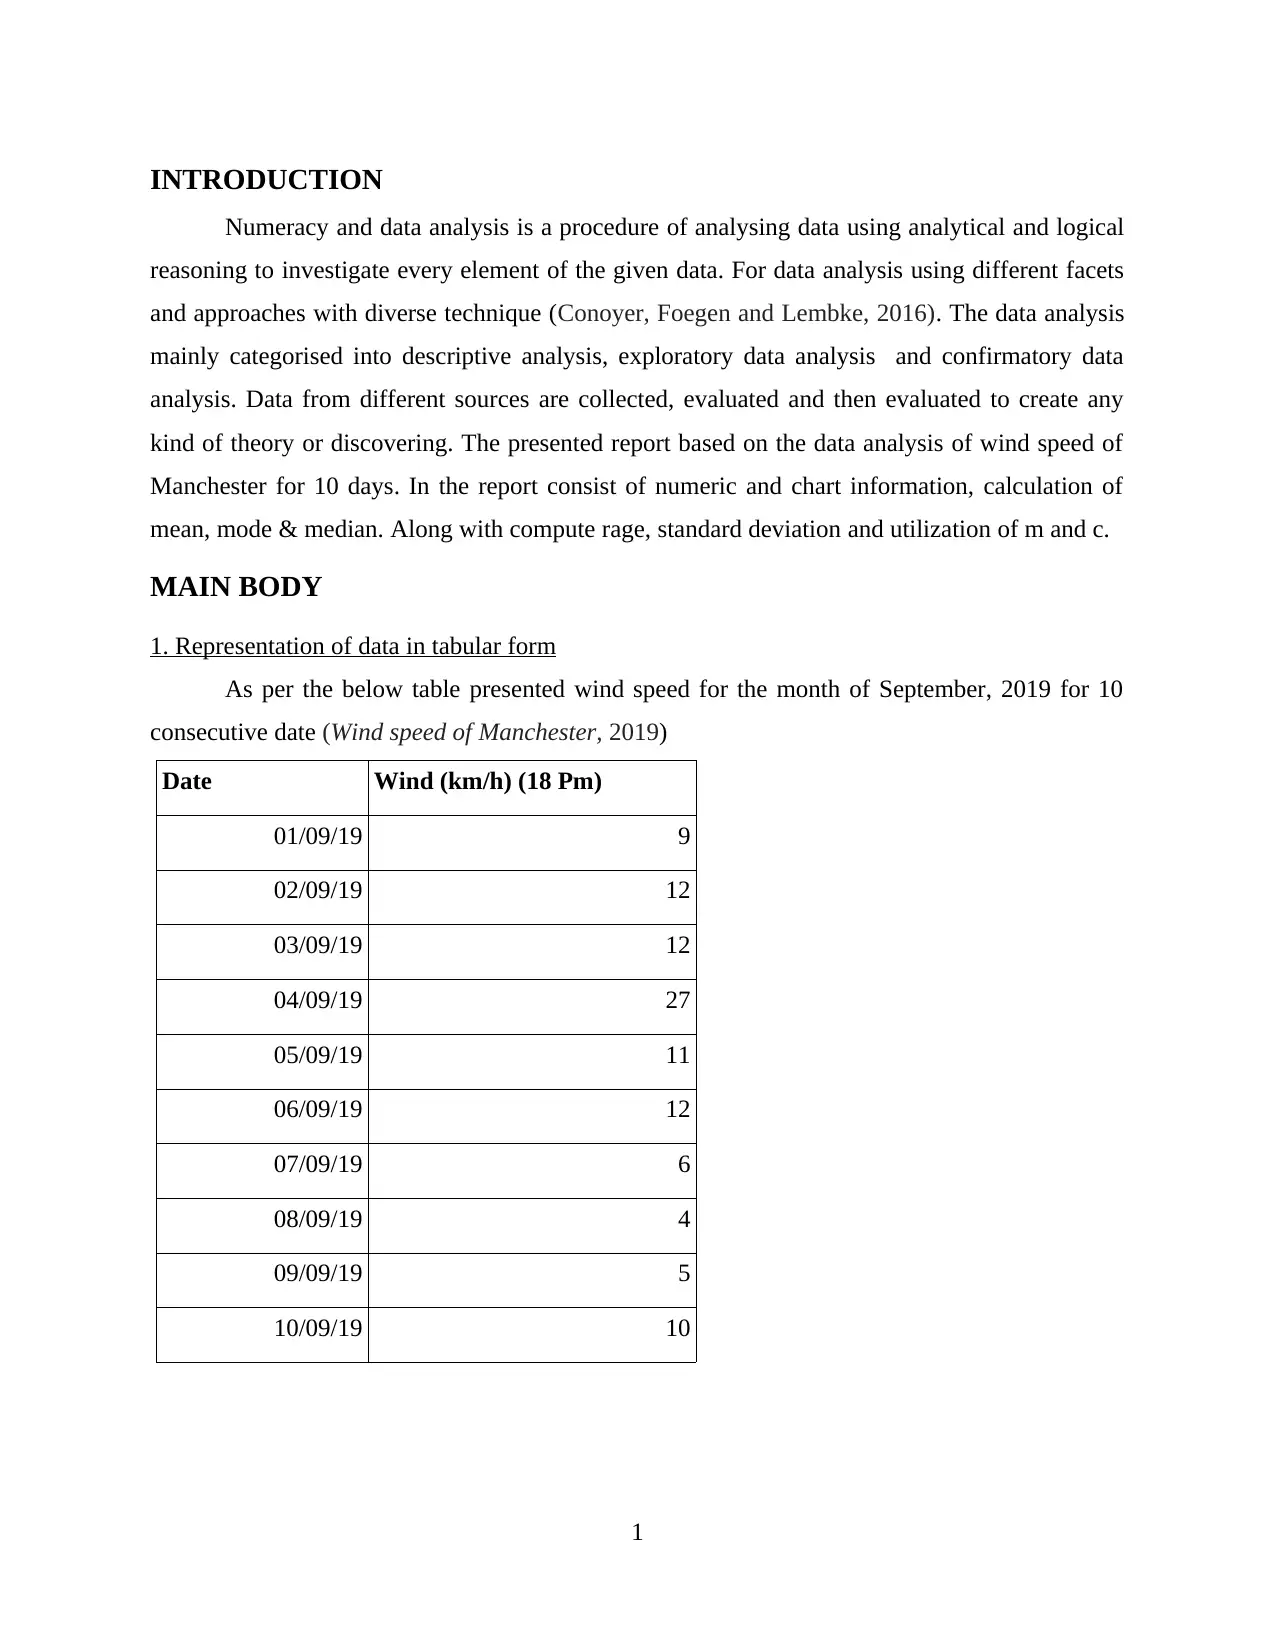
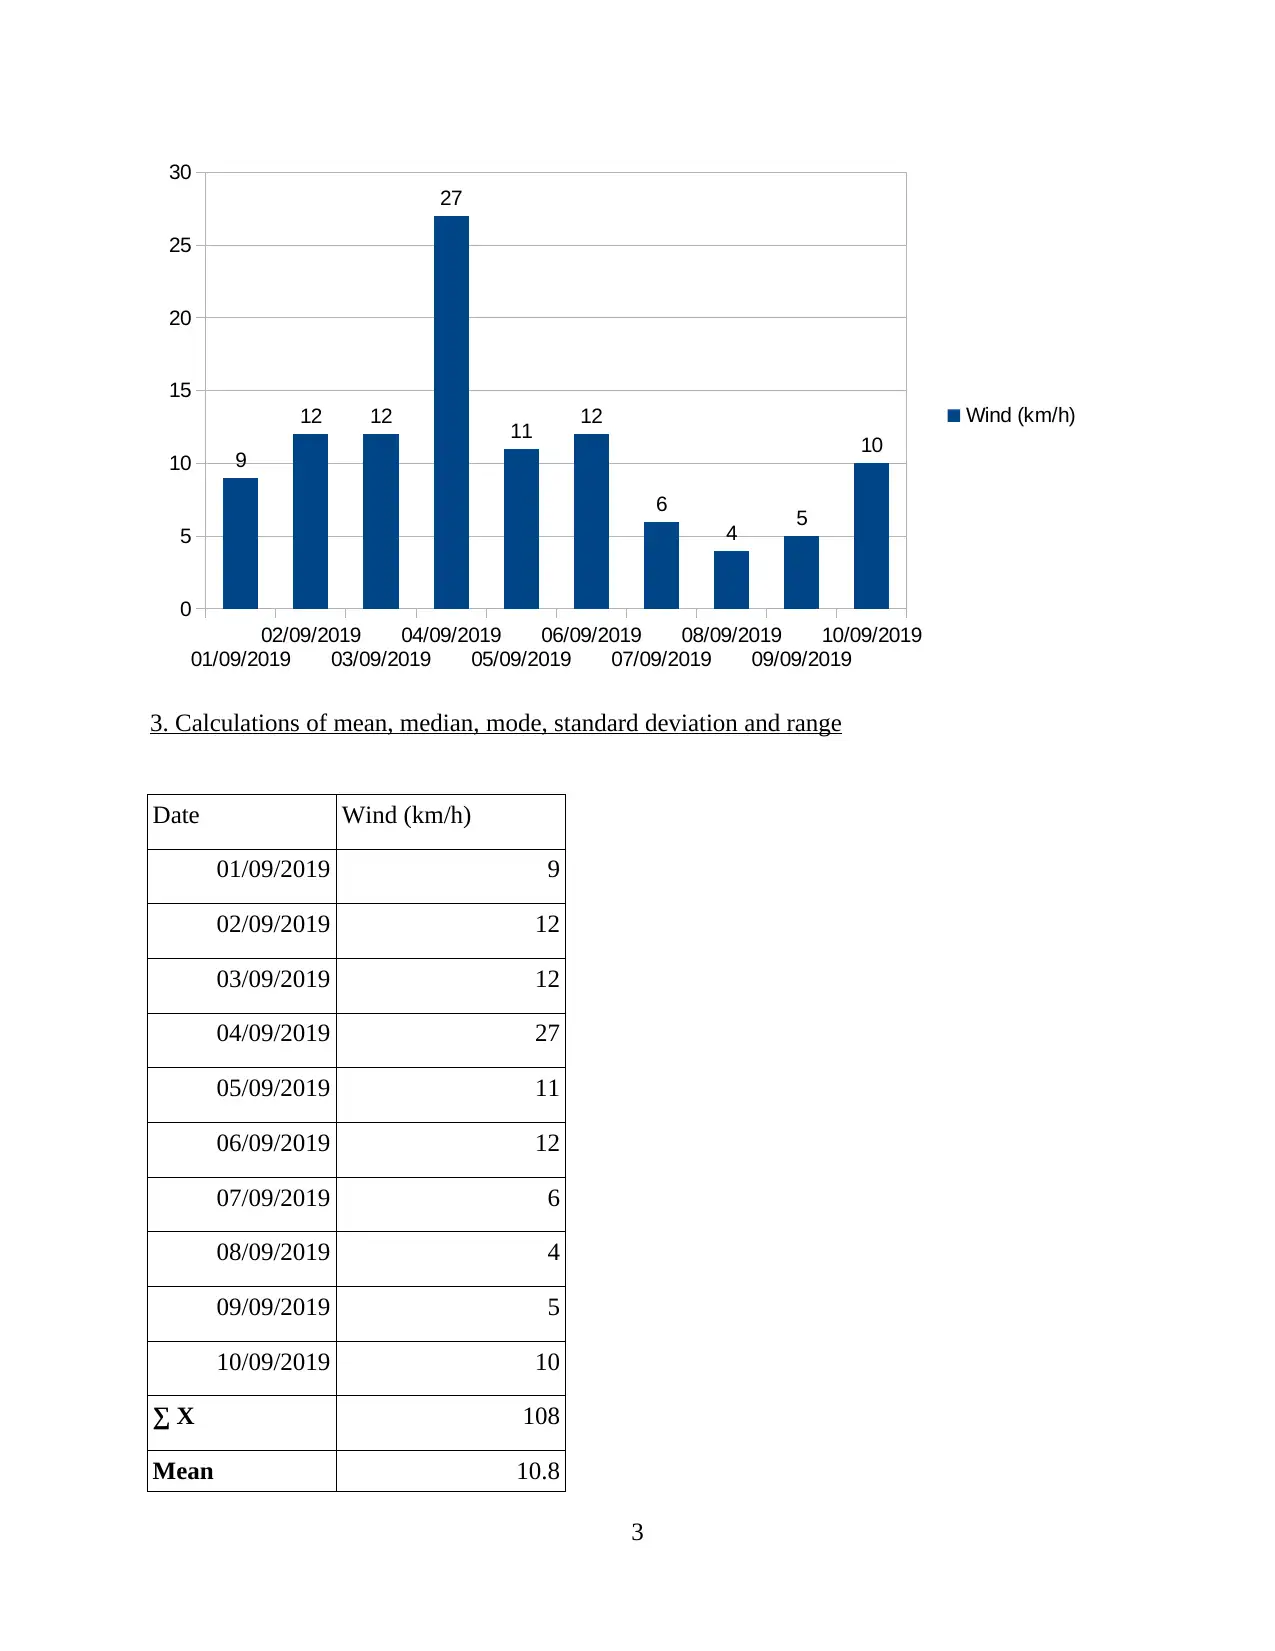
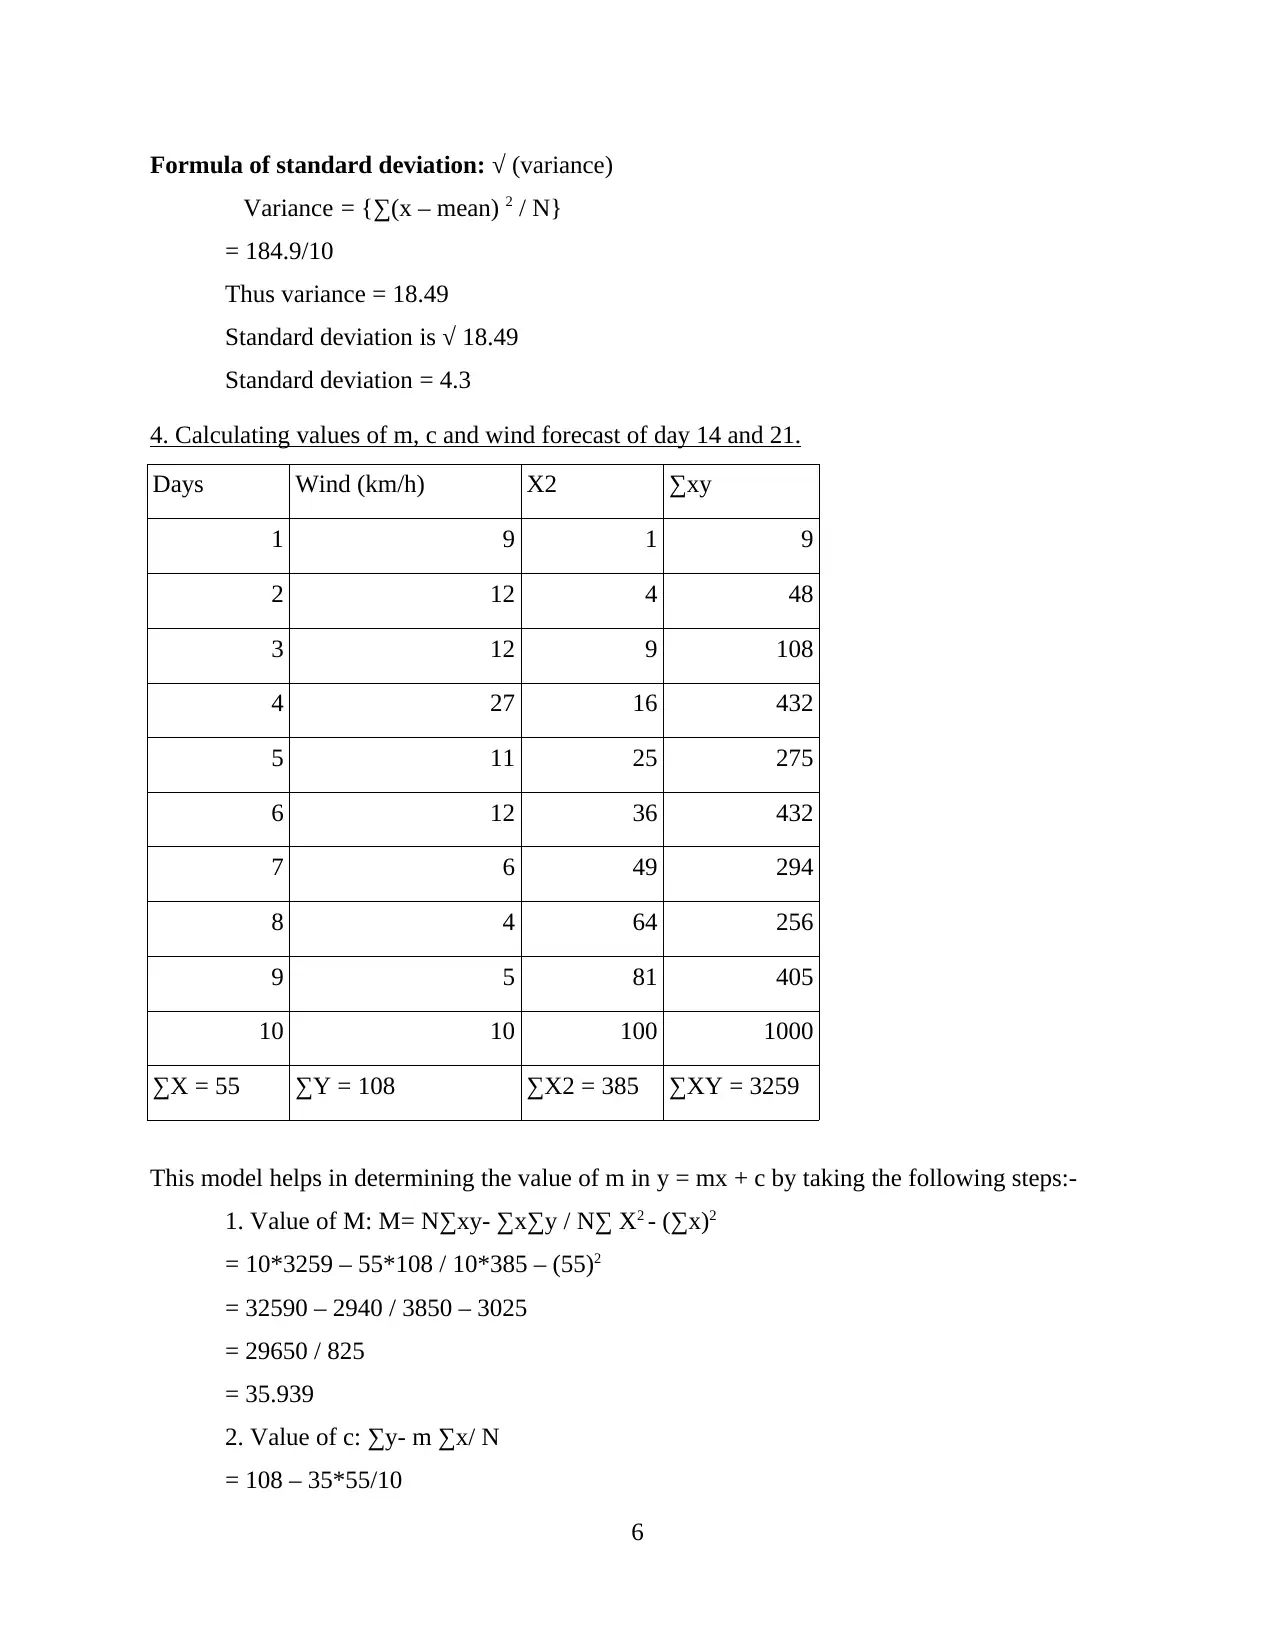
Calculating values of m, c and wind forecast of day 14 and 21.5 CONCLUSION 6 REFERENCES 8 INTRODUCTION Numeracy and data analysis is a procedure of analysing data using analytical and logical reasoning to investigate every element of the given data. Representation of data in tabular form As per the below table presented wind speed for the month of September, 2019 for 10 consecutive date (Wind speed of Manchester, 2019) |Date |Wind (km/h) (18 Pm) | |
tabler-icon-diamond-filled.svg

Contribute Materials

Your contribution can guide someone’s learning journey. Share your documents today.
Document Page
Numeracy And
Data Analysis
tabler-icon-diamond-filled.svg

Secure Best Marks with AI Grader

Need help grading? Try our AI Grader for instant feedback on your assignments.
Document Page
Table of Contents
INTRODUCTION...........................................................................................................................1
MAIN BODY...................................................................................................................................1
1. Representation of data in tabular form...............................................................................1
2. Data representation in charts..............................................................................................1
3. Calculations of mean, median, mode, standard deviation and range.................................3
4. Calculating values of m, c and wind forecast of day 14 and 21.........................................5
CONCLUSION................................................................................................................................6
REFERENCES................................................................................................................................8
Document Page
INTRODUCTION
Numeracy and data analysis is a procedure of analysing data using analytical and logical
reasoning to investigate every element of the given data. For data analysis using different facets
and approaches with diverse technique (Conoyer, Foegen and Lembke, 2016). The data analysis
mainly categorised into descriptive analysis, exploratory data analysis and confirmatory data
analysis. Data from different sources are collected, evaluated and then evaluated to create any
kind of theory or discovering. The presented report based on the data analysis of wind speed of
Manchester for 10 days. In the report consist of numeric and chart information, calculation of
mean, mode & median. Along with compute rage, standard deviation and utilization of m and c.
MAIN BODY
1. Representation of data in tabular form
As per the below table presented wind speed for the month of September, 2019 for 10
consecutive date (Wind speed of Manchester, 2019)
Date Wind (km/h) (18 Pm)
01/09/19 9
02/09/19 12
03/09/19 12
04/09/19 27
05/09/19 11
06/09/19 12
07/09/19 6
08/09/19 4
09/09/19 5
10/09/19 10
1
Document Page
2. Data representation in charts
Bar Graph: A bar graph is a visual representation of statistics where the integrand can
only achieve those separate outcomes. It is a mathematical representation of data and utilised to
present comparison between categories of data.
01/09/2019
02/09/2019
03/09/2019
04/09/2019
05/09/2019
06/09/2019
07/09/2019
08/09/2019
09/09/2019
10/09/2019
0 5 10 15 20 25 30
9
12
12
27
11
12
6
4
5
10
Wind (km/h)
As per the above chart, it has been analysed that on 4 September 2019, highest wind flow
was recorded that is about 27 Km/h. While the lowest wind flow was marked on 8 September
2019.
Column Chart: The particular chart utilised for comparison the value of several
collection through different vertical bar. It is a graphic presentation where numerical values are
illustrated with horizontal columns. These column graph are particularly effective for presenting
amounts which are classified by two characteristics like year and sector. It is best to utilised for a
period of moment for data sets visualisation (Tan and Bogomolova, 2016).
2
tabler-icon-diamond-filled.svg

Secure Best Marks with AI Grader

Need help grading? Try our AI Grader for instant feedback on your assignments.
Document Page
01/09/2019
02/09/2019
03/09/2019
04/09/2019
05/09/2019
06/09/2019
07/09/2019
08/09/2019
09/09/2019
10/09/2019
0
5
10
15
20
25
30
9
12 12
27
11 12
6
4 5
10
Wind (km/h)
3. Calculations of mean, median, mode, standard deviation and range
Date Wind (km/h)
01/09/2019 9
02/09/2019 12
03/09/2019 12
04/09/2019 27
05/09/2019 11
06/09/2019 12
07/09/2019 6
08/09/2019 4
09/09/2019 5
10/09/2019 10
X 108
Mean 10.8
3
Document Page
Median 10.8
Mode 12
Range 23
Maximum
range 27
Minimum 4
STDEV 6.4429116951
Mean – It is connected with average that utilised to receive the data's from arithmetic
mean. It is computed by adding sum of the analytical data then divide the total by the value of
points.
Formula of mean
∑ X / N
= 108 / 10
= 10.8
Mode – The model valuation is characterized in a separate disorganized differential
sequence as the commonly occurring worth. The mode is a quantitative word referring to the
amount that occurs most commonly in a quantity collection. The mode is discovered by
gathering and arranging information to compute every outcome's occurrence (Williamson, 2016).
As per the collected data of Wind speed the mode value is 12 Km/h.
Median - The median is the central position in a list of values arranged, increasing or
decreasing and may be more meaningful than the estimate of that collection of information. It is
applied to analysis of an appropriate average or mean but is not be baffled with actual mean.
Formula of median:
When data series is odd= ( N +1 ) / 2
When data series is even= (N / 2)
Thus the median value is 10 km/h.
4
Document Page
Range - A function's range is the collection of results that the feature accomplishes when
introduced to its entire budget group.
Formula of range:
Max – Min
= 27 - 4
= 23
Standard Deviation – It is a statics that measures the distribution of a dataset in relation
to its mean and is computed as square root of the variance. Standard deviation computed as the
square root then analysing of fluctuation among the data that connects to mean (Logan and
Lowrie, 2017).
Formula of standard deviation
Dates Wind (km/h) x- mean (x-m)2
01/09/2019 9 -14.6 213.16
02/09/2019 12 -11.6 134.56
03/09/2019 12 -11.6 134.56
04/09/2019 27 3.4 11.56
05/09/2019 11 -12.6 158.76
06/09/2019 12 -11.6 134.56
07/09/2019 6 -17.6 309.76
08/09/2019 4 -19.6 384.16
09/09/2019 5 -18.6 345.96
10/09/2019 10 -13.6 184.96
2012
Mean 10.8
Variance 201.2
STDEV 14.1844985812
5
tabler-icon-diamond-filled.svg

Paraphrase This Document

Need a fresh take? Get an instant paraphrase of this document with our AI Paraphraser
Document Page
Formula of standard deviation: √ (variance)
Variance = {∑(x – mean) 2 / N}
= 184.9/10
Thus variance = 18.49
Standard deviation is √ 18.49
Standard deviation = 4.3
4. Calculating values of m, c and wind forecast of day 14 and 21.
Days Wind (km/h) X2 ∑xy
1 9 1 9
2 12 4 48
3 12 9 108
4 27 16 432
5 11 25 275
6 12 36 432
7 6 49 294
8 4 64 256
9 5 81 405
10 10 100 1000
∑X = 55 ∑Y = 108 ∑X2 = 385 ∑XY = 3259
This model helps in determining the value of m in y = mx + c by taking the following steps:-
1. Value of M: M= N∑xy- ∑x∑y / N∑ X2 - (∑x)2
= 10*3259 – 55*108 / 10*385 – (55)2
= 32590 – 2940 / 3850 – 3025
= 29650 / 825
= 35.939
2. Value of c: ∑y- m ∑x/ N
= 108 – 35*55/10
6
Document Page
= - 84.5 or (84)
3. With the help of calculated 'm' and 'c' values wind speed is forecasted
Forecast wind for 14 day Y= mx+c
Y = 35*14 + (-84)
Y = 490 – 84
Y = 406/24 hours = 16.91
So there is calculating forecast value of 14 is 16.91 or 17 km/h
Forecast wind for 21: Y = mx + c
Y = 35*21 + (-84)
Y = 735 – 84
Y = 651/24 hours = 27.125
So there is amount of 21 is 27.125 or 27 km/h
CONCLUSION
As per the above assignment, it has been concluded that for data analysis required
different techniques to apply on data. Firstly there is identified and examine mathematical data
and pattern is achieved and categorised to easily investigate. Through data analysis calculate
value of mean, mode, median, range and standard deviation that helps in decision making
process.
7
Document Page
REFERENCES
Books and Journal
Conoyer, S. J., Foegen, A. and Lembke, E. S., 2016. Early Numeracy Indicators: Examining
Predictive Utility Across Years and States. Remedial and Special Education. 37(3).
pp.159-171.
Tan, P. J. and Bogomolova, S., 2016. A descriptive analysis of consumer’s price promotion
literacy skills. International Journal of Retail & Distribution Management. 44(12).
pp.1223-1244.
Williamson, B., 2016. Digital education governance: data visualization, predictive analytics, and
‘real-time’policy instruments. Journal of Education Policy. 31(2). pp.123-141.
Logan, T. and Lowrie, T., 2017. Gender perspectives on spatial tasks in a national assessment: A
secondary data analysis. Research in Mathematics Education. 19(2). pp.199-216.
Online
Wind speed of Manchester. 2019. [Online]. Available through:
<https://www.timeanddate.com/weather/uk/manchester/historic?month=9&year=2019>
8
chevron_up_icon
1 out of 10
circle_padding
hide_on_mobile
zoom_out_icon
[object Object]

Your All-in-One AI-Powered Toolkit for Academic Success.

Available 24*7 on WhatsApp / Email

[object Object]