Numeracy and Data Analysis Report: Manchester Wind Speed Data
VerifiedAdded on 2021/02/20
|10
|1453
|333
Report
AI Summary
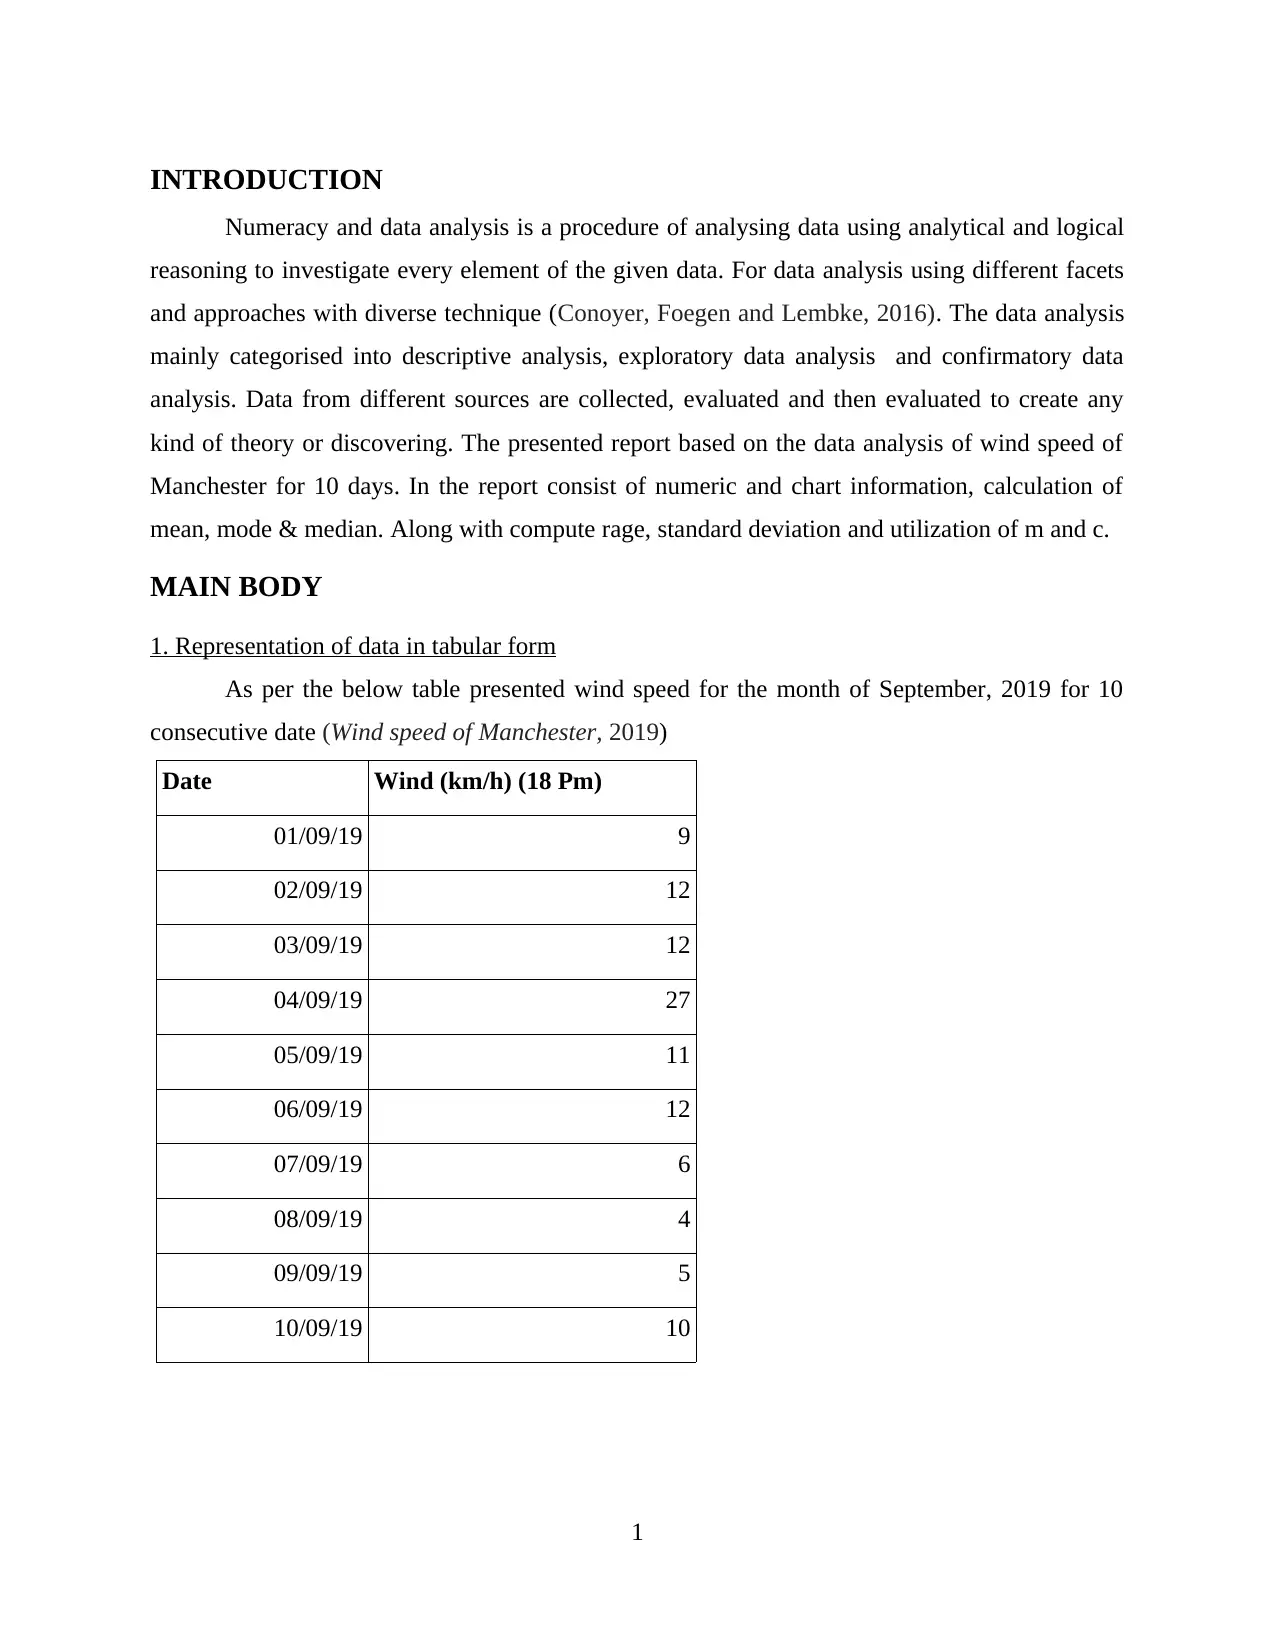
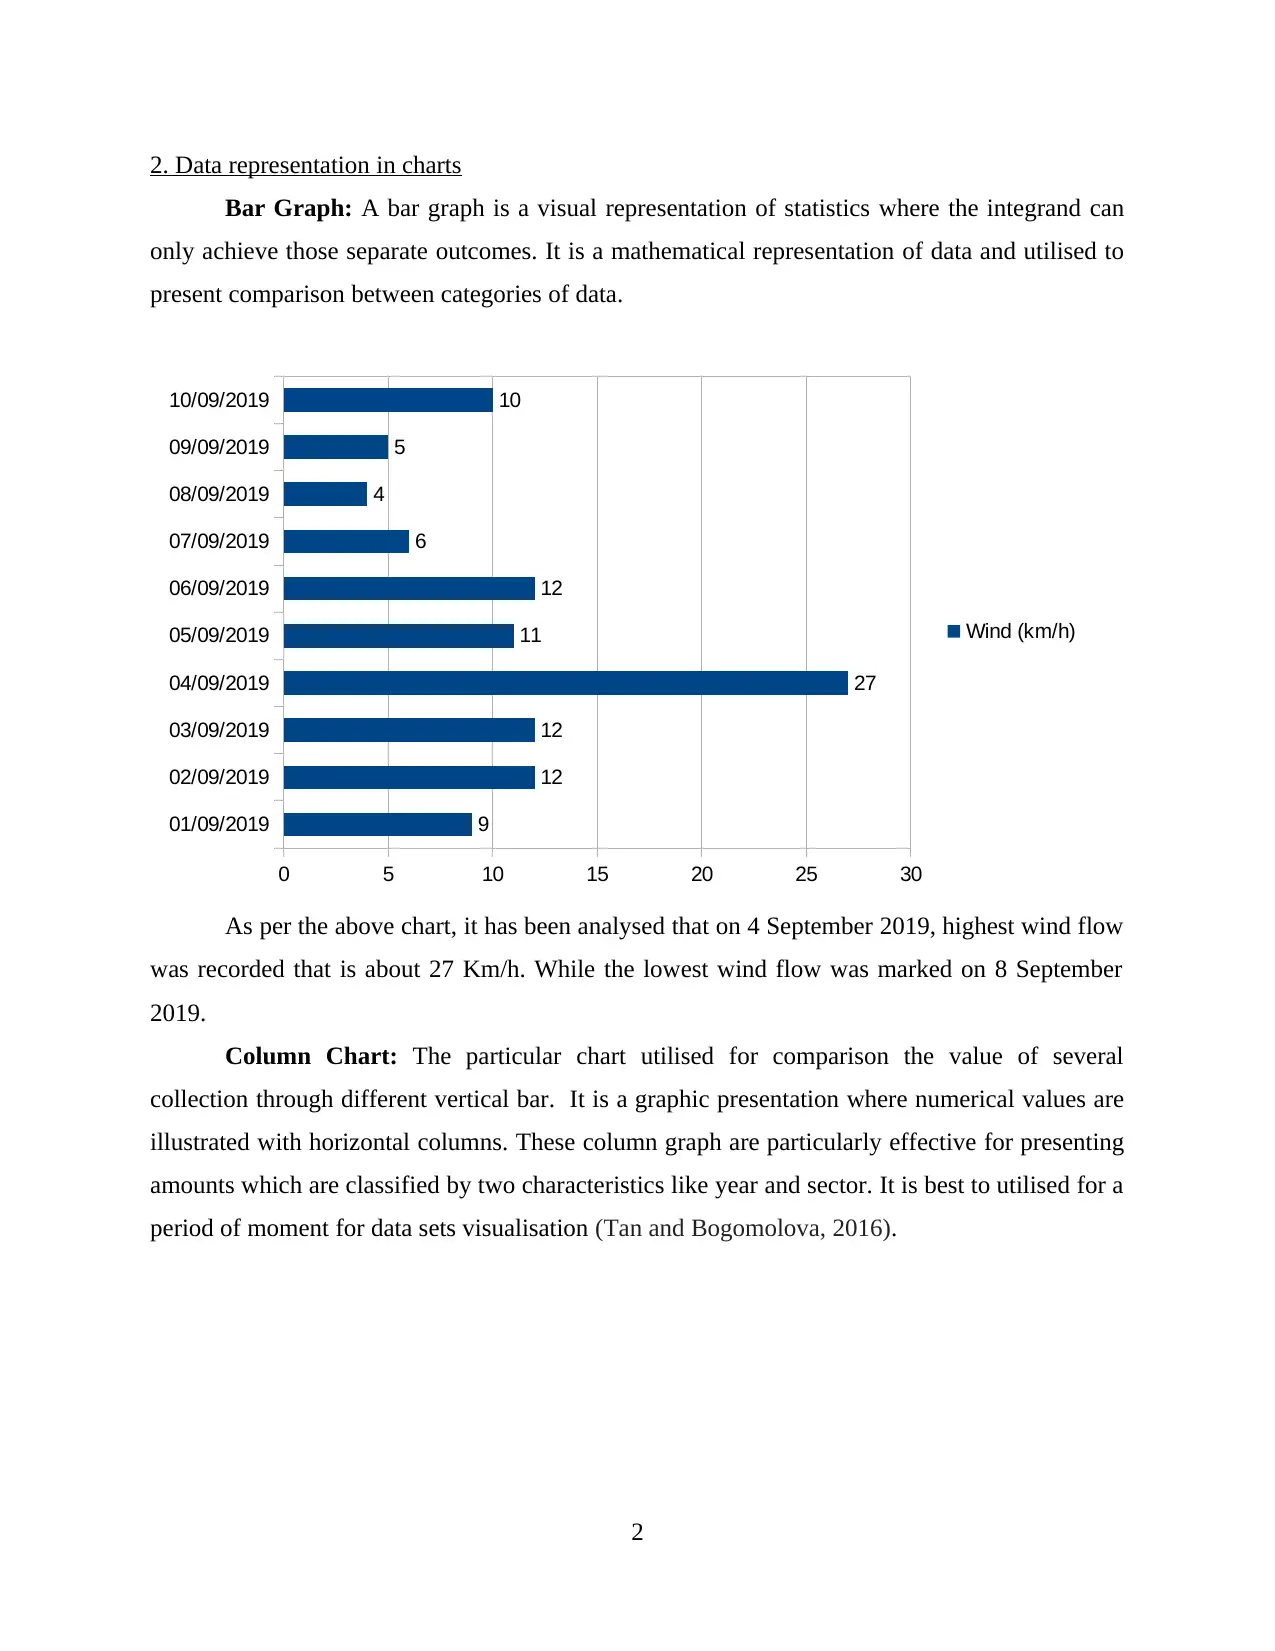
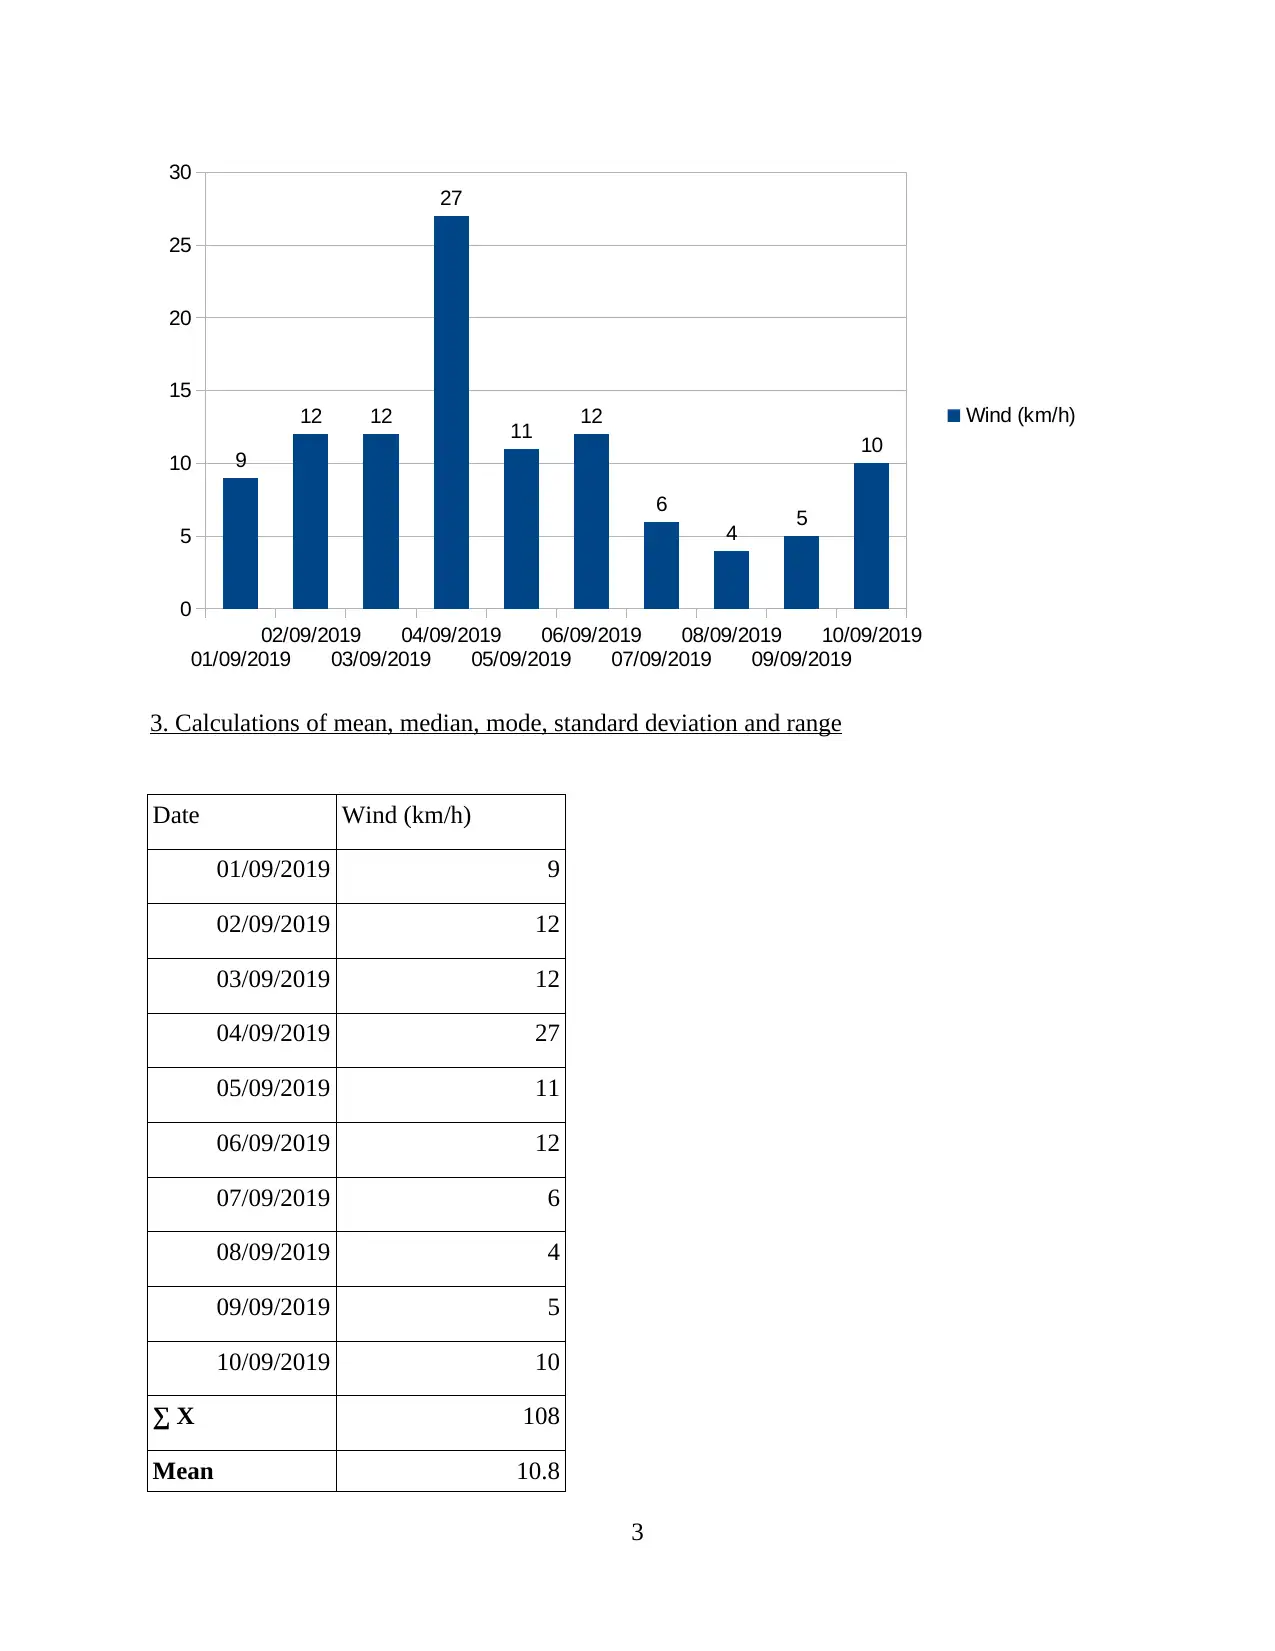
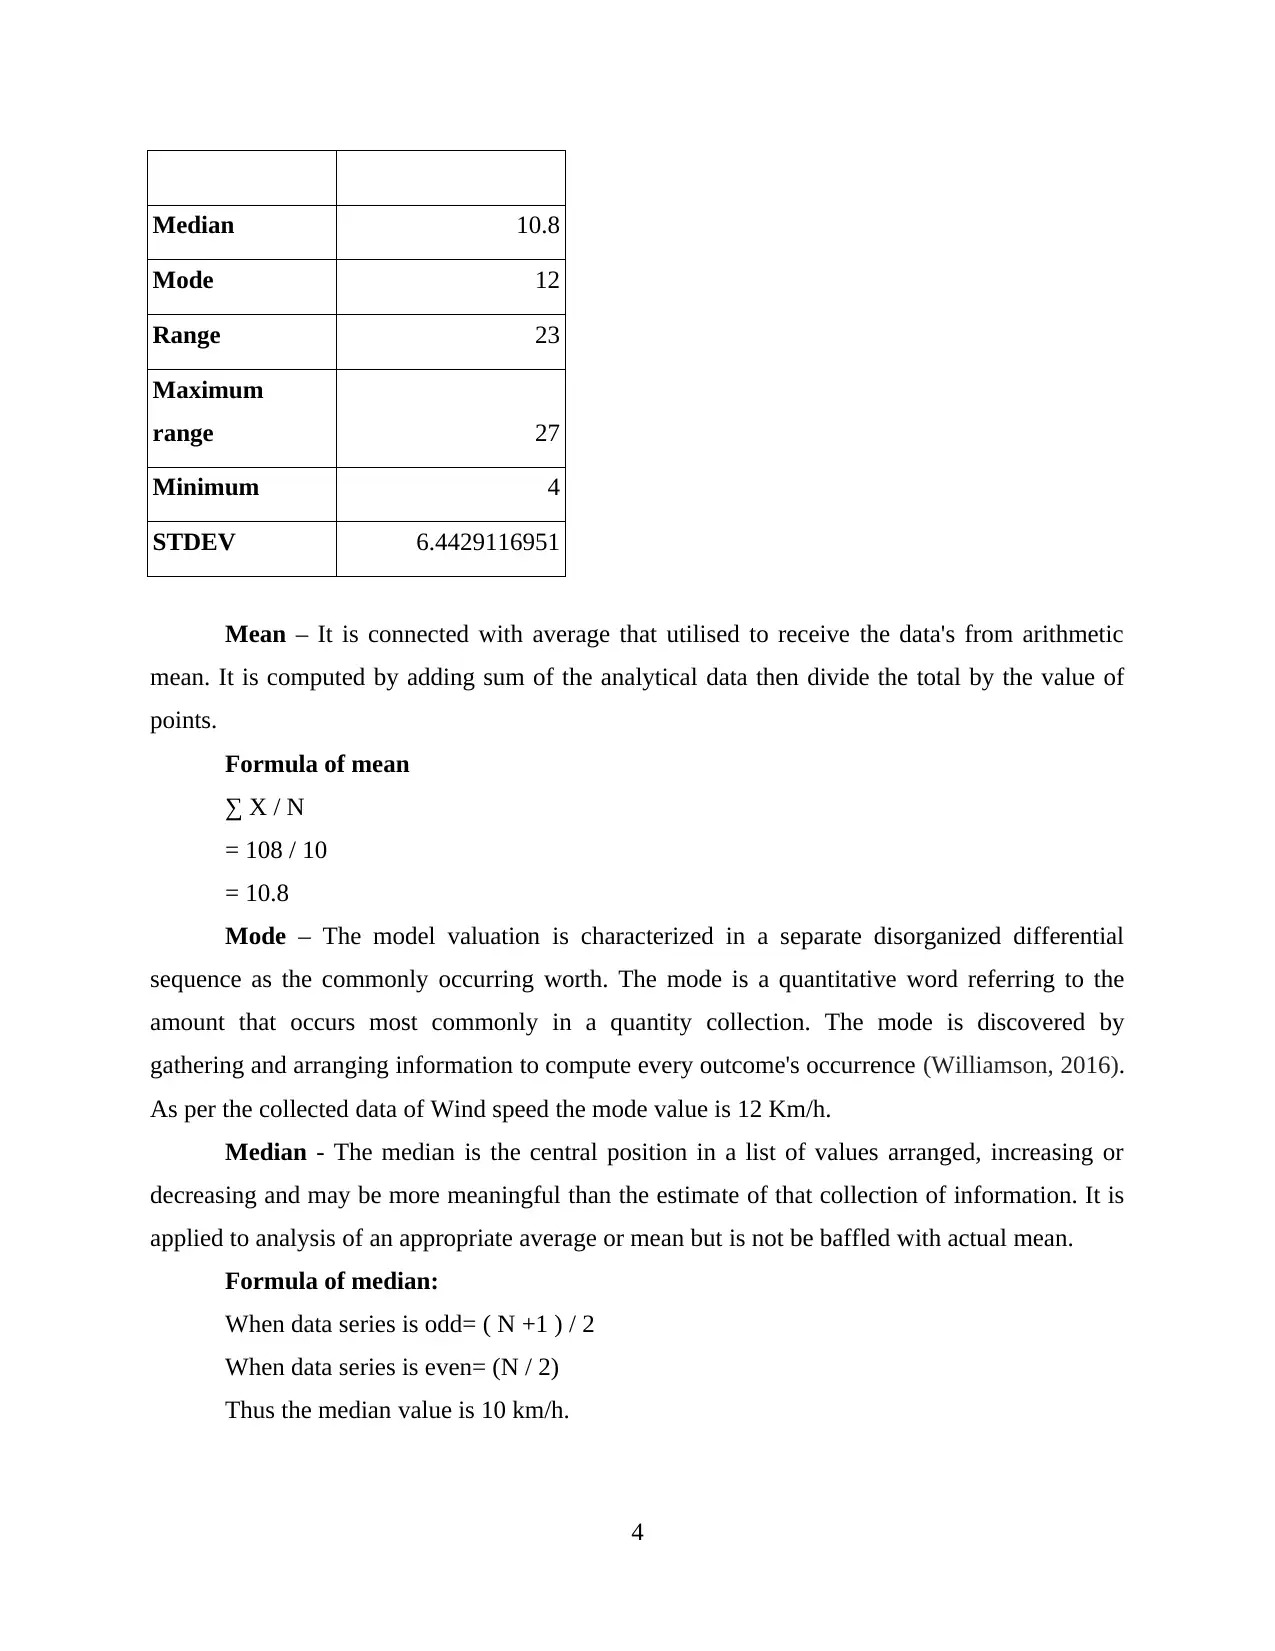
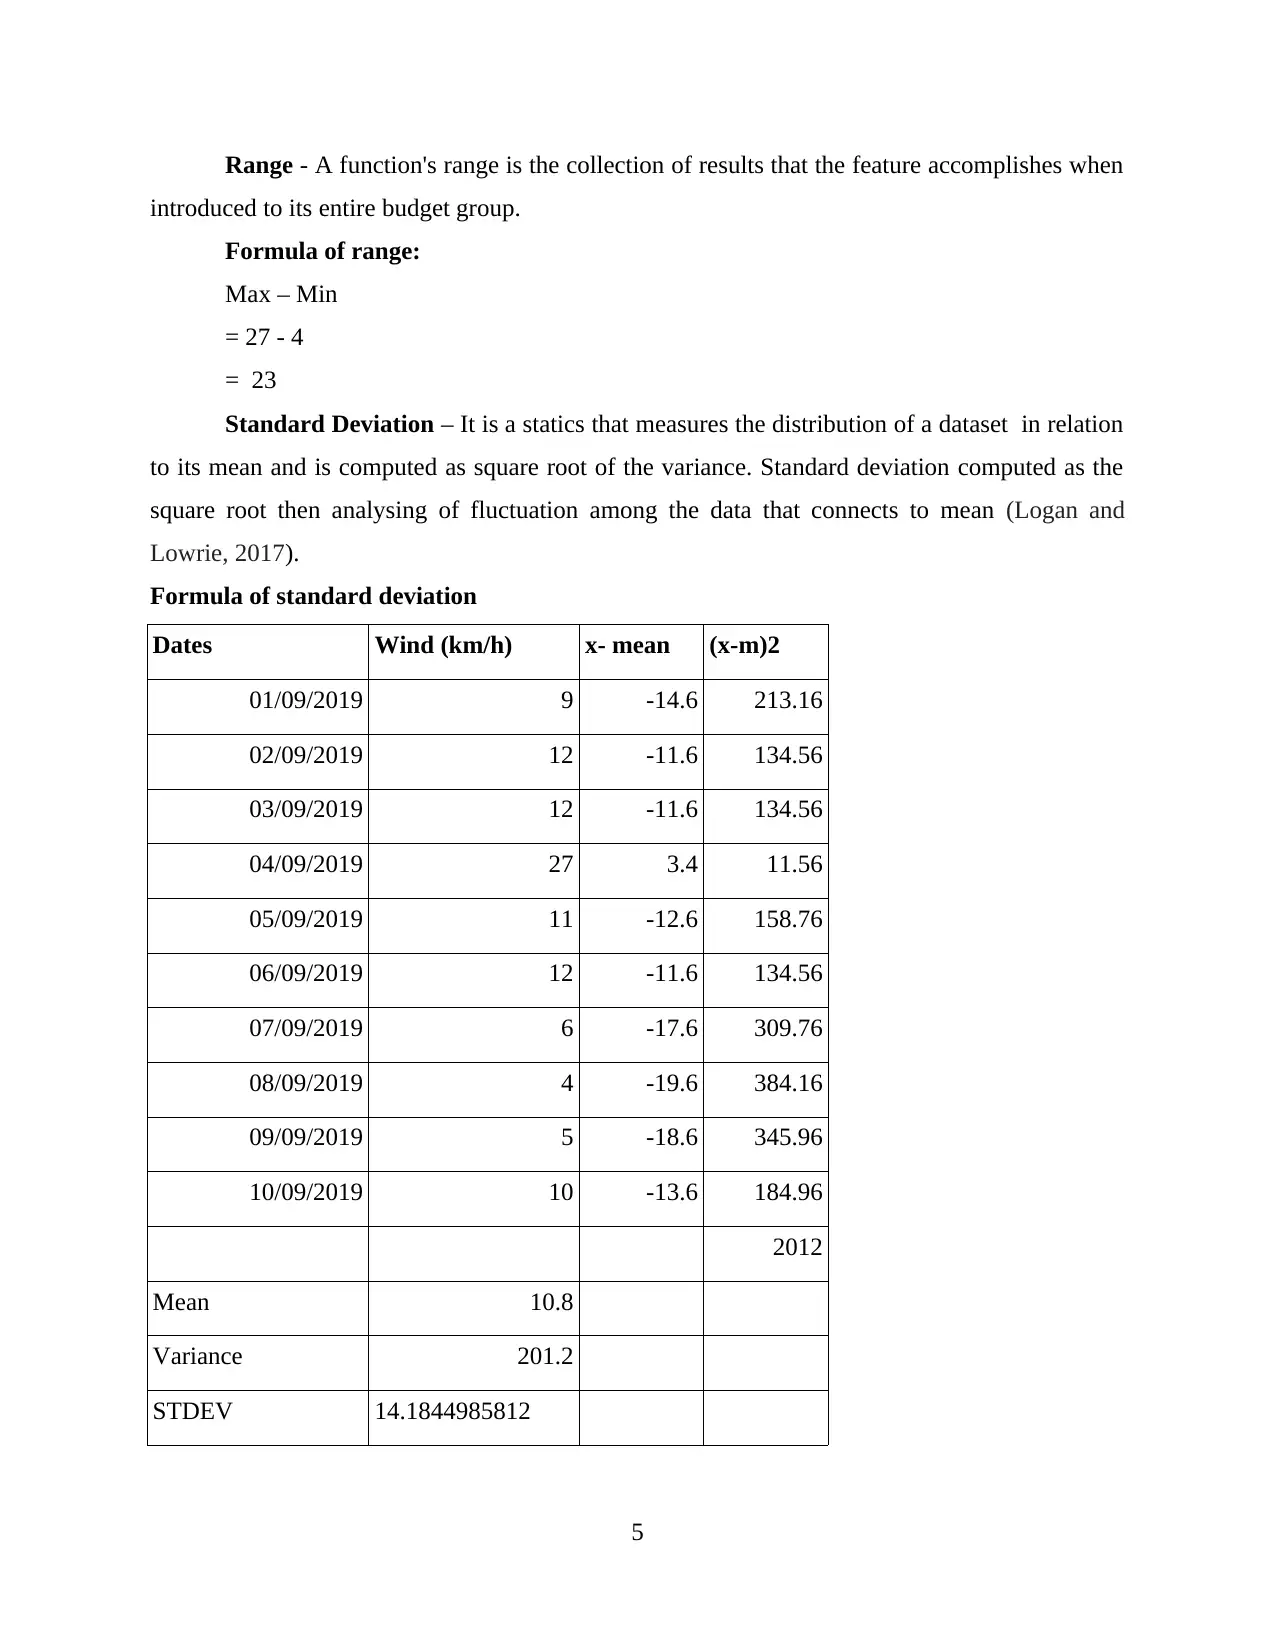
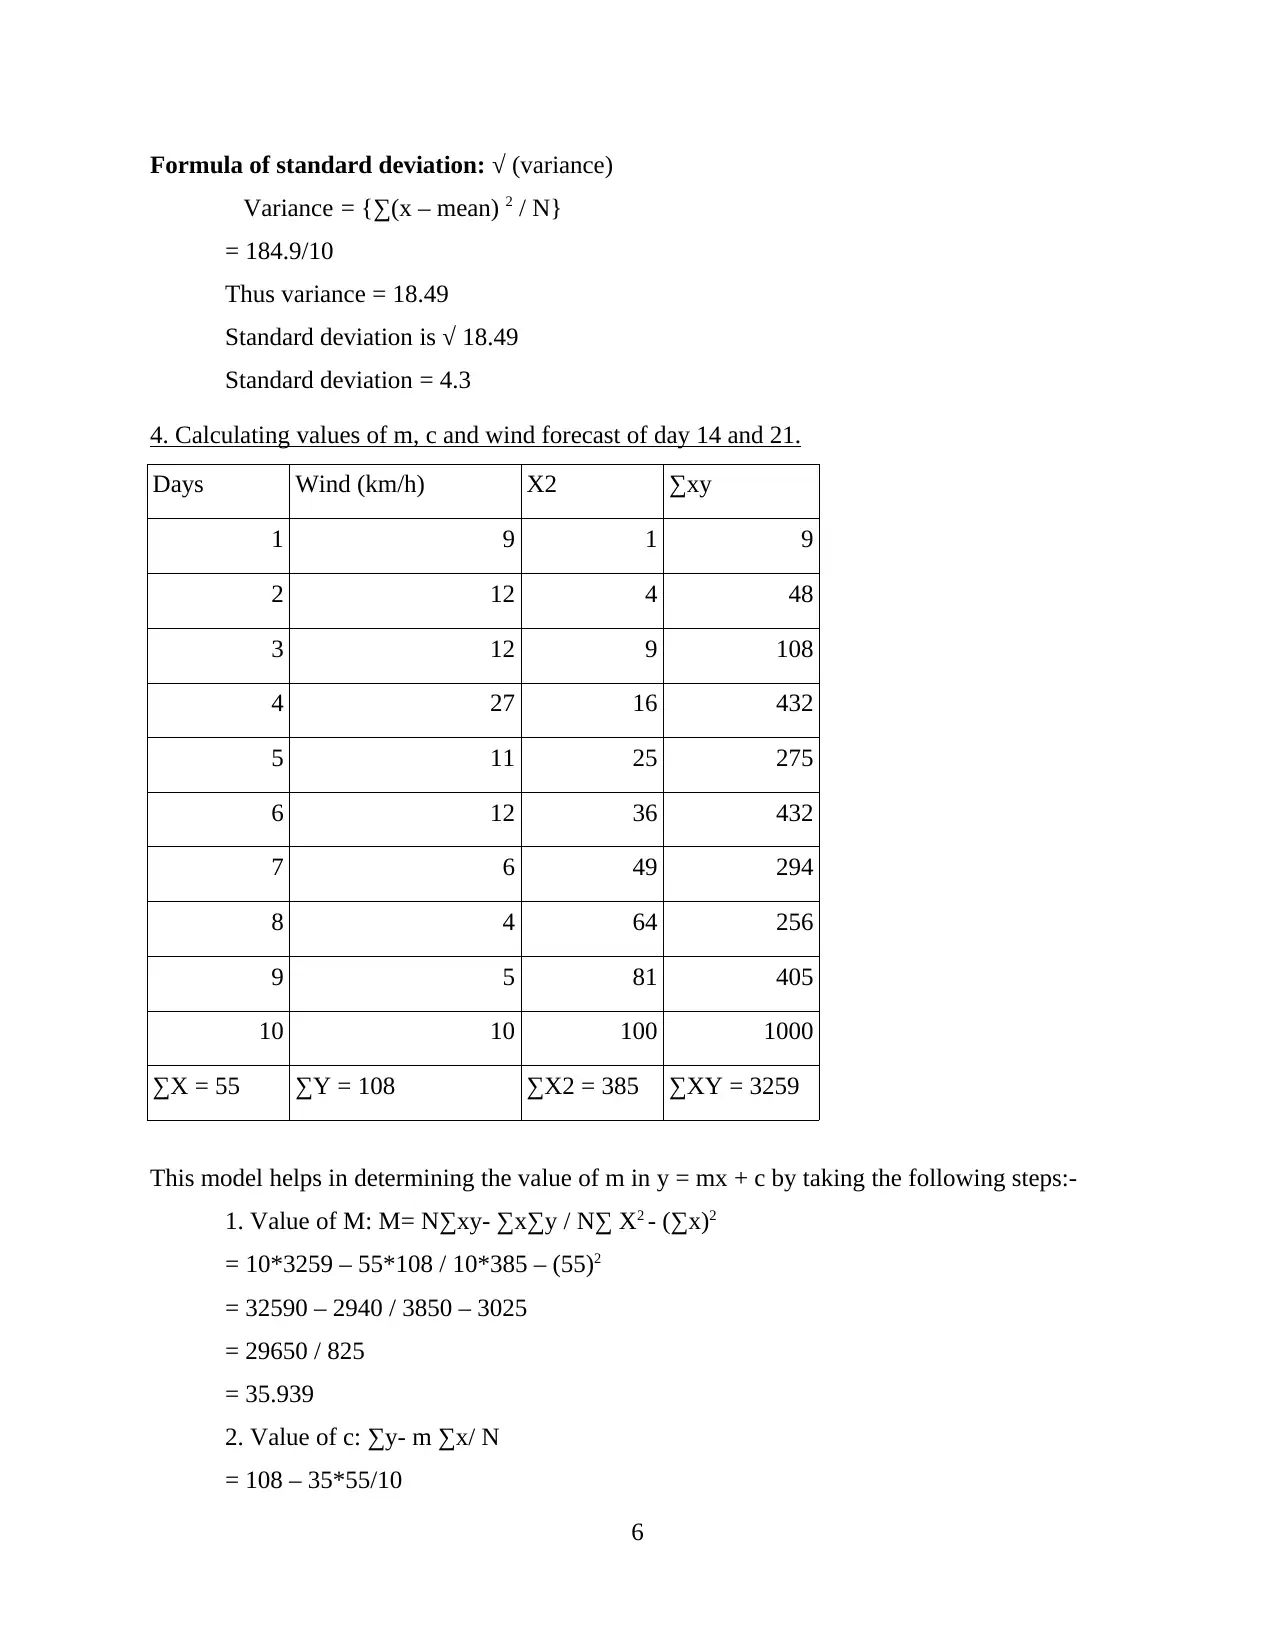
This report provides a comprehensive analysis of Manchester wind speed data for September 2019. It begins with an introduction to numeracy and data analysis, explaining different facets and techniques. The main body presents the data in tabular form and utilizes both bar and column charts for visual representation. The report then delves into detailed calculations of key statistical measures, including mean, median, mode, range, and standard deviation. Furthermore, it demonstrates the calculation of 'm' and 'c' values to forecast wind speed for days 14 and 21, providing the forecasted wind speeds for those dates. The report concludes by summarizing the findings and referencing the sources used. This report is designed to help students understand data analysis techniques and their practical application.
1 out of 10
Related Documents


Your All-in-One AI-Powered Toolkit for Academic Success.
+13062052269
info@desklib.com
Available 24*7 on WhatsApp / Email
![[object Object]](/_next/static/media/star-bottom.7253800d.svg)
Copyright © 2020–2026 A2Z Services. All Rights Reserved. Developed and managed by ZUCOL.