Numeracy and Data Analysis
Added on 2023-01-11
8 Pages1349 Words23 Views
Numeracy and Data
Analysis
Analysis
Contents
Contents...........................................................................................................................................2
INTRODUCTION...........................................................................................................................3
TASK...............................................................................................................................................3
Arranged data in table format:.....................................................................................................3
Presentation of chosen data through multiple graphs:.................................................................3
Calculation and discussion on following aspects:.......................................................................5
Linear forecasting model which is y = mx + c in order to do below mentioned calculations:....6
CONCLUSION................................................................................................................................7
REFERENCES................................................................................................................................8
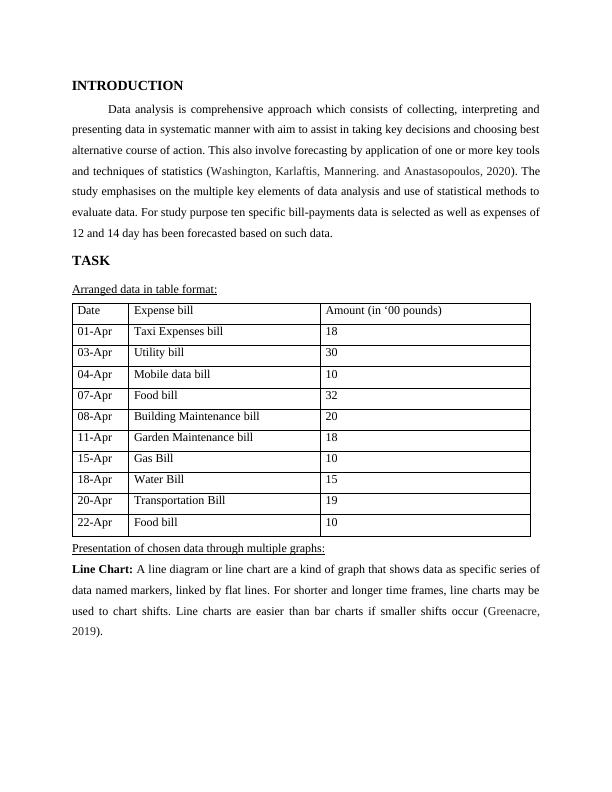
INTRODUCTION
Data analysis is comprehensive approach which consists of collecting, interpreting and
presenting data in systematic manner with aim to assist in taking key decisions and choosing best
alternative course of action. This also involve forecasting by application of one or more key tools
and techniques of statistics (Washington, Karlaftis, Mannering. and Anastasopoulos, 2020). The
study emphasises on the multiple key elements of data analysis and use of statistical methods to
evaluate data. For study purpose ten specific bill-payments data is selected as well as expenses of
12 and 14 day has been forecasted based on such data.
TASK
Arranged data in table format:
Date Expense bill Amount (in ‘00 pounds)
01-Apr Taxi Expenses bill 18
03-Apr Utility bill 30
04-Apr Mobile data bill 10
07-Apr Food bill 32
08-Apr Building Maintenance bill 20
11-Apr Garden Maintenance bill 18
15-Apr Gas Bill 10
18-Apr Water Bill 15
20-Apr Transportation Bill 19
22-Apr Food bill 10
Presentation of chosen data through multiple graphs:
Line Chart: A line diagram or line chart are a kind of graph that shows data as specific series of
data named markers, linked by flat lines. For shorter and longer time frames, line charts may be
used to chart shifts. Line charts are easier than bar charts if smaller shifts occur (Greenacre,
2019).
End of preview
Want to access all the pages? Upload your documents or become a member.
Related Documents
Numeracy and Data Analysislg...
|8
|1342
|80
Numeracy and Data Analysislg...
|9
|1316
|38
Numeracy and Data Analysislg...
|9
|1349
|301
Data Analysis Techniqueslg...
|10
|1401
|53
Numeracy and Data Analysislg...
|9
|1370
|86
Numeracy and Data Analysislg...
|8
|1335
|256