Data Analysis and Forecasting: Humidity Data and Linear Model
VerifiedAdded on 2023/01/16
|10
|1606
|73
Report
AI Summary
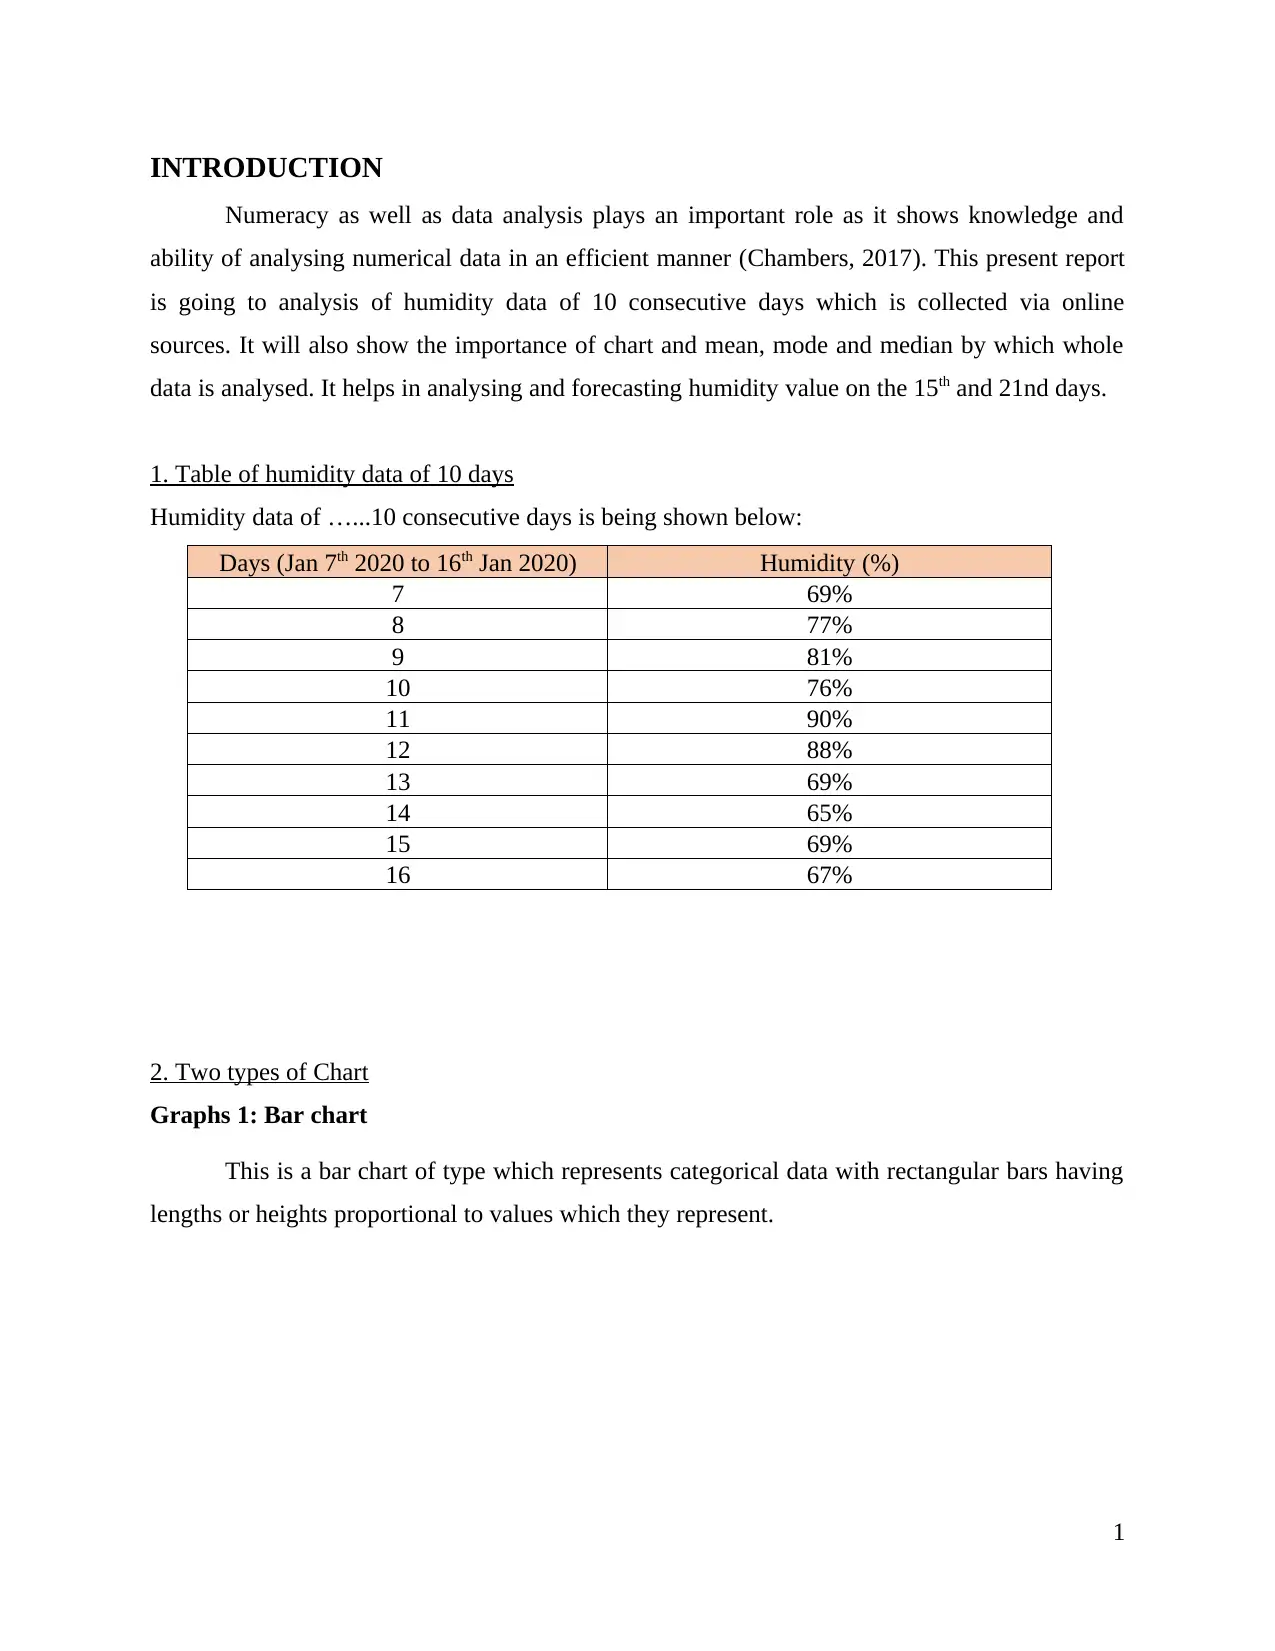
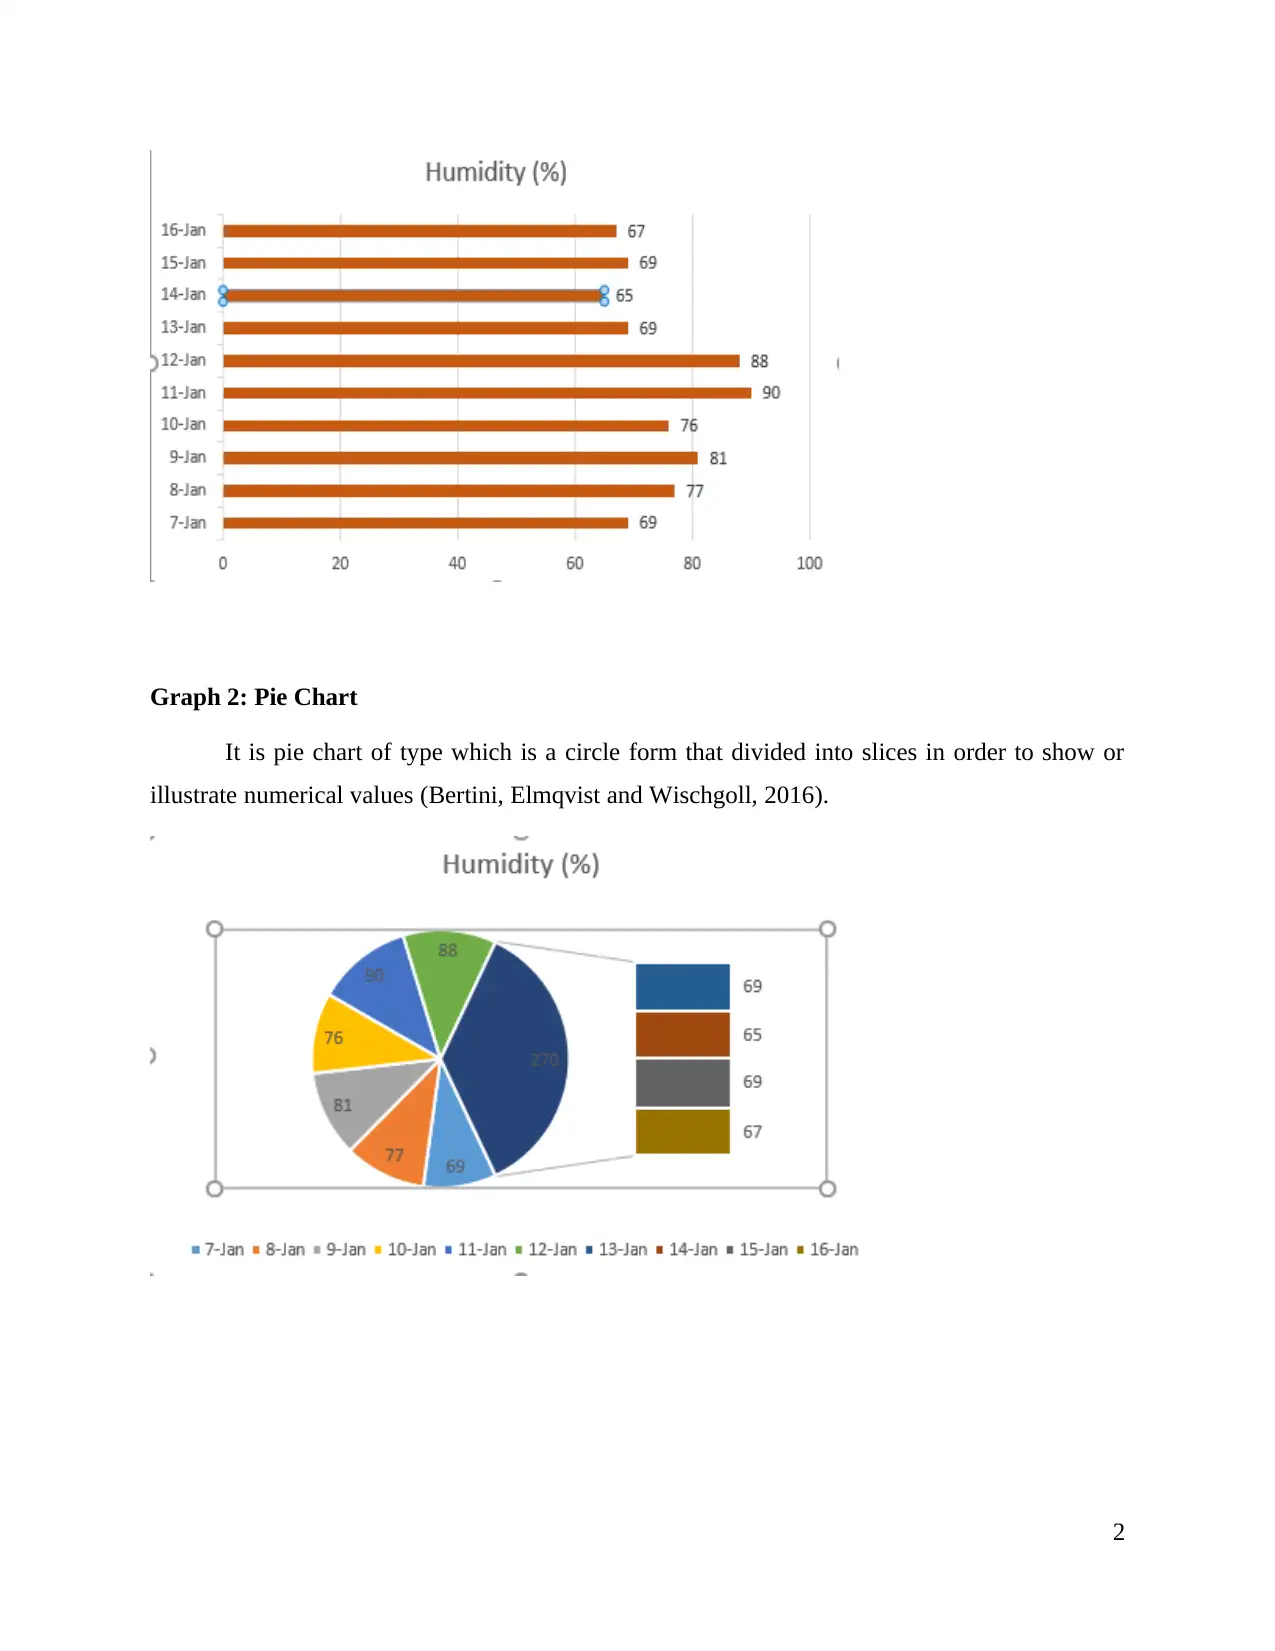
This report presents a detailed analysis of humidity data collected over ten consecutive days. It begins with a table of the raw data and then introduces two types of charts: bar charts and pie charts, for visual representation. The report proceeds to calculate and interpret key statistical measures, including the mean, median, mode, range, and standard deviation. The methodology for calculating each of these values is clearly outlined, with step-by-step instructions. The core of the report involves the application of a linear forecasting model to predict humidity levels on the 15th and 21st days. The report provides the formulas and calculations for determining the 'm' and 'c' values within the linear model, and then uses these values to forecast the expected humidity percentages for the specified future dates. The conclusion summarizes the key findings and highlights the importance of data analysis and forecasting in understanding and predicting environmental conditions. The report concludes with a list of relevant references.
1 out of 10
Related Documents


Your All-in-One AI-Powered Toolkit for Academic Success.
+13062052269
info@desklib.com
Available 24*7 on WhatsApp / Email
![[object Object]](/_next/static/media/star-bottom.7253800d.svg)
Copyright © 2020–2026 A2Z Services. All Rights Reserved. Developed and managed by ZUCOL.