Statistical Report: Analysis of Blood Pressure and Related Variables
VerifiedAdded on 2019/12/28
|32
|4225
|238
Report
AI Summary
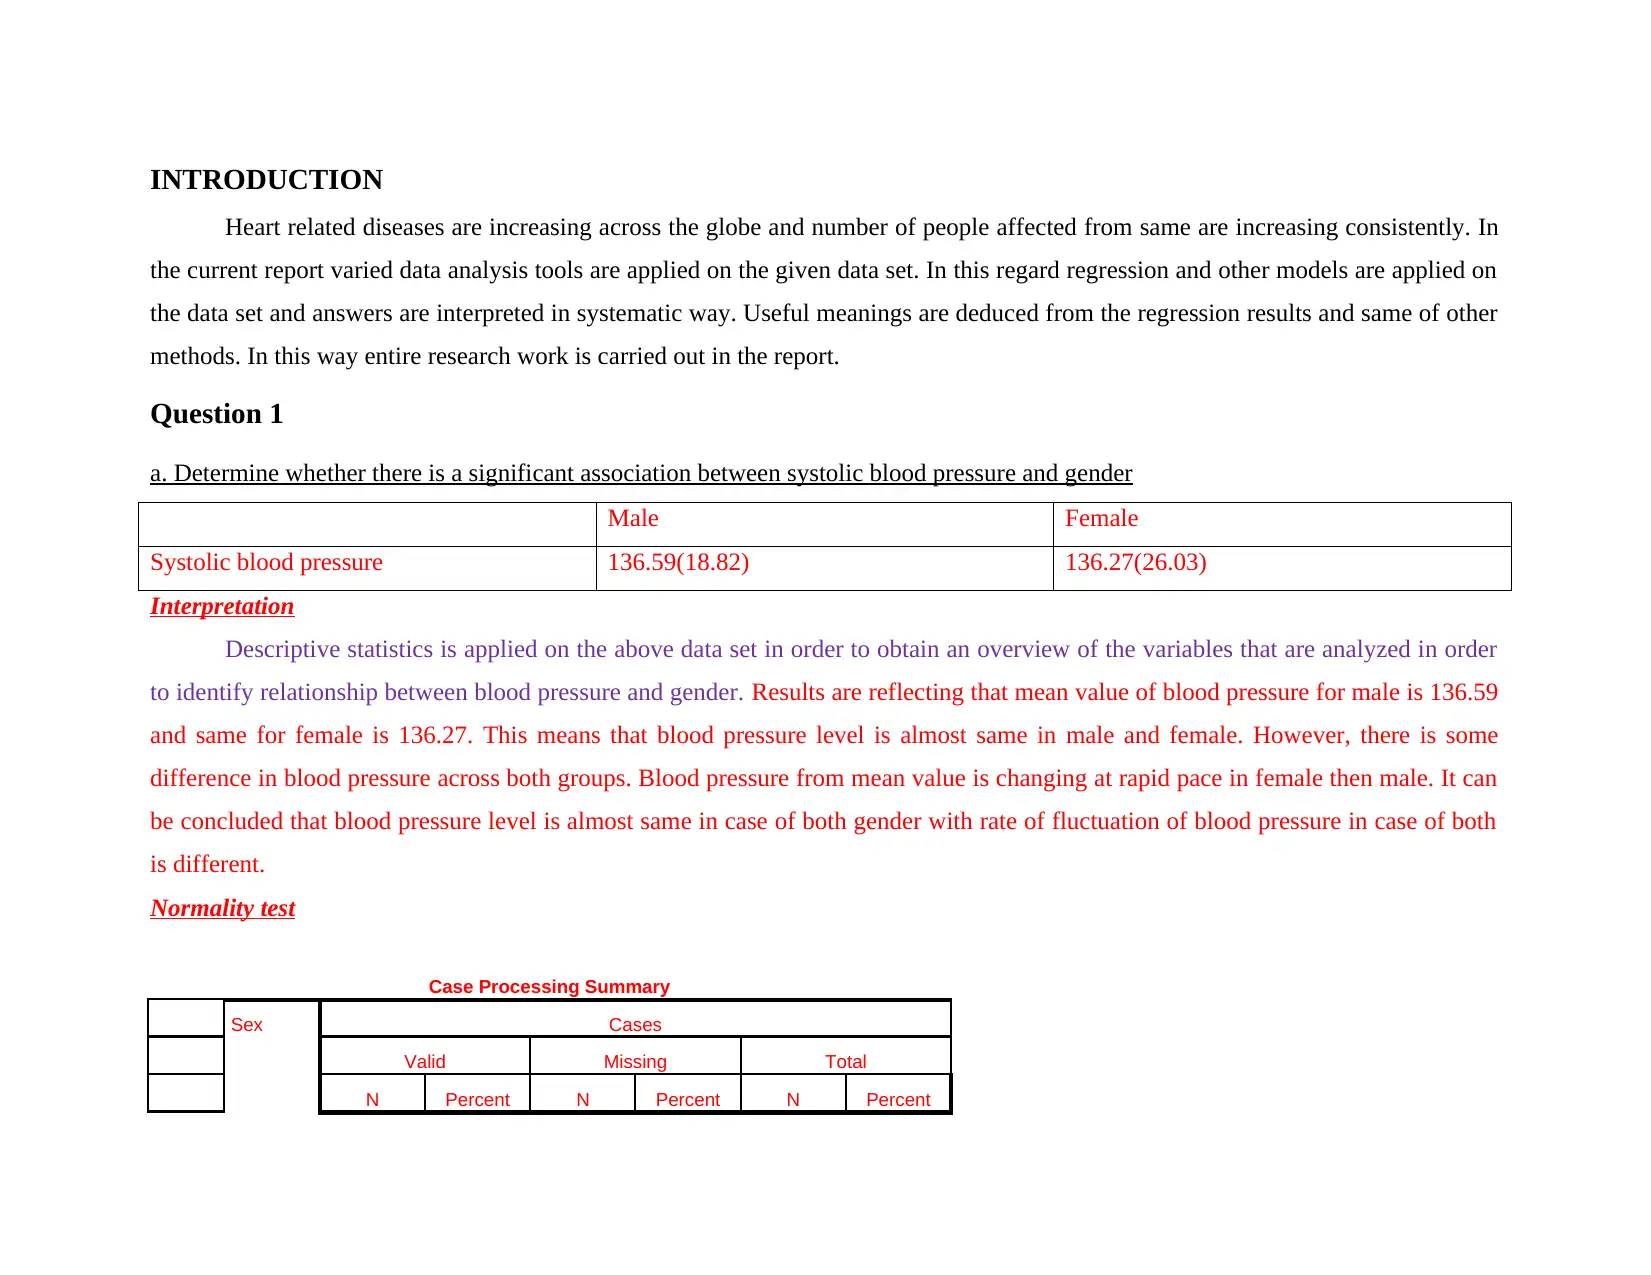
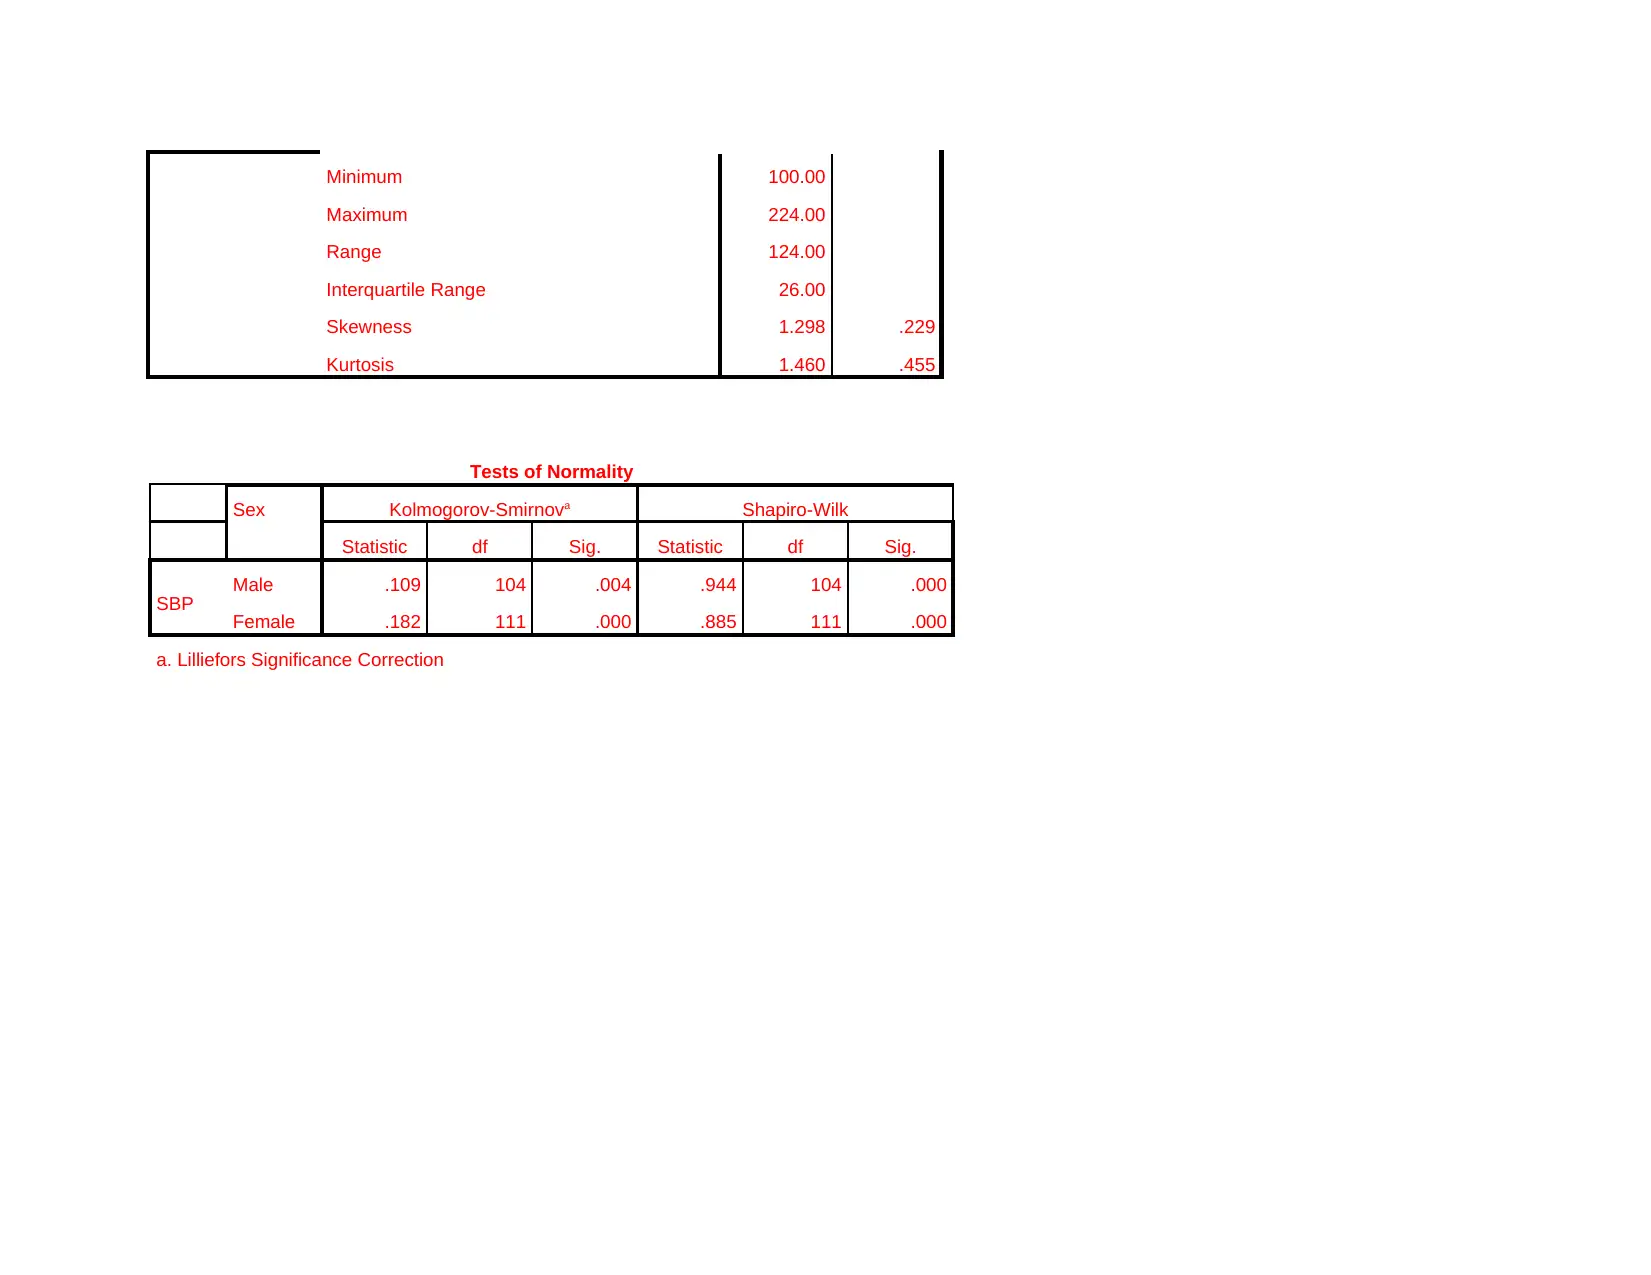
This report presents a comprehensive statistical analysis of blood pressure, employing various methods to investigate its relationships with different health factors. The analysis begins with descriptive statistics and tests for normality, exploring the association between systolic blood pressure and gender, as well as BMI categories. ANOVA and t-tests are used to determine significant differences in blood pressure across different groups. Further analysis delves into correlations between blood pressure, age, and cholesterol levels, followed by a linear regression analysis to assess the combined impact of these factors. The report also includes advanced statistical techniques such as Kaplan-Meier survival analysis, log-rank tests, and Cox regression to examine factors associated with coronary heart disease, providing a detailed interpretation of the results and their implications.
1 out of 32
Related Documents


Your All-in-One AI-Powered Toolkit for Academic Success.
+13062052269
info@desklib.com
Available 24*7 on WhatsApp / Email
![[object Object]](/_next/static/media/star-bottom.7253800d.svg)
Copyright © 2020–2026 A2Z Services. All Rights Reserved. Developed and managed by ZUCOL.