Examining Inflation Rate Trends in the UK Economy (2011-2020)
VerifiedAdded on 2023/06/13
|11
|2761
|298
Report
AI Summary
This report analyzes the movement of the inflation rate within the UK economy over the last ten years, with a particular focus on the impact of COVID-19. The study utilizes quantitative data collected from the Office for National Statistics (ONS) and other secondary sources. Descriptive statistics, including mean, median, standard deviation, and range, are applied to understand the trends and fluctuations in the UK inflation rate. The analysis reveals a surge in inflation post-COVID-19, attributed to economic recovery, increased energy costs, and supply chain issues. The report also reflects on group activities, highlighting challenges in coordination and communication, and suggests improvements for future collaborative projects. Desklib provides various study tools and resources including similar reports.
DATA ANALYSIS TOOLS
AND APPLICATION
AND APPLICATION
Paraphrase This Document
Need a fresh take? Get an instant paraphrase of this document with our AI Paraphraser
TABLE OF CONTENTS
INTRODUCTION...........................................................................................................................3
Project Aim:................................................................................................................................3
Project Objectives:......................................................................................................................3
MAIN BODY...................................................................................................................................3
Contribution to the project or methodology................................................................................3
Data Collection............................................................................................................................4
Appropriateness of data...............................................................................................................4
Data analysis...............................................................................................................................4
Appropriateness of method of presenting and visualising the data.............................................6
Conclusion drawn from the above analysis................................................................................6
Functioning of group and working differently in future.............................................................7
Reflection on group activities.....................................................................................................7
CONCLUSION................................................................................................................................8
REFERENCES................................................................................................................................9
Books and Journal.......................................................................................................................9
Online..........................................................................................................................................9
INTRODUCTION
Data analysis is the process of inspecting, cleansing, transforming and modelling with the
aim of discovering useful information and support decision-making (Osabuohien and et.al.,
2018). In the current study, the movement in inflation rate within UK economy for the last ten
years will be analysed. Further, the impact of covid-19 over the inflation rate changes will also
be analysed simultaneously.
Project Aim:
The aim of the project is to assess the movement of inflation rate within the economy of
UK for the last ten years.
Project Objectives:
To understand the concept and importance of inflation rate in economy.
To evaluate the movement of inflation rate for the last ten years within UK economy.
To identify the challenges that can arises due to change in inflation rate.
To recommend effectual strategies to deal with the issues arises after inflation rate
change.
MAIN BODY
Contribution to the project or methodology
This project is based on the evaluation of quantitative data that is, movement within the rate of
inflation in the economy of UK for the last ten years on quarterly basis for the last ten years. For
collecting, presenting and analysing this data, the following methodology is being adopted in this
project.
A quantitative data pertaining to inflation rate of last ten years on a quarterly basis has
been collected with reference to UK economy (Forbes, Kirkham and Theodoridis, 2021).
Further, to analyse this data, various statistical tools such as descriptive statistics has been used
to identify the movement or changes that are taking place within the rate of inflation in UK. To
present this data, line charts will be used to visualize the movement in inflation from last ten
years.
⊘ This is a preview!⊘
Do you want full access?
Subscribe today to unlock all pages.
Trusted by 1+ million students worldwide
Data Collection
The data regarding inflation rate percentage of UK for the last ten years is collected from ONS
i.e., office of national statistics website. Further, the data is also collected from secondary
sources such as articles, news, books and journals (Pinem, 2019).
Appropriateness of data
To ensure that the data is of higher quality, it must be appropriate to suit the intended purpose
behind its analysis. The appropriateness of data analysis can be ensured by selecting appropriate
method of its collection and source.
In this project, the secondary data related to inflation rate has been collected from ONS
(Office For National Statistics) website which is operated by UK government. The timeframe
that has been taken into consideration is last ten years which gives better insights over how
movement in inflation rate has been taking place in UK along with different factors that are
affecting or causing changes in it such as effect of recently emerged pandemic in the year 2019.
Therefore, appropriateness of data can be ensured in terms of accuracy and completeness as it is
being obtained from government based source (CPIH Annual Rate. 2021).
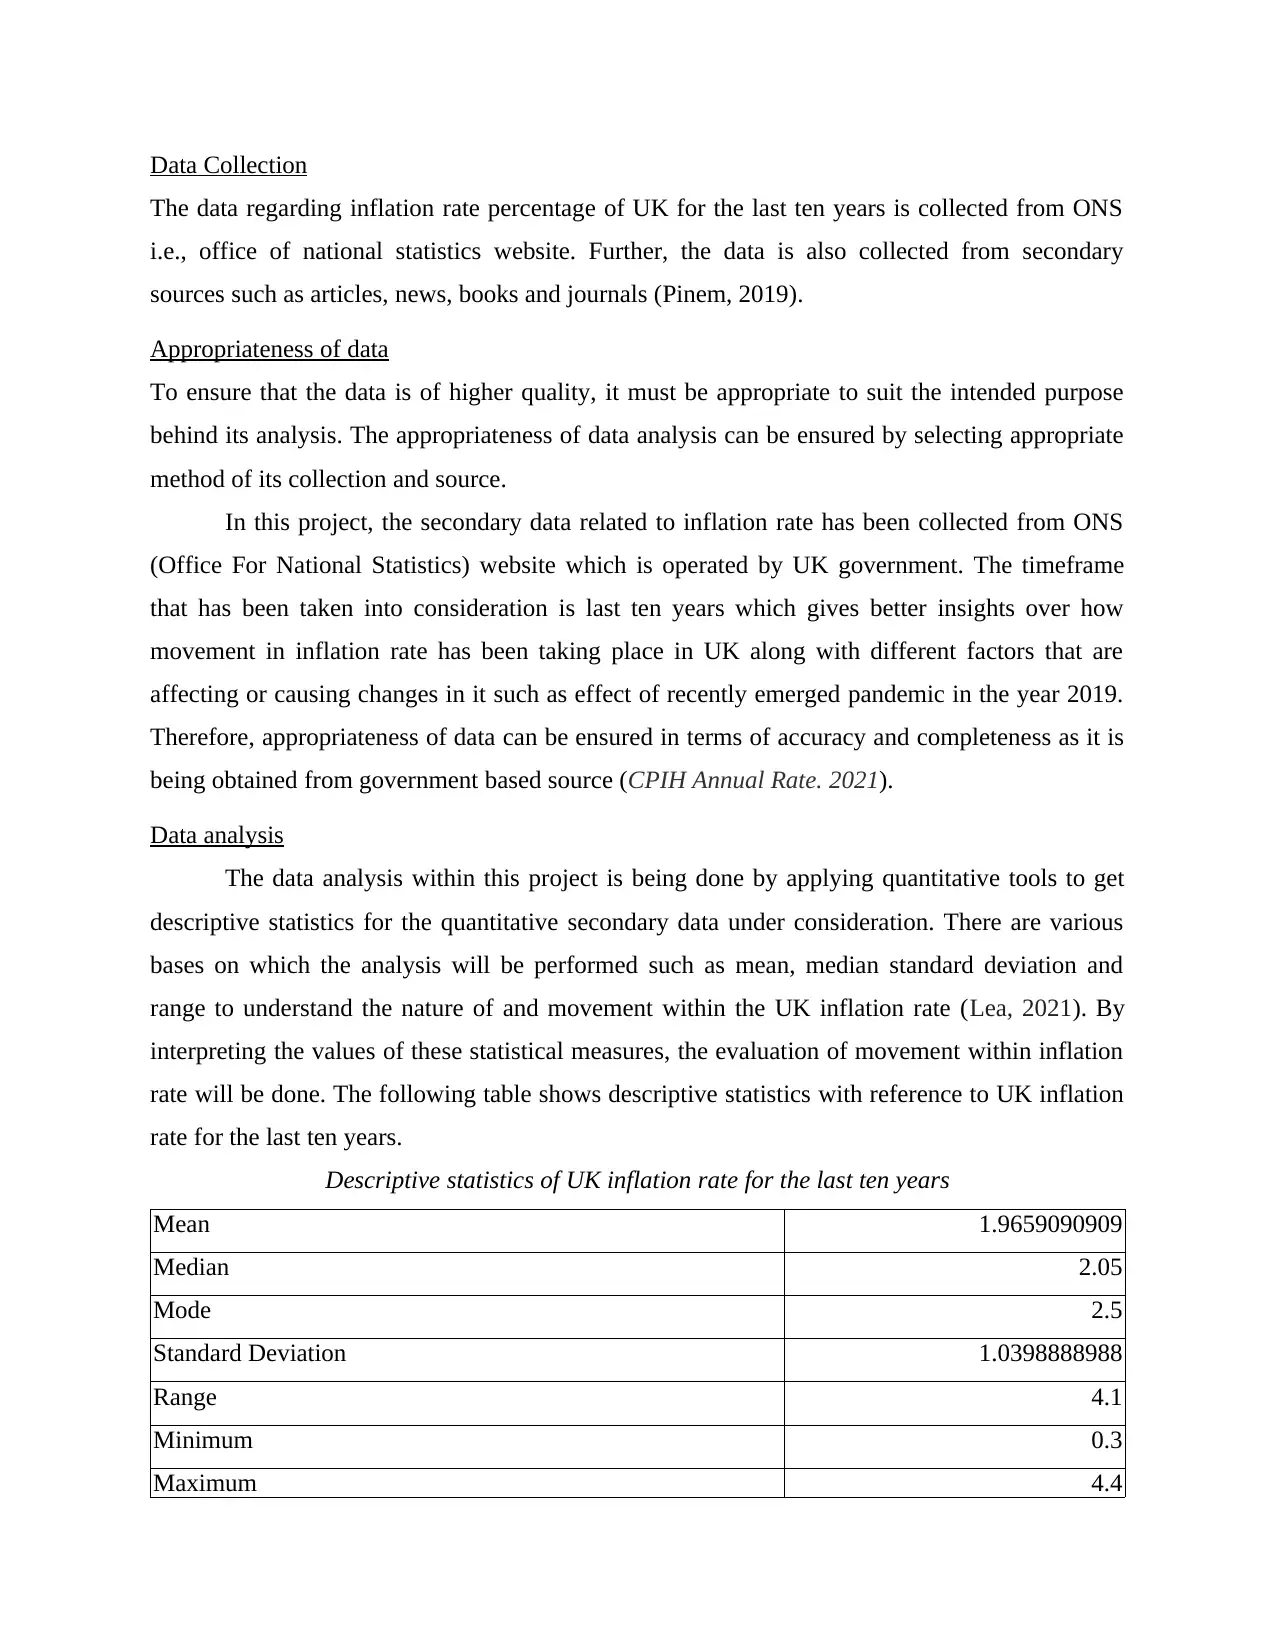
Data analysis
The data analysis within this project is being done by applying quantitative tools to get
descriptive statistics for the quantitative secondary data under consideration. There are various
bases on which the analysis will be performed such as mean, median standard deviation and
range to understand the nature of and movement within the UK inflation rate (Lea, 2021). By
interpreting the values of these statistical measures, the evaluation of movement within inflation
rate will be done. The following table shows descriptive statistics with reference to UK inflation
rate for the last ten years.
Descriptive statistics of UK inflation rate for the last ten years
Mean 1.9659090909
Median 2.05
Mode 2.5
Standard Deviation 1.0398888988
Range 4.1
Minimum 0.3
Maximum 4.4
The data regarding inflation rate percentage of UK for the last ten years is collected from ONS
i.e., office of national statistics website. Further, the data is also collected from secondary
sources such as articles, news, books and journals (Pinem, 2019).
Appropriateness of data
To ensure that the data is of higher quality, it must be appropriate to suit the intended purpose
behind its analysis. The appropriateness of data analysis can be ensured by selecting appropriate
method of its collection and source.
In this project, the secondary data related to inflation rate has been collected from ONS
(Office For National Statistics) website which is operated by UK government. The timeframe
that has been taken into consideration is last ten years which gives better insights over how
movement in inflation rate has been taking place in UK along with different factors that are
affecting or causing changes in it such as effect of recently emerged pandemic in the year 2019.
Therefore, appropriateness of data can be ensured in terms of accuracy and completeness as it is
being obtained from government based source (CPIH Annual Rate. 2021).
Data analysis
The data analysis within this project is being done by applying quantitative tools to get
descriptive statistics for the quantitative secondary data under consideration. There are various
bases on which the analysis will be performed such as mean, median standard deviation and
range to understand the nature of and movement within the UK inflation rate (Lea, 2021). By
interpreting the values of these statistical measures, the evaluation of movement within inflation
rate will be done. The following table shows descriptive statistics with reference to UK inflation
rate for the last ten years.
Descriptive statistics of UK inflation rate for the last ten years
Mean 1.9659090909
Median 2.05
Mode 2.5
Standard Deviation 1.0398888988
Range 4.1
Minimum 0.3
Maximum 4.4
Paraphrase This Document
Need a fresh take? Get an instant paraphrase of this document with our AI Paraphraser
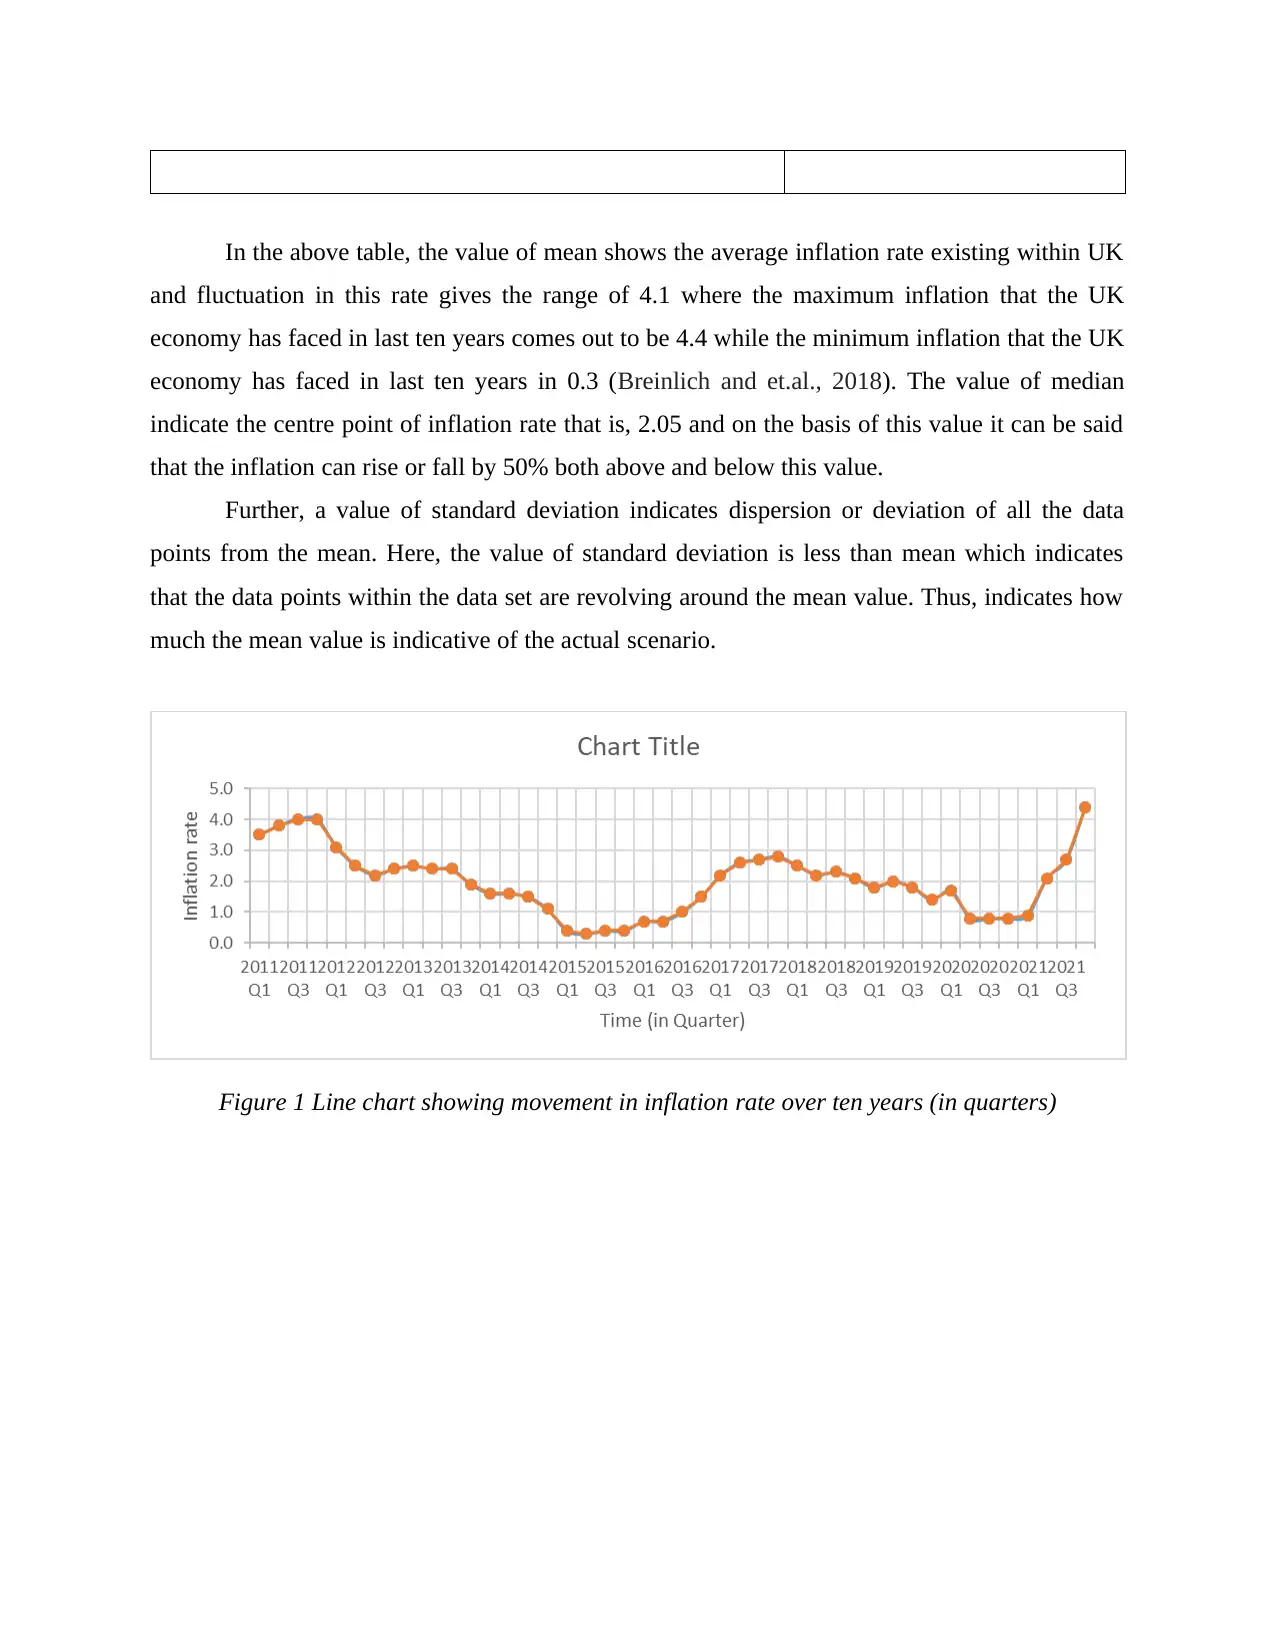
In the above table, the value of mean shows the average inflation rate existing within UK
and fluctuation in this rate gives the range of 4.1 where the maximum inflation that the UK
economy has faced in last ten years comes out to be 4.4 while the minimum inflation that the UK
economy has faced in last ten years in 0.3 (Breinlich and et.al., 2018). The value of median
indicate the centre point of inflation rate that is, 2.05 and on the basis of this value it can be said
that the inflation can rise or fall by 50% both above and below this value.
Further, a value of standard deviation indicates dispersion or deviation of all the data
points from the mean. Here, the value of standard deviation is less than mean which indicates
that the data points within the data set are revolving around the mean value. Thus, indicates how
much the mean value is indicative of the actual scenario.
Figure 1 Line chart showing movement in inflation rate over ten years (in quarters)
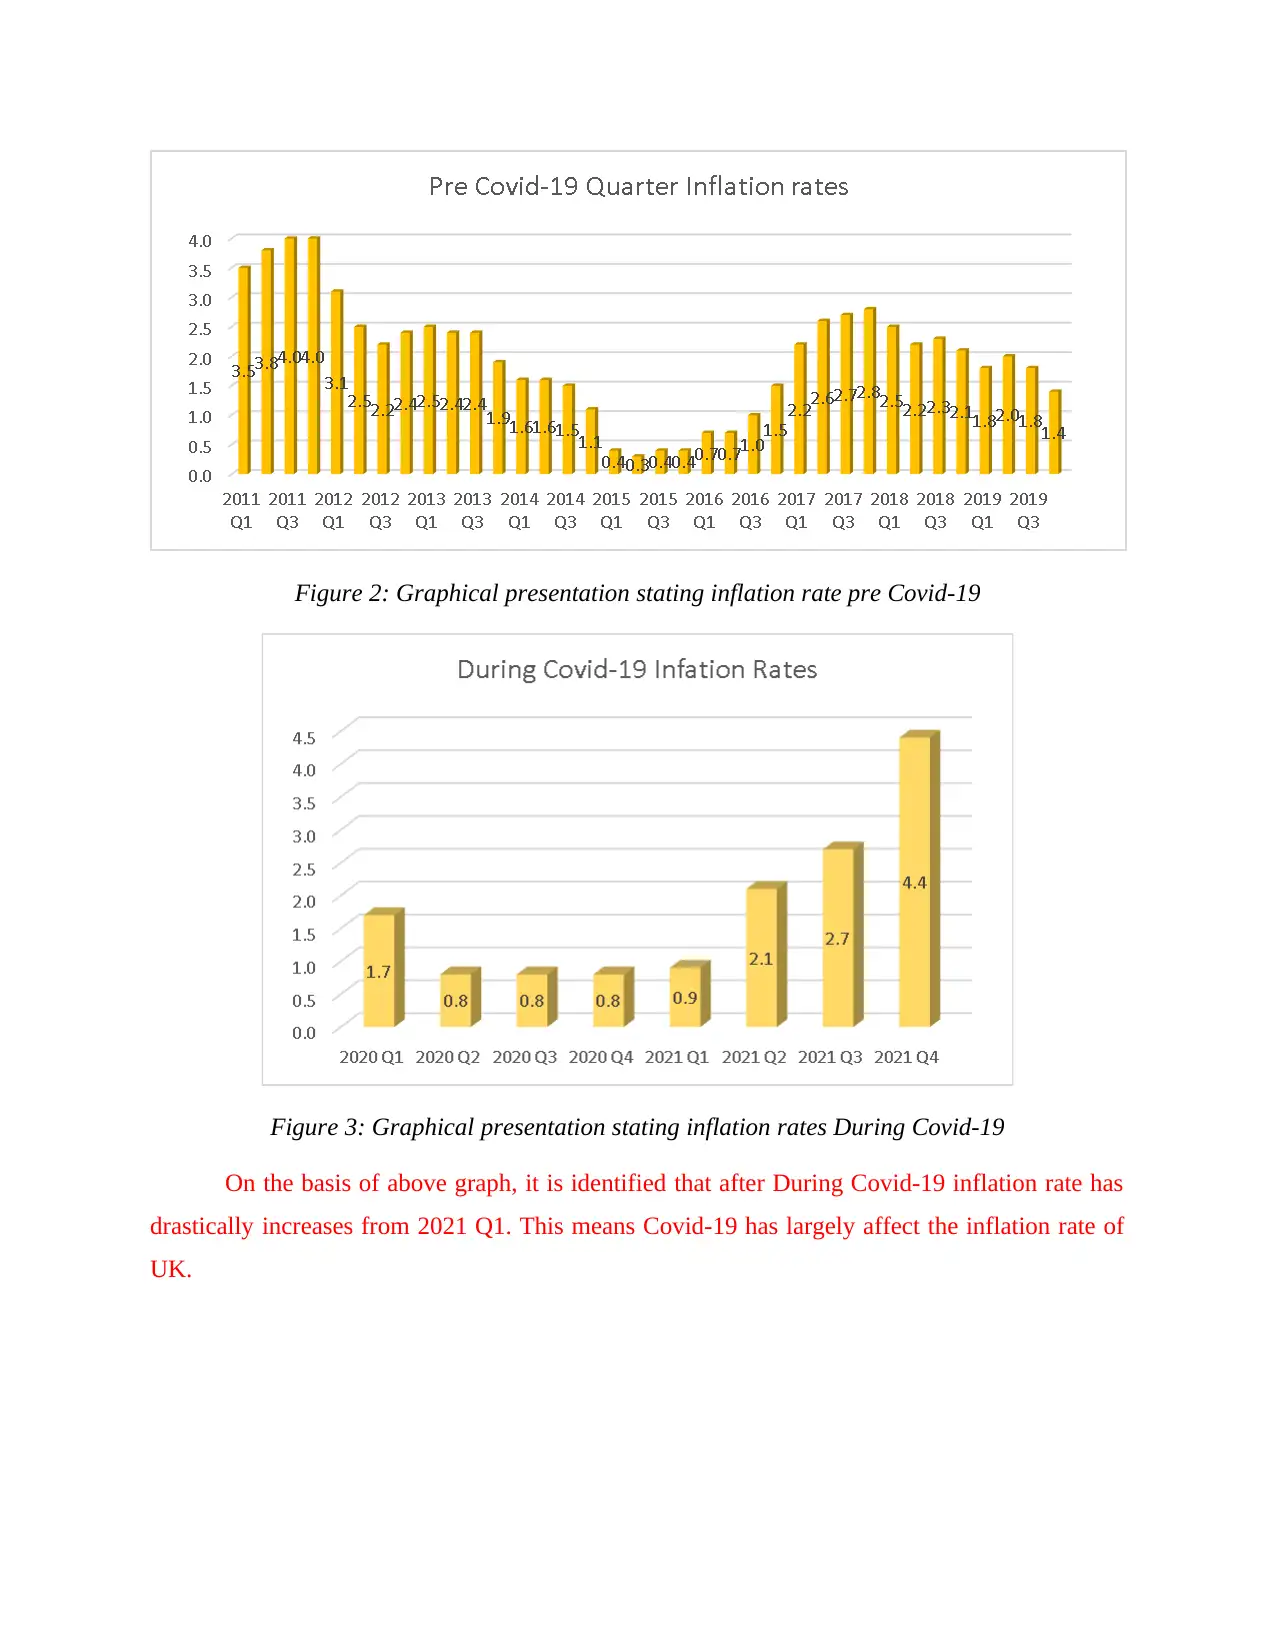
Figure 2: Graphical presentation stating inflation rate pre Covid-19
Figure 3: Graphical presentation stating inflation rates During Covid-19
On the basis of above graph, it is identified that after During Covid-19 inflation rate has
drastically increases from 2021 Q1. This means Covid-19 has largely affect the inflation rate of
UK.
Figure 3: Graphical presentation stating inflation rates During Covid-19
On the basis of above graph, it is identified that after During Covid-19 inflation rate has
drastically increases from 2021 Q1. This means Covid-19 has largely affect the inflation rate of
UK.
⊘ This is a preview!⊘
Do you want full access?
Subscribe today to unlock all pages.
Trusted by 1+ million students worldwide
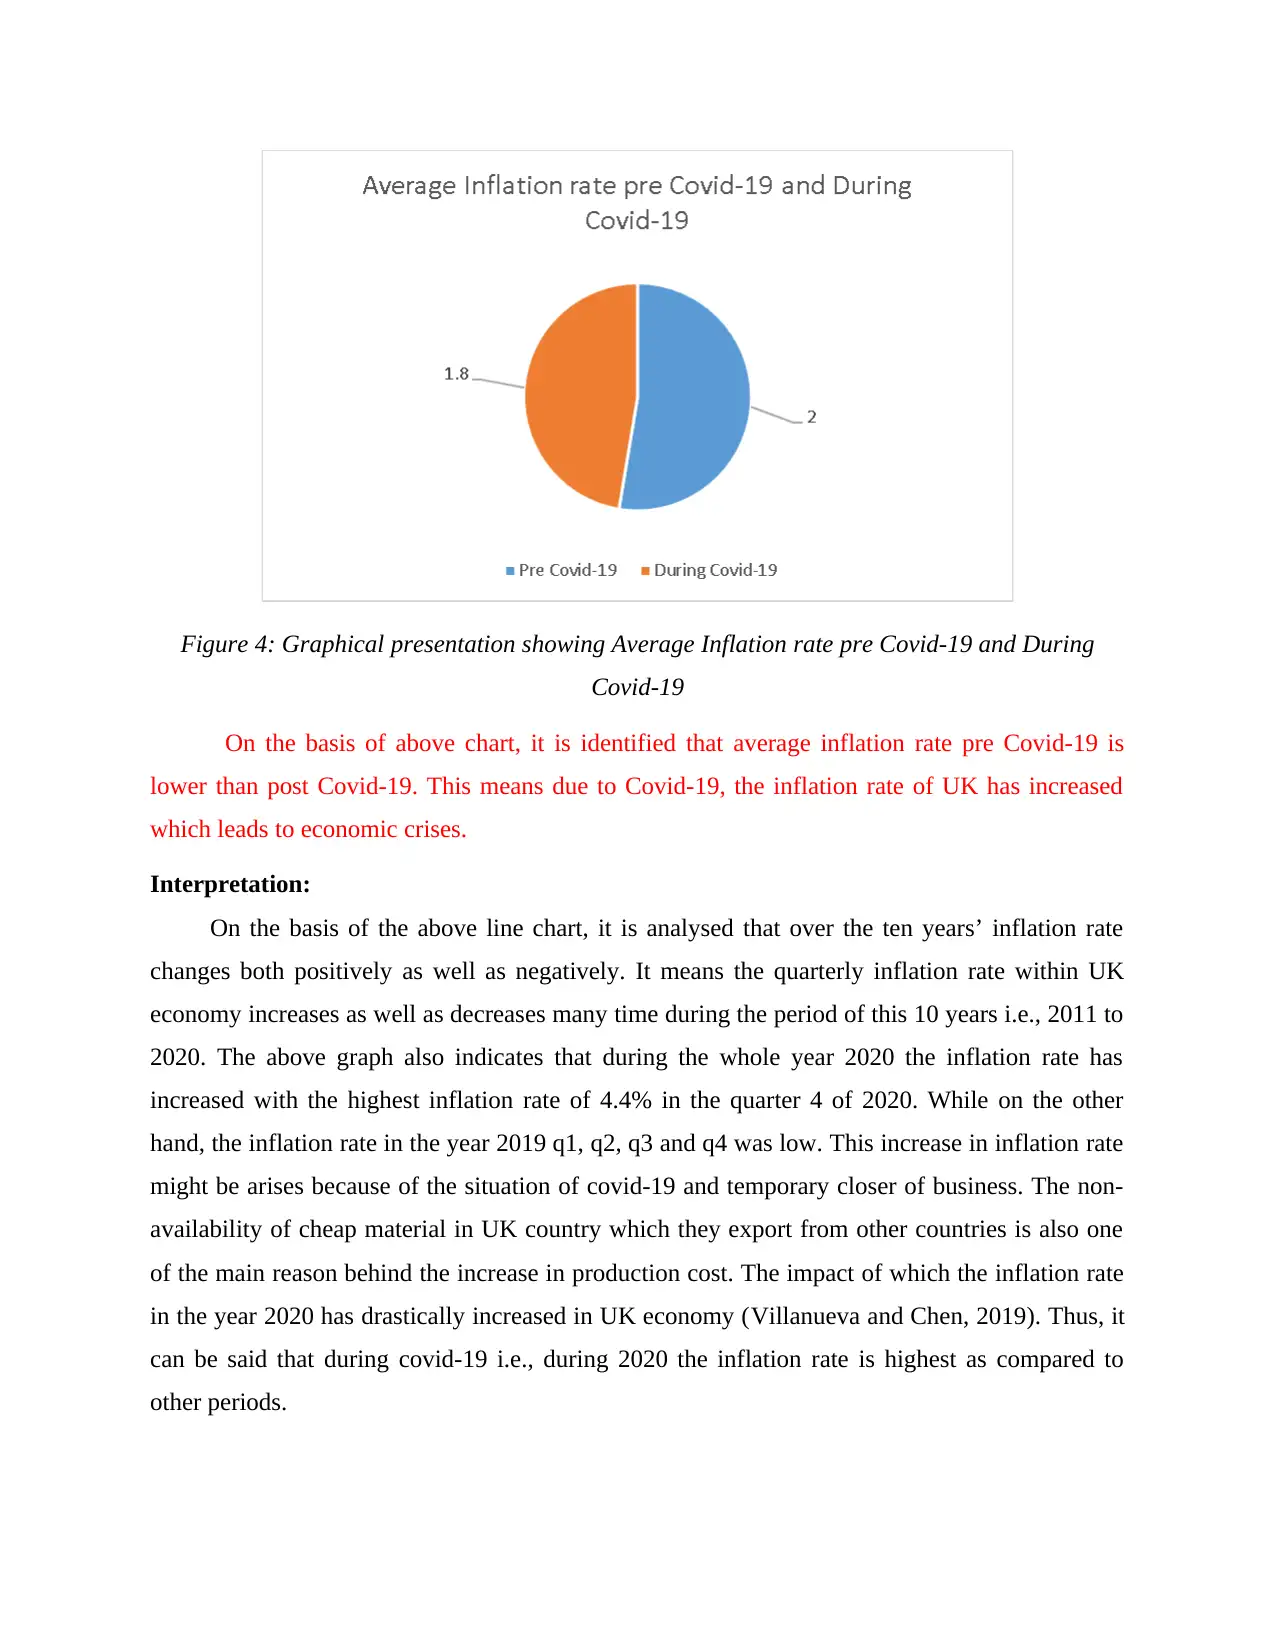
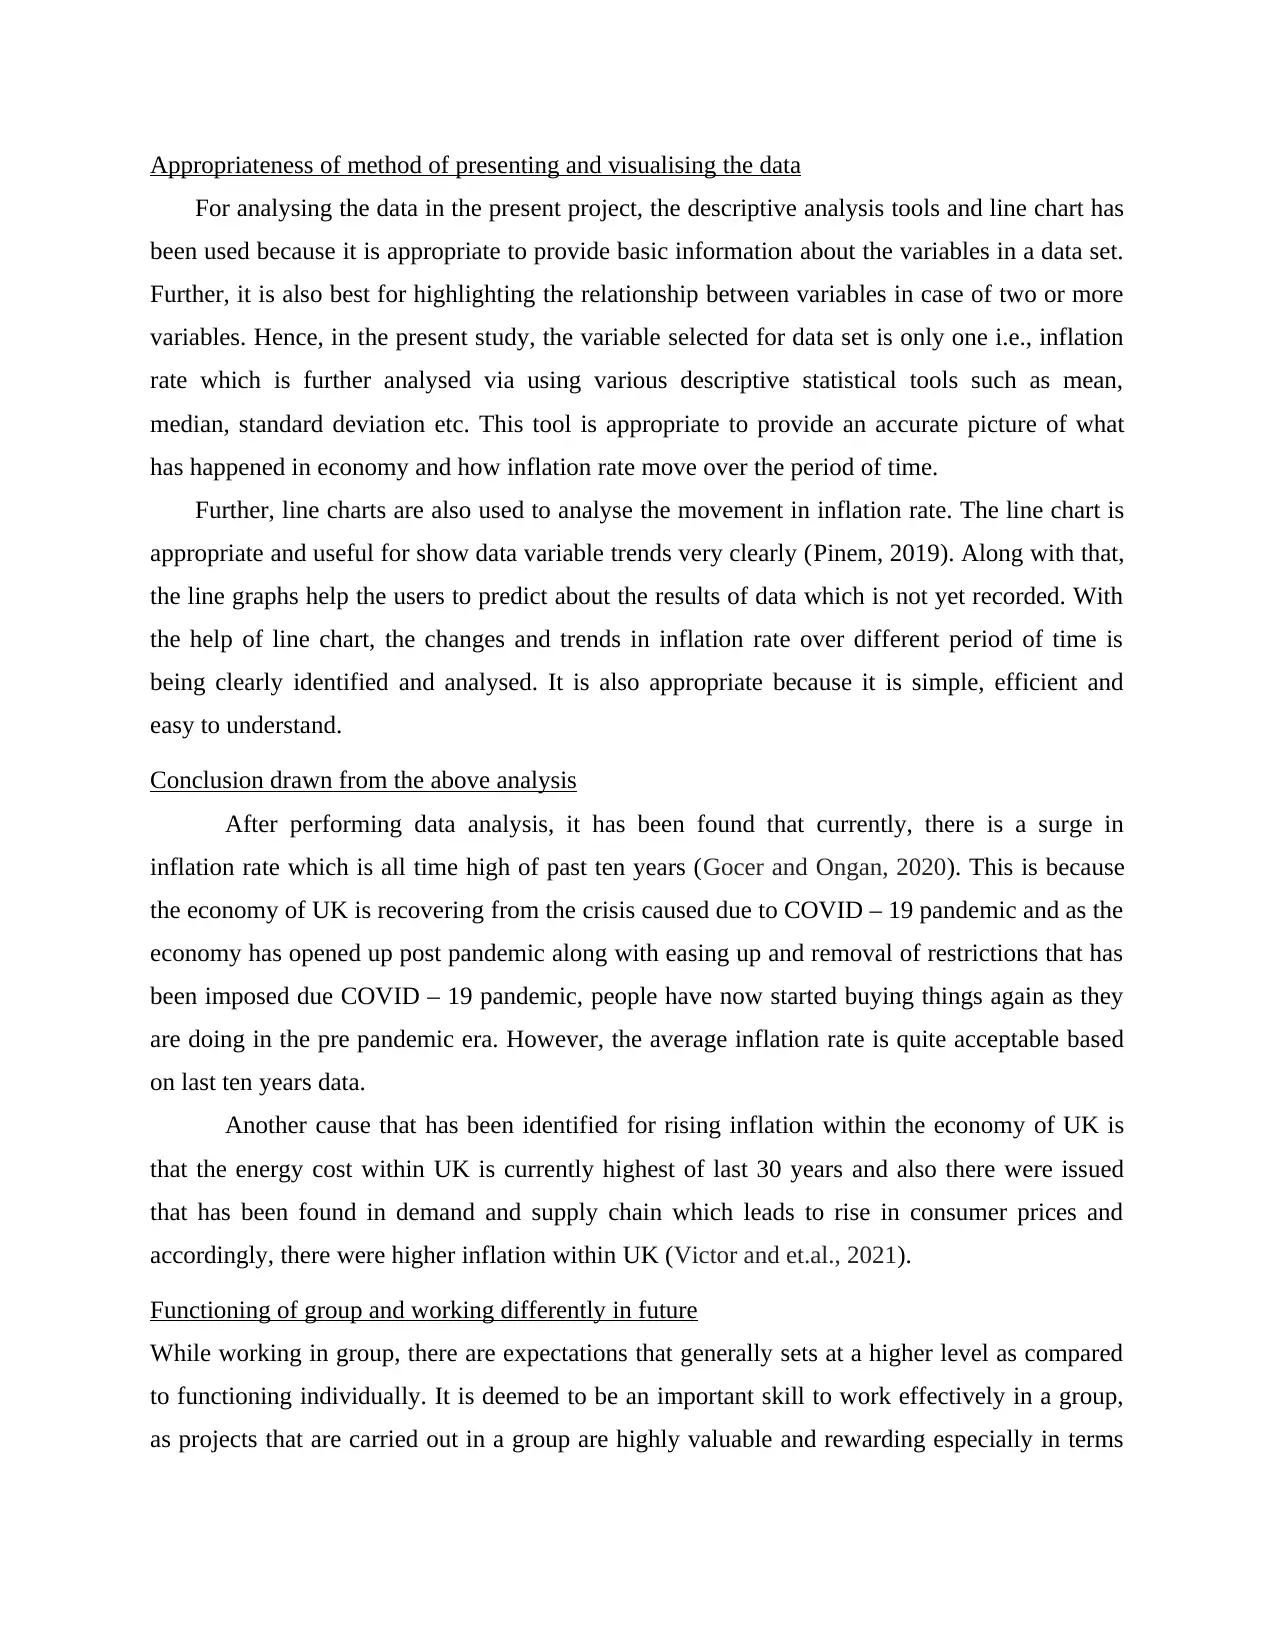
Figure 4: Graphical presentation showing Average Inflation rate pre Covid-19 and During
Covid-19
On the basis of above chart, it is identified that average inflation rate pre Covid-19 is
lower than post Covid-19. This means due to Covid-19, the inflation rate of UK has increased
which leads to economic crises.
Interpretation:
On the basis of the above line chart, it is analysed that over the ten years’ inflation rate
changes both positively as well as negatively. It means the quarterly inflation rate within UK
economy increases as well as decreases many time during the period of this 10 years i.e., 2011 to
2020. The above graph also indicates that during the whole year 2020 the inflation rate has
increased with the highest inflation rate of 4.4% in the quarter 4 of 2020. While on the other
hand, the inflation rate in the year 2019 q1, q2, q3 and q4 was low. This increase in inflation rate
might be arises because of the situation of covid-19 and temporary closer of business. The non-
availability of cheap material in UK country which they export from other countries is also one
of the main reason behind the increase in production cost. The impact of which the inflation rate
in the year 2020 has drastically increased in UK economy (Villanueva and Chen, 2019). Thus, it
can be said that during covid-19 i.e., during 2020 the inflation rate is highest as compared to
other periods.
Paraphrase This Document
Need a fresh take? Get an instant paraphrase of this document with our AI Paraphraser
Appropriateness of method of presenting and visualising the data
For analysing the data in the present project, the descriptive analysis tools and line chart has
been used because it is appropriate to provide basic information about the variables in a data set.
Further, it is also best for highlighting the relationship between variables in case of two or more
variables. Hence, in the present study, the variable selected for data set is only one i.e., inflation
rate which is further analysed via using various descriptive statistical tools such as mean,
median, standard deviation etc. This tool is appropriate to provide an accurate picture of what
has happened in economy and how inflation rate move over the period of time.
Further, line charts are also used to analyse the movement in inflation rate. The line chart is
appropriate and useful for show data variable trends very clearly (Pinem, 2019). Along with that,
the line graphs help the users to predict about the results of data which is not yet recorded. With
the help of line chart, the changes and trends in inflation rate over different period of time is
being clearly identified and analysed. It is also appropriate because it is simple, efficient and
easy to understand.
Conclusion drawn from the above analysis
After performing data analysis, it has been found that currently, there is a surge in
inflation rate which is all time high of past ten years (Gocer and Ongan, 2020). This is because
the economy of UK is recovering from the crisis caused due to COVID – 19 pandemic and as the
economy has opened up post pandemic along with easing up and removal of restrictions that has
been imposed due COVID – 19 pandemic, people have now started buying things again as they
are doing in the pre pandemic era. However, the average inflation rate is quite acceptable based
on last ten years data.
Another cause that has been identified for rising inflation within the economy of UK is
that the energy cost within UK is currently highest of last 30 years and also there were issued
that has been found in demand and supply chain which leads to rise in consumer prices and
accordingly, there were higher inflation within UK (Victor and et.al., 2021).
Functioning of group and working differently in future
While working in group, there are expectations that generally sets at a higher level as compared
to functioning individually. It is deemed to be an important skill to work effectively in a group,
as projects that are carried out in a group are highly valuable and rewarding especially in terms
of experiences and learning gained. The present project has also been carried out in a group,
where the group functioning includes the following:
In the beginning, to ensure that there should be clarity of directions and coordination
among group members, the clear objectives are being set and agreed upon in advance
which includes creation of timetable for tracking the progress of the project. There was an effective communication that has been established among group members
through conducting discussion and meetings regularly, so that ideas can be shared and
issues can be resolved to accomplish the project in desired manner. Accordingly,
consensus has also been build among group members which allows for reaching to an
agreement that ensure sharing and contribution of all.
Things that would be done differently in future
The project is lacking in terms of definition of roles which leads to splitting the entire
project work among group members, so that different tasks can be assigned to individuals on the
basis of their relative strengths. Therefore, if I get similar opportunity of working in a group in
the future, the different things that would be done is allocation of tasks in the beginning, so that
problems such as repetition of tasks and isolated working could be avoided in order to save time
and resources.
Reflection on group activities
During the group project, I face lack of coordination as a biggest issue from the other group
members. I have personally realized that group work consumes more time to coordinate
schedules, arrange meetings, meet and make decision collectively. The impact of which coming
up in a particular decision is because complex and time consuming. Being a group member, I
can’t able to eliminate the coordination cost as it is one of the most significant skills that have to
be present in group members. Along with the poor coordination skill, I also faced issue in
communicating with the other group member because of mu poor communication skill. There is
a situation, in which I misunderstood my one of the group member and make assumption. For
example, while selecting data I have taken only three years’ inflation rate data but in actual I
need to take ten years’ data from ONS websites (Cavallo, 2020).
In order to solve the issue and do the same project correctly in future I will enhance my
communication and coordinating skills (Musarat, Alaloul and Liew, 2021). Firstly, without
making any assumption by my own, I will clarify everything which I unable to understand with
⊘ This is a preview!⊘
Do you want full access?
Subscribe today to unlock all pages.
Trusted by 1+ million students worldwide
my other group members. I will also speak positively and respectfully to other members in order
to complete the same project together with other group members smoothly and efficient manner.
Further, to enhance the coordination among group I will assign roles to each member in advance
and also warn them about the time consuming task and stages.
CONCLUSION
After summing up the above information present on report, it is concluded that due to
covid-19, the inflation rate has moved highest within the UK economy. The report has also
concluded that the data regarding the inflation rate movement has collected from ONS website
and secondary sources. Further, the report has also analysed the collected data using the
descriptive statistical tools and line chart. Also, how the aim of the project is achieved has
discussed in the report. In addition, the report has concluded the whole group function together
and what the group do differently when they get same project in future as well. Lastly, the report
has covered thereflection section which described the issues faces by me during this group
project along with the steps I will adopt in order to solve this.
Paraphrase This Document
Need a fresh take? Get an instant paraphrase of this document with our AI Paraphraser
REFERENCES
Books and Journal
Breinlich, H., and et.al., 2018. The Brexit vote, inflation and UK living standards. International
Economic Review.
Cavallo, A., 2020. Inflation with Covid consumption baskets (No. w27352). National Bureau of
Economic Research.
Forbes, K., Kirkham, L. and Theodoridis, K., 2021. A Trendy Approach to UK Inflation
Dynamics 1. The Manchester School, 89, pp.23-75.
Gocer, I. and Ongan, S., 2020. The relationship between inflation and interest rates in the UK:
The nonlinear ARDL approach. Journal of Central Banking Theory and Practice, 9(3),
pp.77-86.
Lea, R., 2021. CPI annual inflation rate was a less-than-expected 2.0% in July: but expect it to
rise in coming months.
Musarat, M. A., Alaloul, W. S. and Liew, M. S., 2021. Impact of inflation rate on construction
projects budget: A review. Ain Shams Engineering Journal. 12(1). pp.407-414.
Osabuohien, E. S. C. and et.al., 2018. Inflation rate, exchange rate volatility and exchange rate
pass-through nexus: The Nigerian experience. Journal of Applied Economic
Sciences. 2(56). pp.574-585.
Pinem, D. B., 2019. Analysis of Global Stock Exchange Index, Foreign Exchange Rate, Interest
Rate and Inflation Rate Influences CSPI in Indonesia Stock Exchange (Period of January
2014–2015). European Journal of Business and Management Research. 4(6).
Victor, V., and et.al., 2021. From a Recession to the COVID-19 Pandemic: Inflation–
Unemployment Comparison between the UK and India. Economies, 9(2), p.73.
Villanueva, R. A. M. and Chen, Z. J., 2019. ggplot2: elegant graphics for data analysis.
Online
CPIH Annual Rate. 2021. [Online]. Available through
<https://www.ons.gov.uk/economy/inflationandpriceindices/timeseries/l55o/mm23>
1 out of 11
Related Documents


Your All-in-One AI-Powered Toolkit for Academic Success.
+13062052269
info@desklib.com
Available 24*7 on WhatsApp / Email
![[object Object]](/_next/static/media/star-bottom.7253800d.svg)
Unlock your academic potential
Copyright © 2020–2026 A2Z Services. All Rights Reserved. Developed and managed by ZUCOL.