PUBH5060: Report on Quantitative Data Analysis of Ebola Subtype Impact
VerifiedAdded on 2023/01/12
|8
|1367
|76
Report
AI Summary
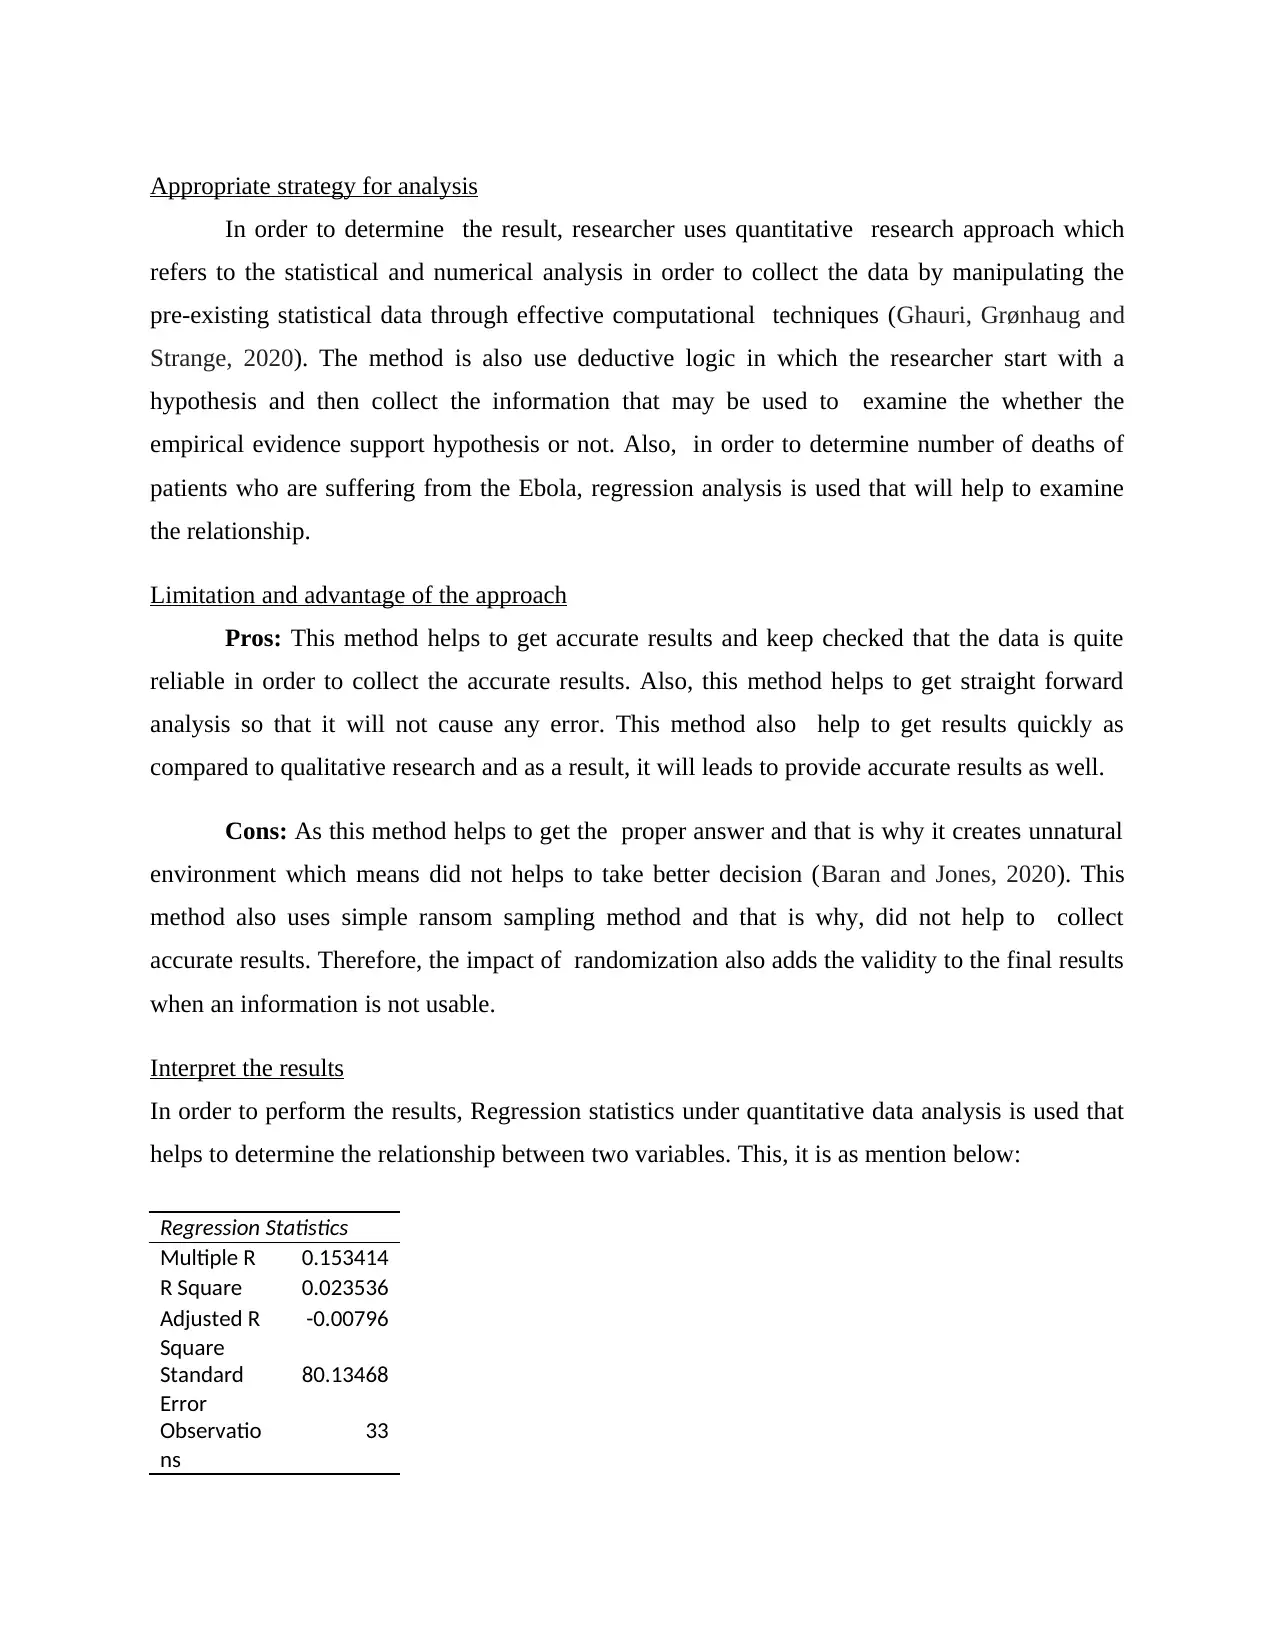
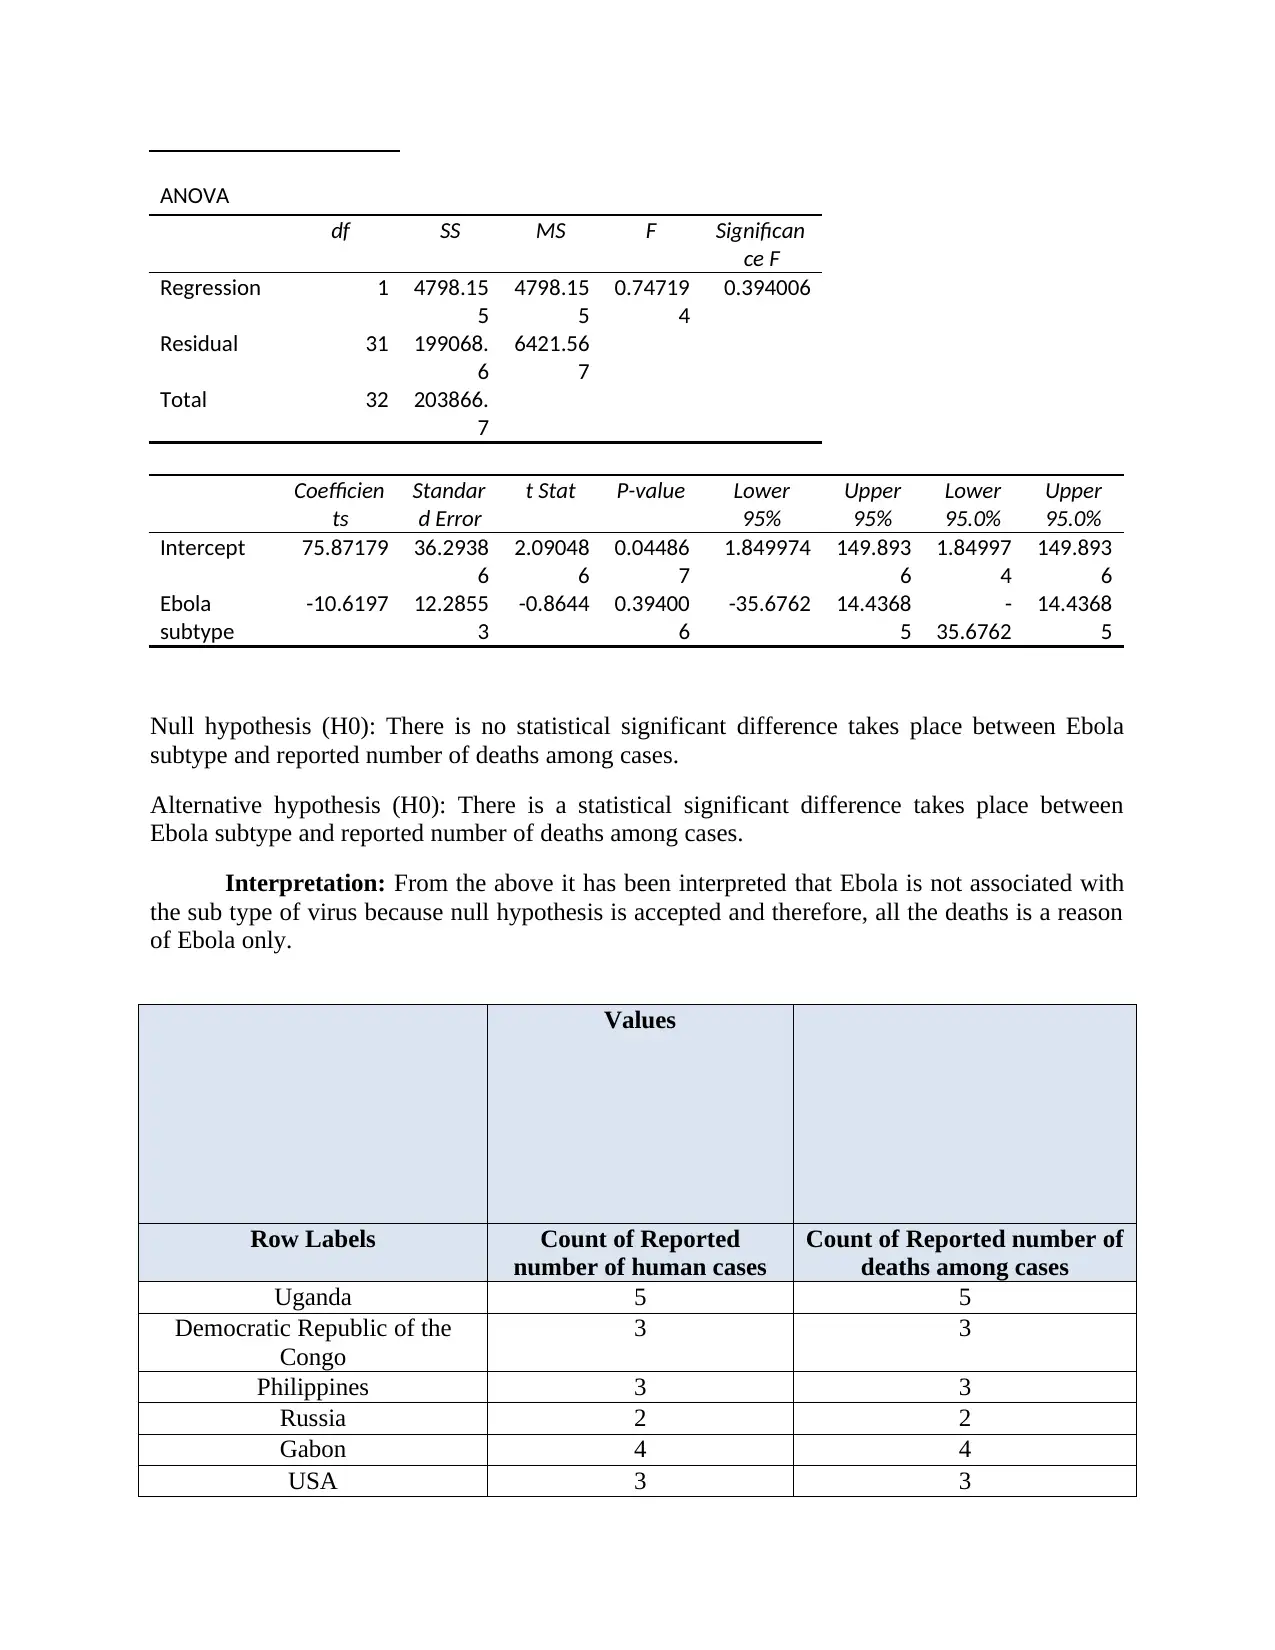
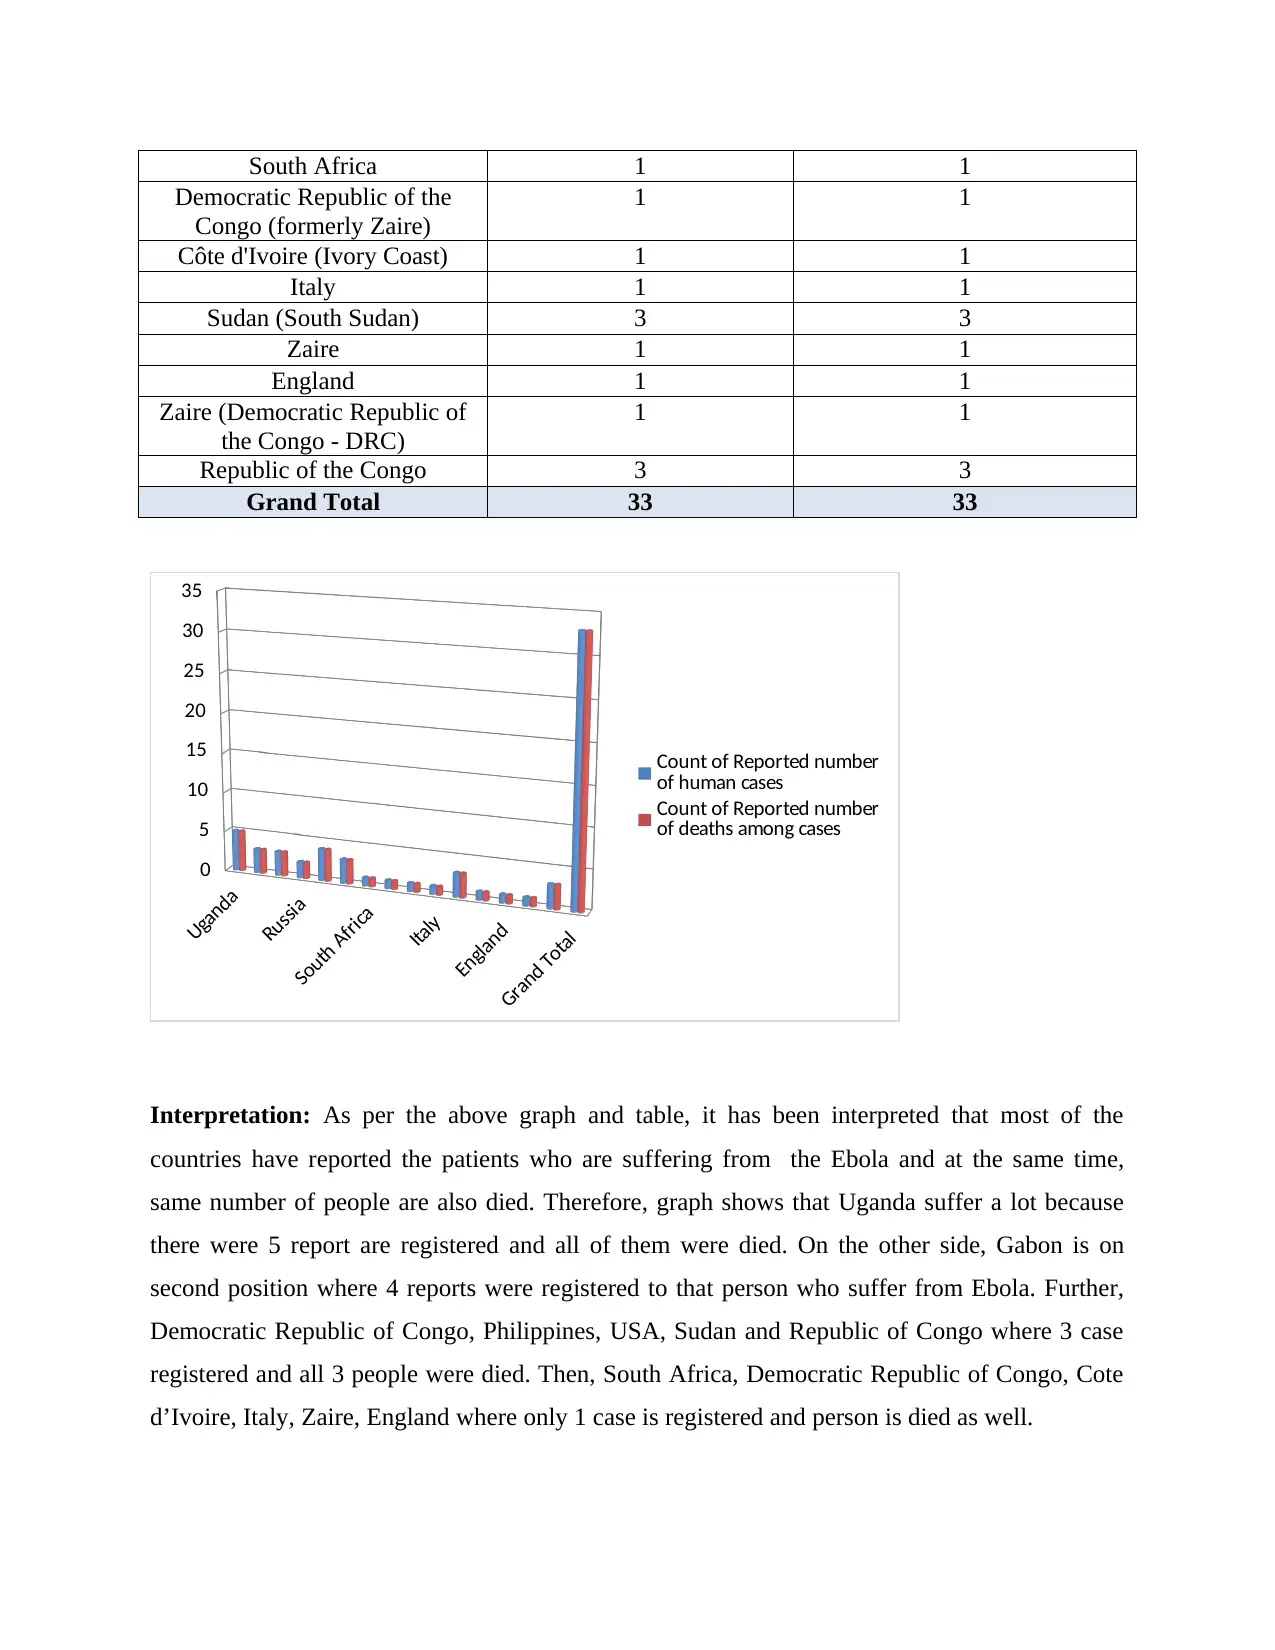
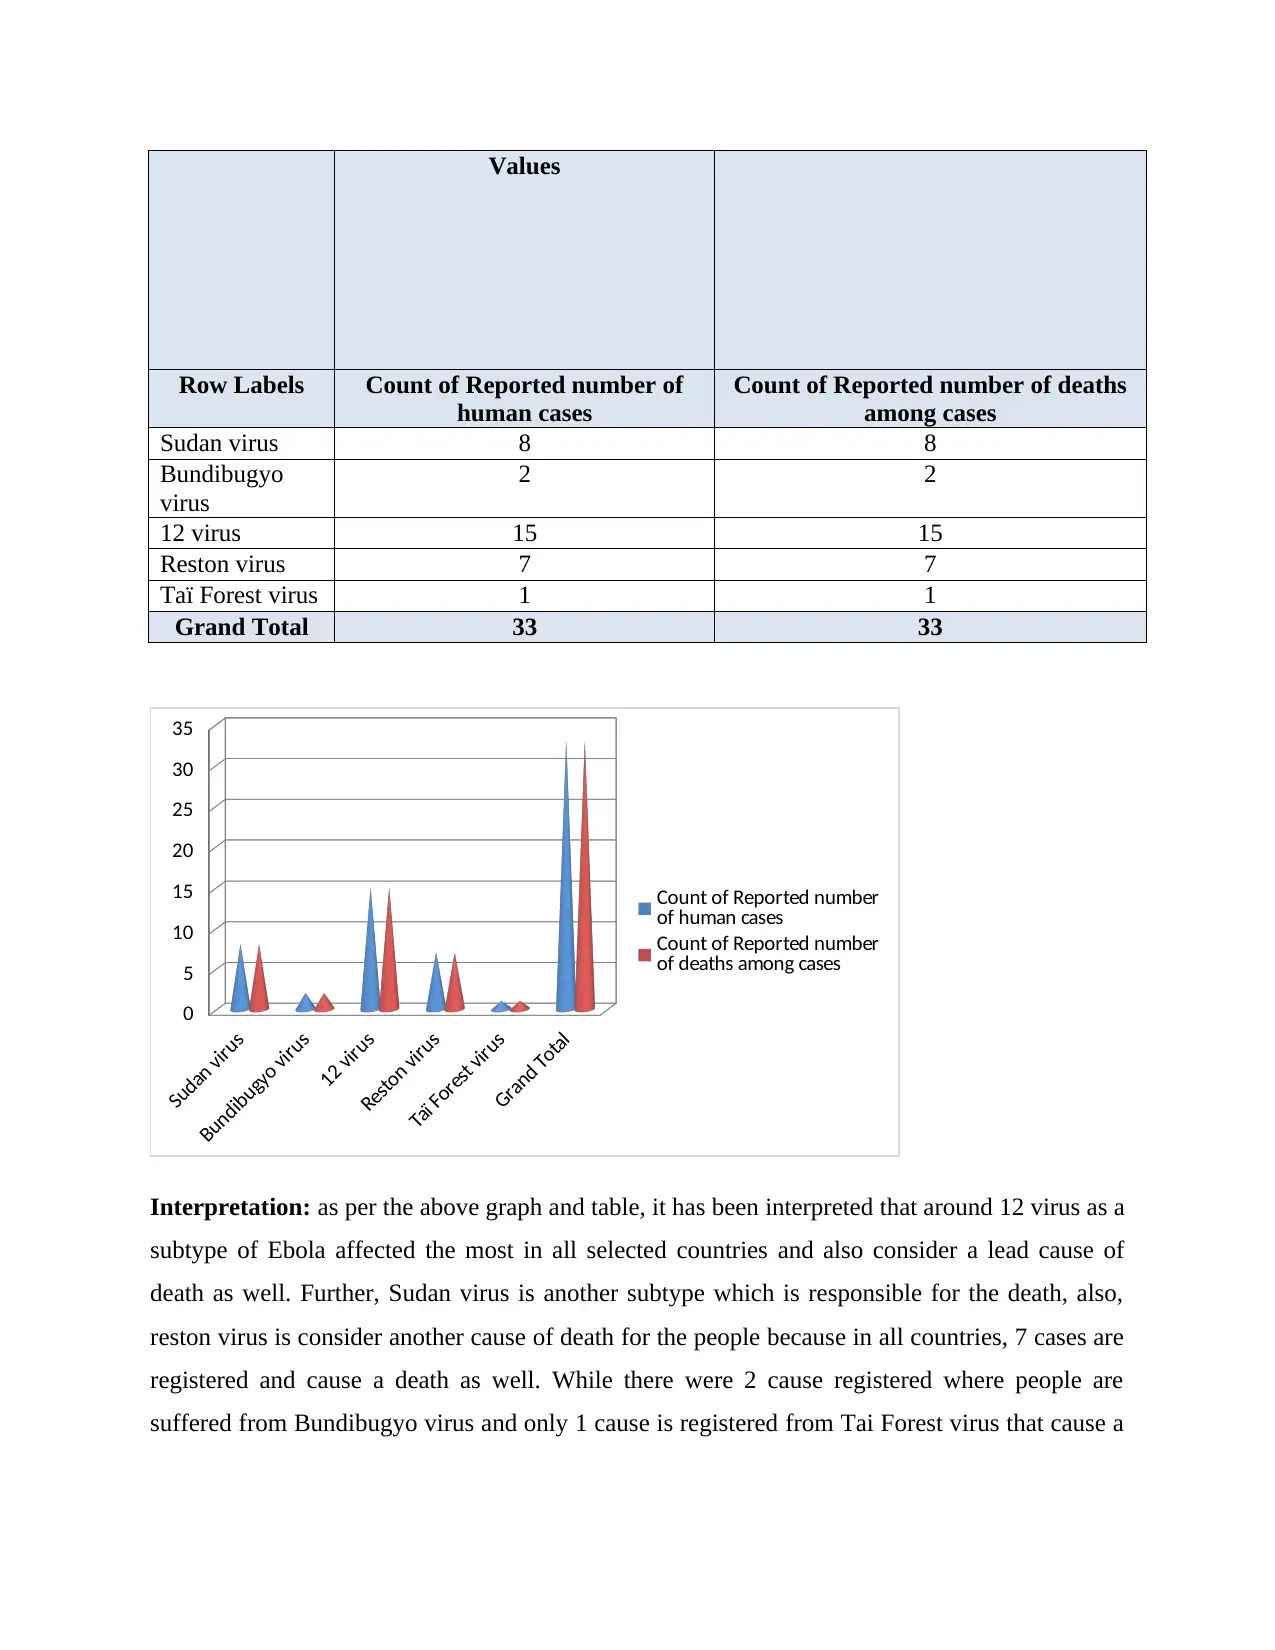
This report presents a quantitative analysis of Ebola data, focusing on the application of statistical methods to understand the disease's impact. The analysis employs regression statistics to examine the relationship between Ebola subtypes and reported deaths, using data from various countries. The report includes data abstraction, analysis, and interpretation of results, including the use of tables and graphs to visualize the findings. The study identifies that there is no direct correlation between the Ebola subtype and the number of deaths. It analyzes the geographical distribution of cases and deaths, highlighting the impact on different countries and analyzes the influence of different Ebola subtypes on mortality rates. The report concludes by summarizing the key findings, emphasizing the importance of public health interventions in addressing the Ebola outbreak.
1 out of 8
Related Documents


Your All-in-One AI-Powered Toolkit for Academic Success.
+13062052269
info@desklib.com
Available 24*7 on WhatsApp / Email
![[object Object]](/_next/static/media/star-bottom.7253800d.svg)
Copyright © 2020–2026 A2Z Services. All Rights Reserved. Developed and managed by ZUCOL.