Superstore Data Analysis and Visualization Report using Excel
VerifiedAdded on 2023/06/05
|33
|4485
|128
Report
AI Summary
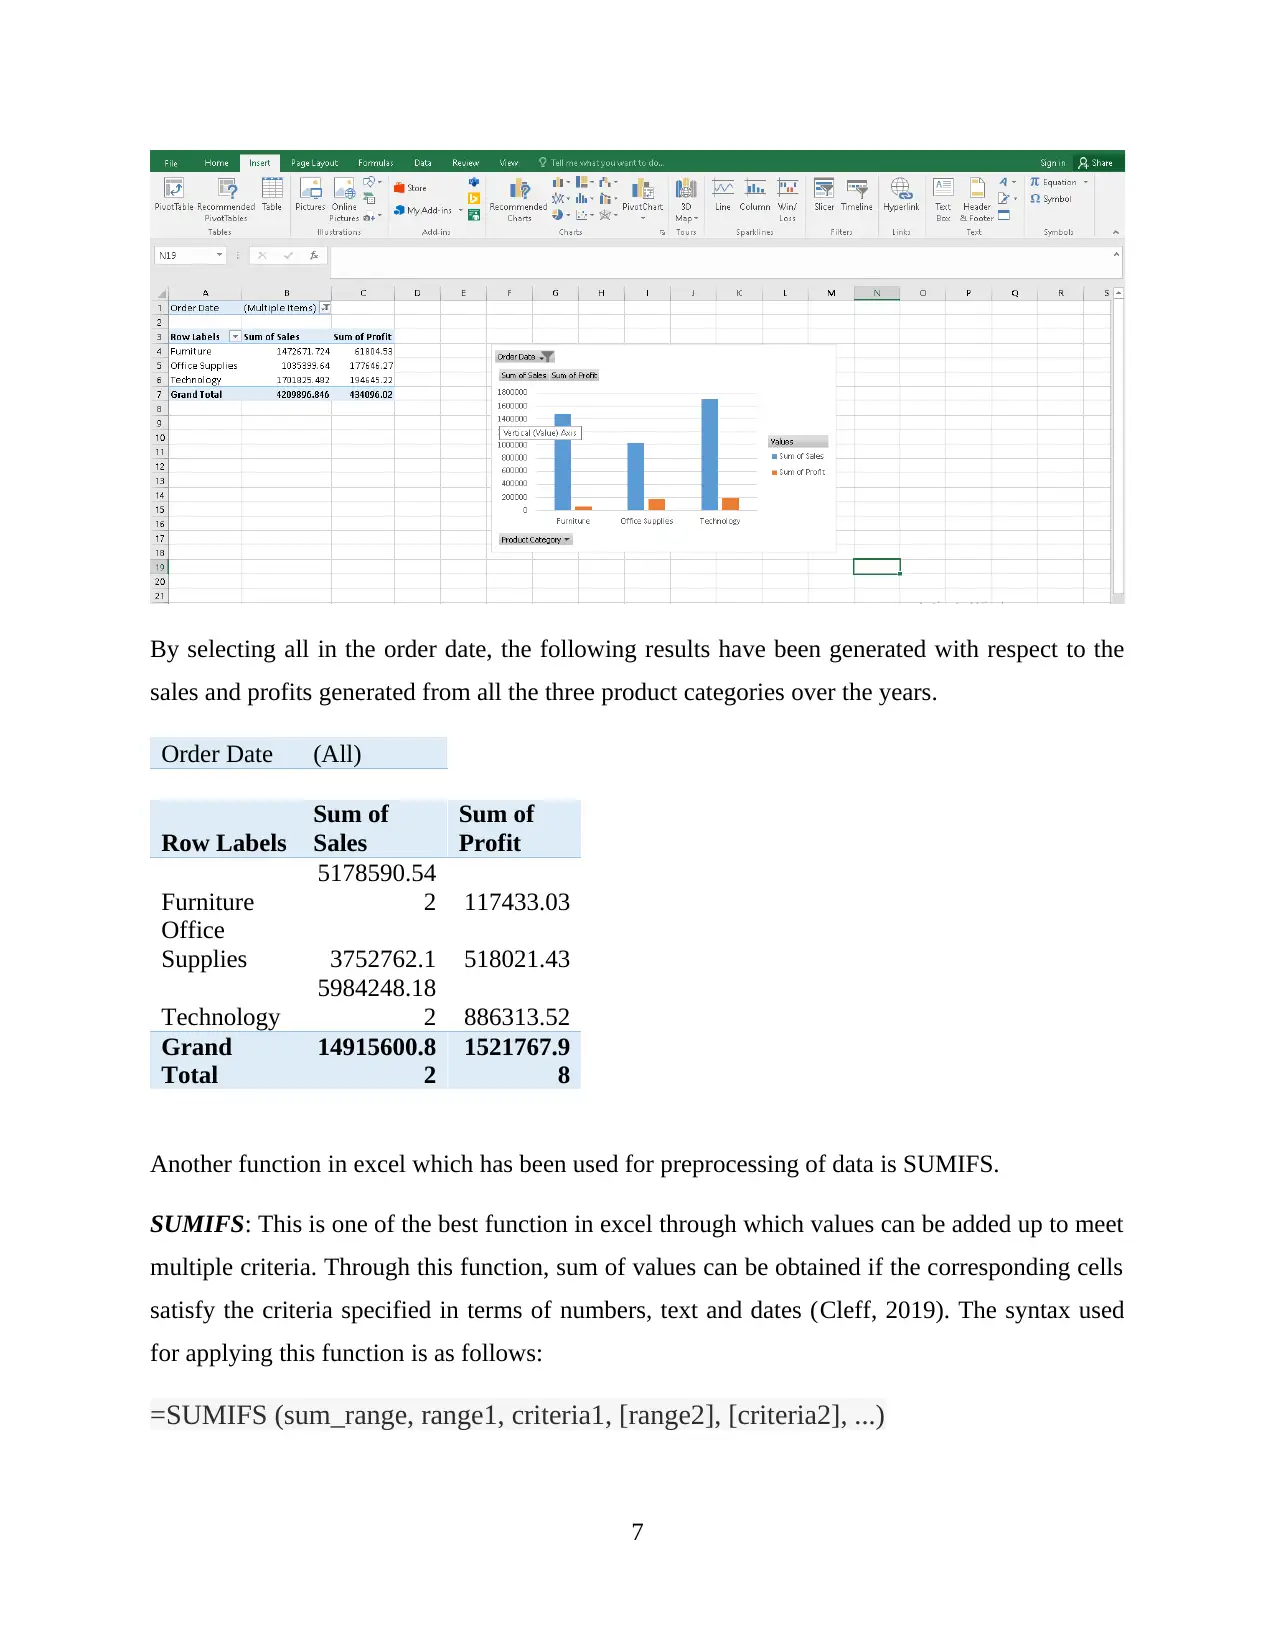
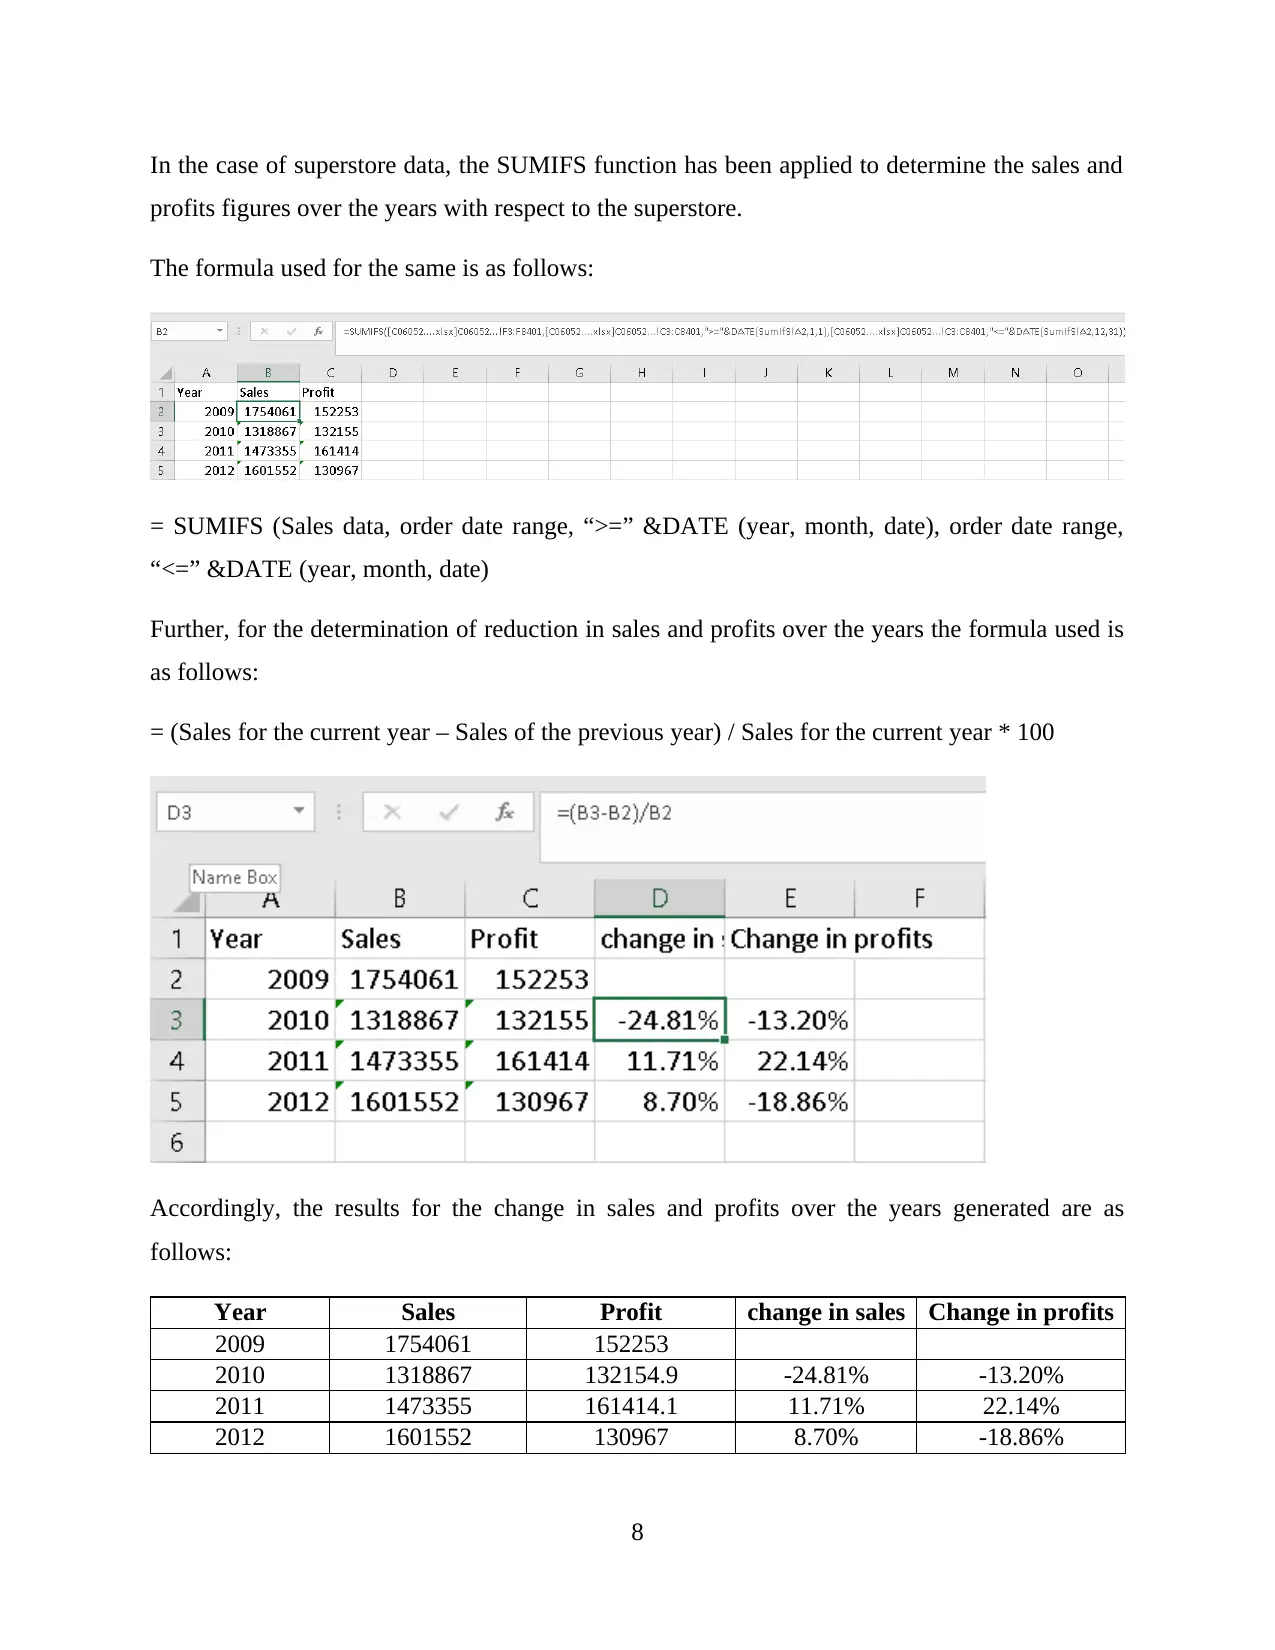
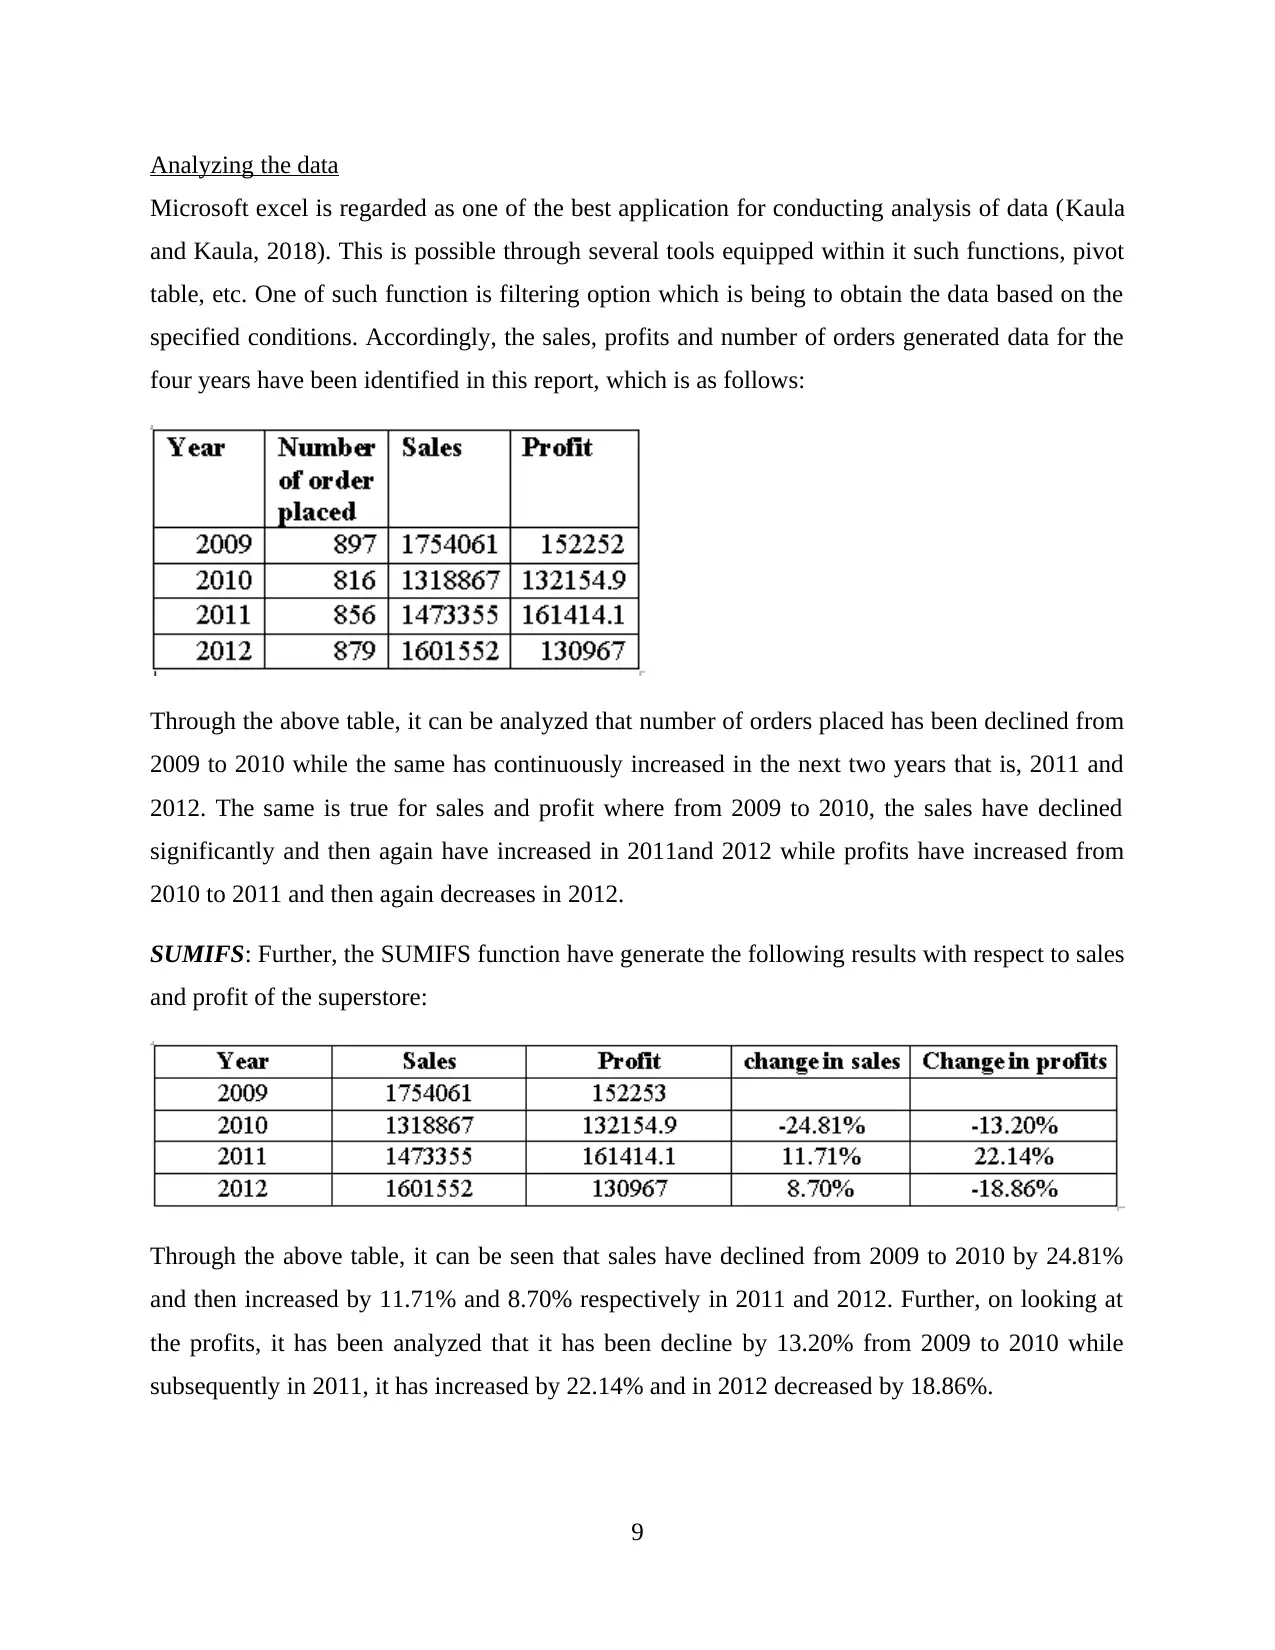
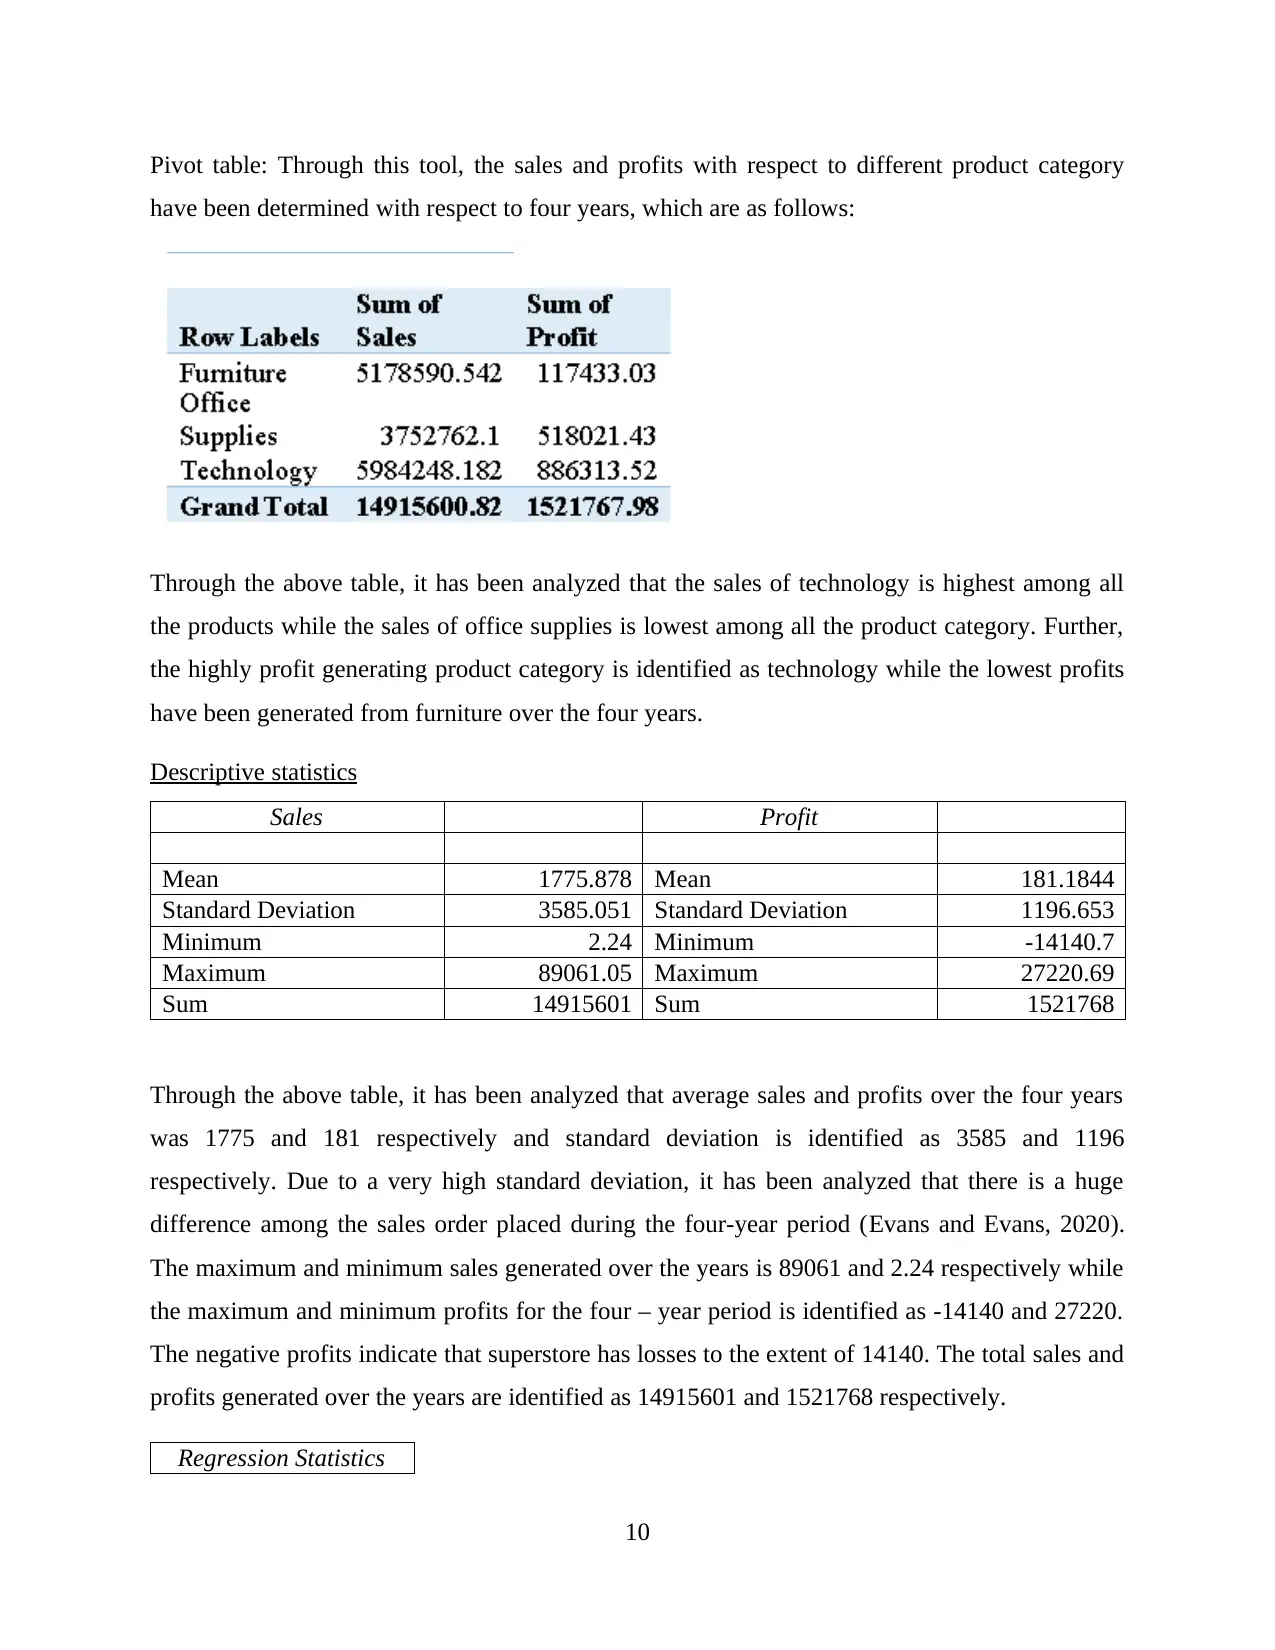
This report provides a comprehensive analysis and visualization of data using Microsoft Excel, focusing on preprocessing techniques, descriptive statistics, and graphical representations. The initial data preprocessing involves using Excel's filtering and pivot table functions to organize and summarize the data, specifically examining a superstore dataset. Key functions such as SUMIFS are employed to determine sales and profit figures over several years, along with calculations for changes in sales and profits. The analysis includes descriptive statistics to identify trends, such as average sales and profits, standard deviation, and maximum/minimum values. Data visualization techniques, including charts and graphs, are used to represent sales and profit data based on product category and yearly performance. The report also touches on cluster analysis and compares the advantages and disadvantages of using SPSS and Excel for data analysis. This student-contributed assignment is available on Desklib, a platform offering AI-based study tools and a wide range of solved assignments for students.
1 out of 33
Related Documents


Your All-in-One AI-Powered Toolkit for Academic Success.
+13062052269
info@desklib.com
Available 24*7 on WhatsApp / Email
![[object Object]](/_next/static/media/star-bottom.7253800d.svg)
Copyright © 2020–2025 A2Z Services. All Rights Reserved. Developed and managed by ZUCOL.