Data Analytic and Business Intelligence Reports 2022
VerifiedAdded on 2022/09/28
|6
|1586
|17
AI Summary
Contribute Materials
Your contribution can guide someone’s learning journey. Share your
documents today.
Data Analytics and Business Intelligence
Secure Best Marks with AI Grader
Need help grading? Try our AI Grader for instant feedback on your assignments.
Data Analytics and Business Intelligence
Statistics
Statistics refers to the science that deals with the application of mathematical methods in
the evaluation of data to derive information of interest (Barbara & Susan, 2014). Statistics is
generally divided into two types. The first type is descriptive statistics which is a form of
statistics that summarizes the attributes in a dataset (Douglas, William, & Samuel, 2012). The
second type is the inferential statistics which is a form of statistics that estimates the properties of
attributes in a dataset (Douglas, William, & Samuel, 2012).
Population is the group of elements whose characteristics are to be evaluated in a
statistical study (Everitt & Skrondal, 2010). The subset of a population used in the analysis in
descriptive and inferential statistics is called a sample. Variables are countable and measureable
attributes of a dataset. Variables are either quantitative or qualitative in nature; Quantitative
variables are variables that can be expressed using numerals or integers while variables that are
nonnumeric are qualitative variables (Creswell, 2014). The types of variables are dependent on
the measurement scales. There are four measurement scales; nominal, ordinal, interval and ratio
scales (Norman, 2010).
An example of descriptive statistics is the mean share price of Apple on the NASDAQ
while an example of inferential statistics is the relationship between price of iPhones and the
share price of Apple.
Frequency Table
Frequency tables are tabular representations of counts of entries of the categories or
classes of qualitative variables. Visually, the information in the frequency tables can be
represented using pie charts and bar charts. Frequency distributions are extensions of frequency
tables with the inclusion of either cumulative values of the frequencies or the relative values of
the frequencies (Howitt & Cramer, 2010). Visually, the information in the frequency
distributions can be represented using histograms and frequency polygons.
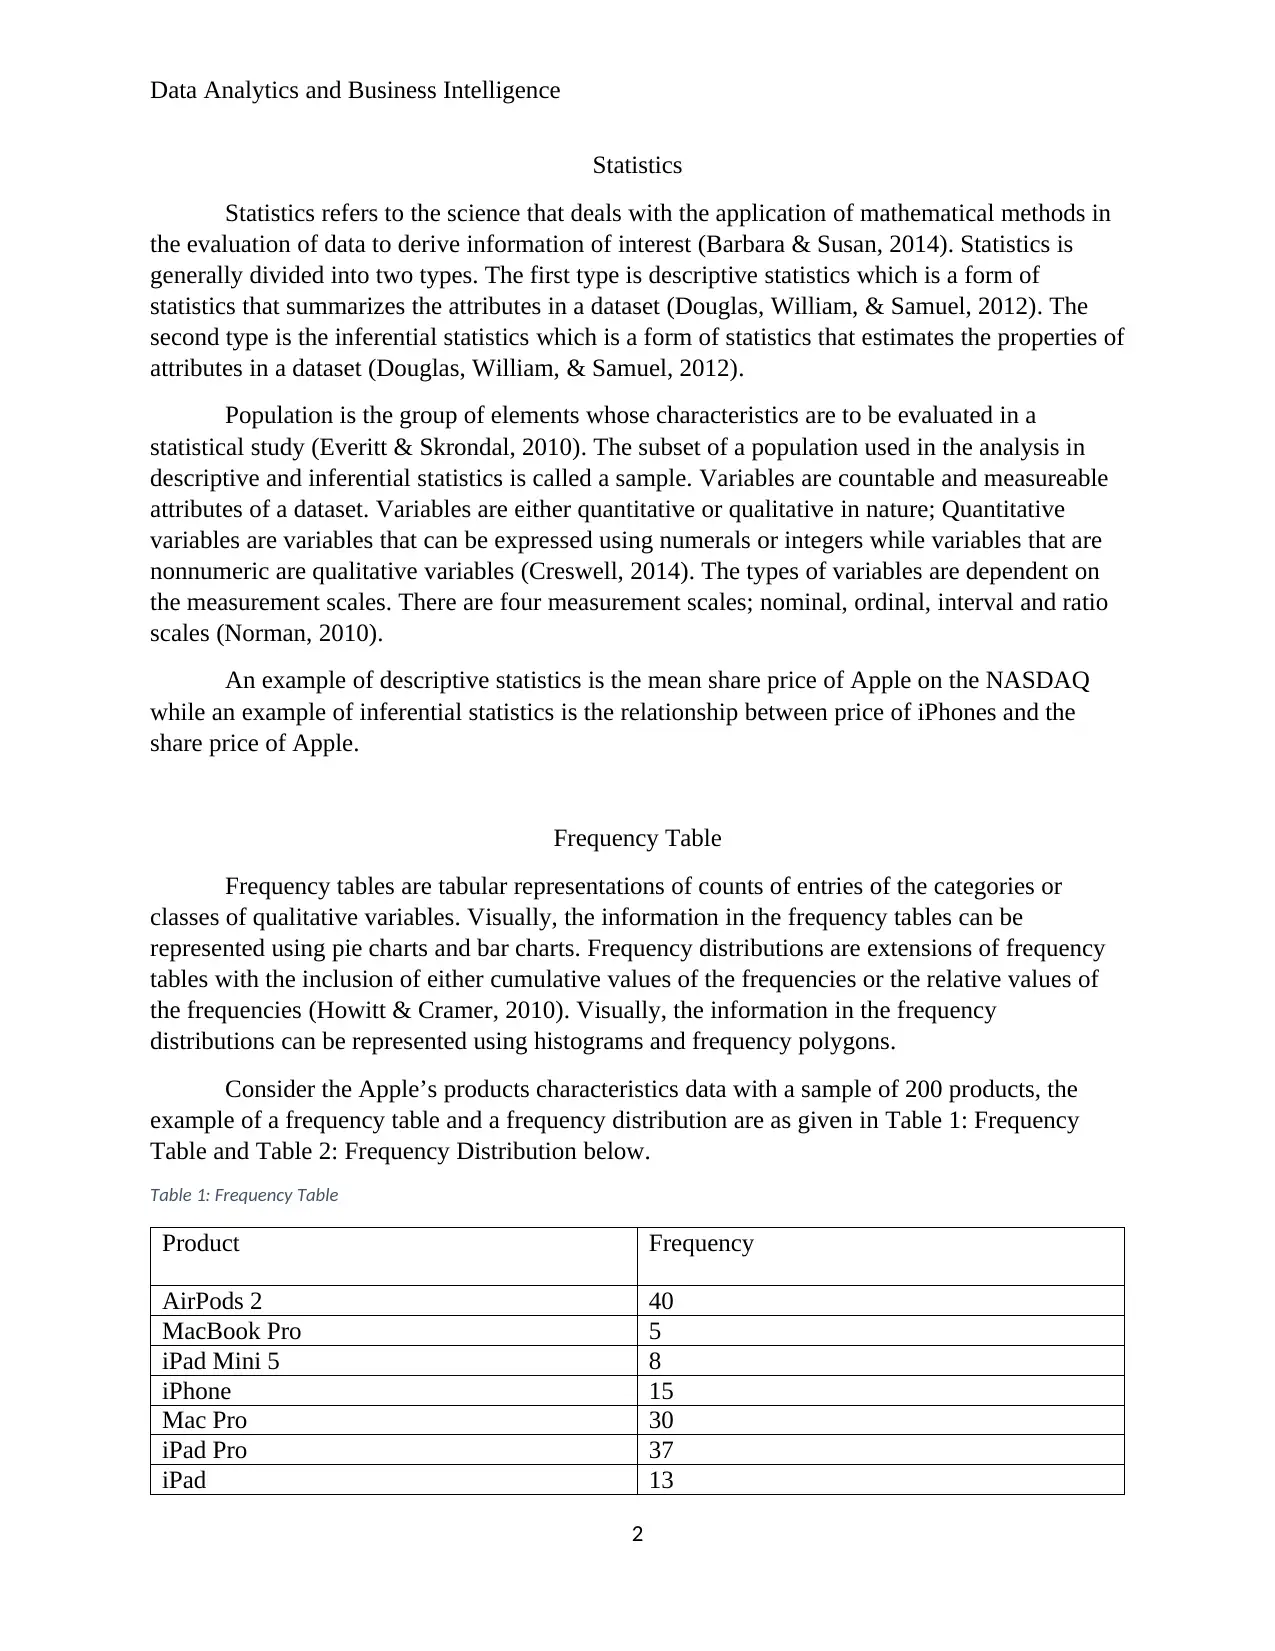
Consider the Apple’s products characteristics data with a sample of 200 products, the
example of a frequency table and a frequency distribution are as given in Table 1: Frequency
Table and Table 2: Frequency Distribution below.
Table 1: Frequency Table
Product Frequency
AirPods 2 40
MacBook Pro 5
iPad Mini 5 8
iPhone 15
Mac Pro 30
iPad Pro 37
iPad 13
2
Statistics
Statistics refers to the science that deals with the application of mathematical methods in
the evaluation of data to derive information of interest (Barbara & Susan, 2014). Statistics is
generally divided into two types. The first type is descriptive statistics which is a form of
statistics that summarizes the attributes in a dataset (Douglas, William, & Samuel, 2012). The
second type is the inferential statistics which is a form of statistics that estimates the properties of
attributes in a dataset (Douglas, William, & Samuel, 2012).
Population is the group of elements whose characteristics are to be evaluated in a
statistical study (Everitt & Skrondal, 2010). The subset of a population used in the analysis in
descriptive and inferential statistics is called a sample. Variables are countable and measureable
attributes of a dataset. Variables are either quantitative or qualitative in nature; Quantitative
variables are variables that can be expressed using numerals or integers while variables that are
nonnumeric are qualitative variables (Creswell, 2014). The types of variables are dependent on
the measurement scales. There are four measurement scales; nominal, ordinal, interval and ratio
scales (Norman, 2010).
An example of descriptive statistics is the mean share price of Apple on the NASDAQ
while an example of inferential statistics is the relationship between price of iPhones and the
share price of Apple.
Frequency Table
Frequency tables are tabular representations of counts of entries of the categories or
classes of qualitative variables. Visually, the information in the frequency tables can be
represented using pie charts and bar charts. Frequency distributions are extensions of frequency
tables with the inclusion of either cumulative values of the frequencies or the relative values of
the frequencies (Howitt & Cramer, 2010). Visually, the information in the frequency
distributions can be represented using histograms and frequency polygons.
Consider the Apple’s products characteristics data with a sample of 200 products, the
example of a frequency table and a frequency distribution are as given in Table 1: Frequency
Table and Table 2: Frequency Distribution below.
Table 1: Frequency Table
Product Frequency
AirPods 2 40
MacBook Pro 5
iPad Mini 5 8
iPhone 15
Mac Pro 30
iPad Pro 37
iPad 13
2
Data Analytics and Business Intelligence
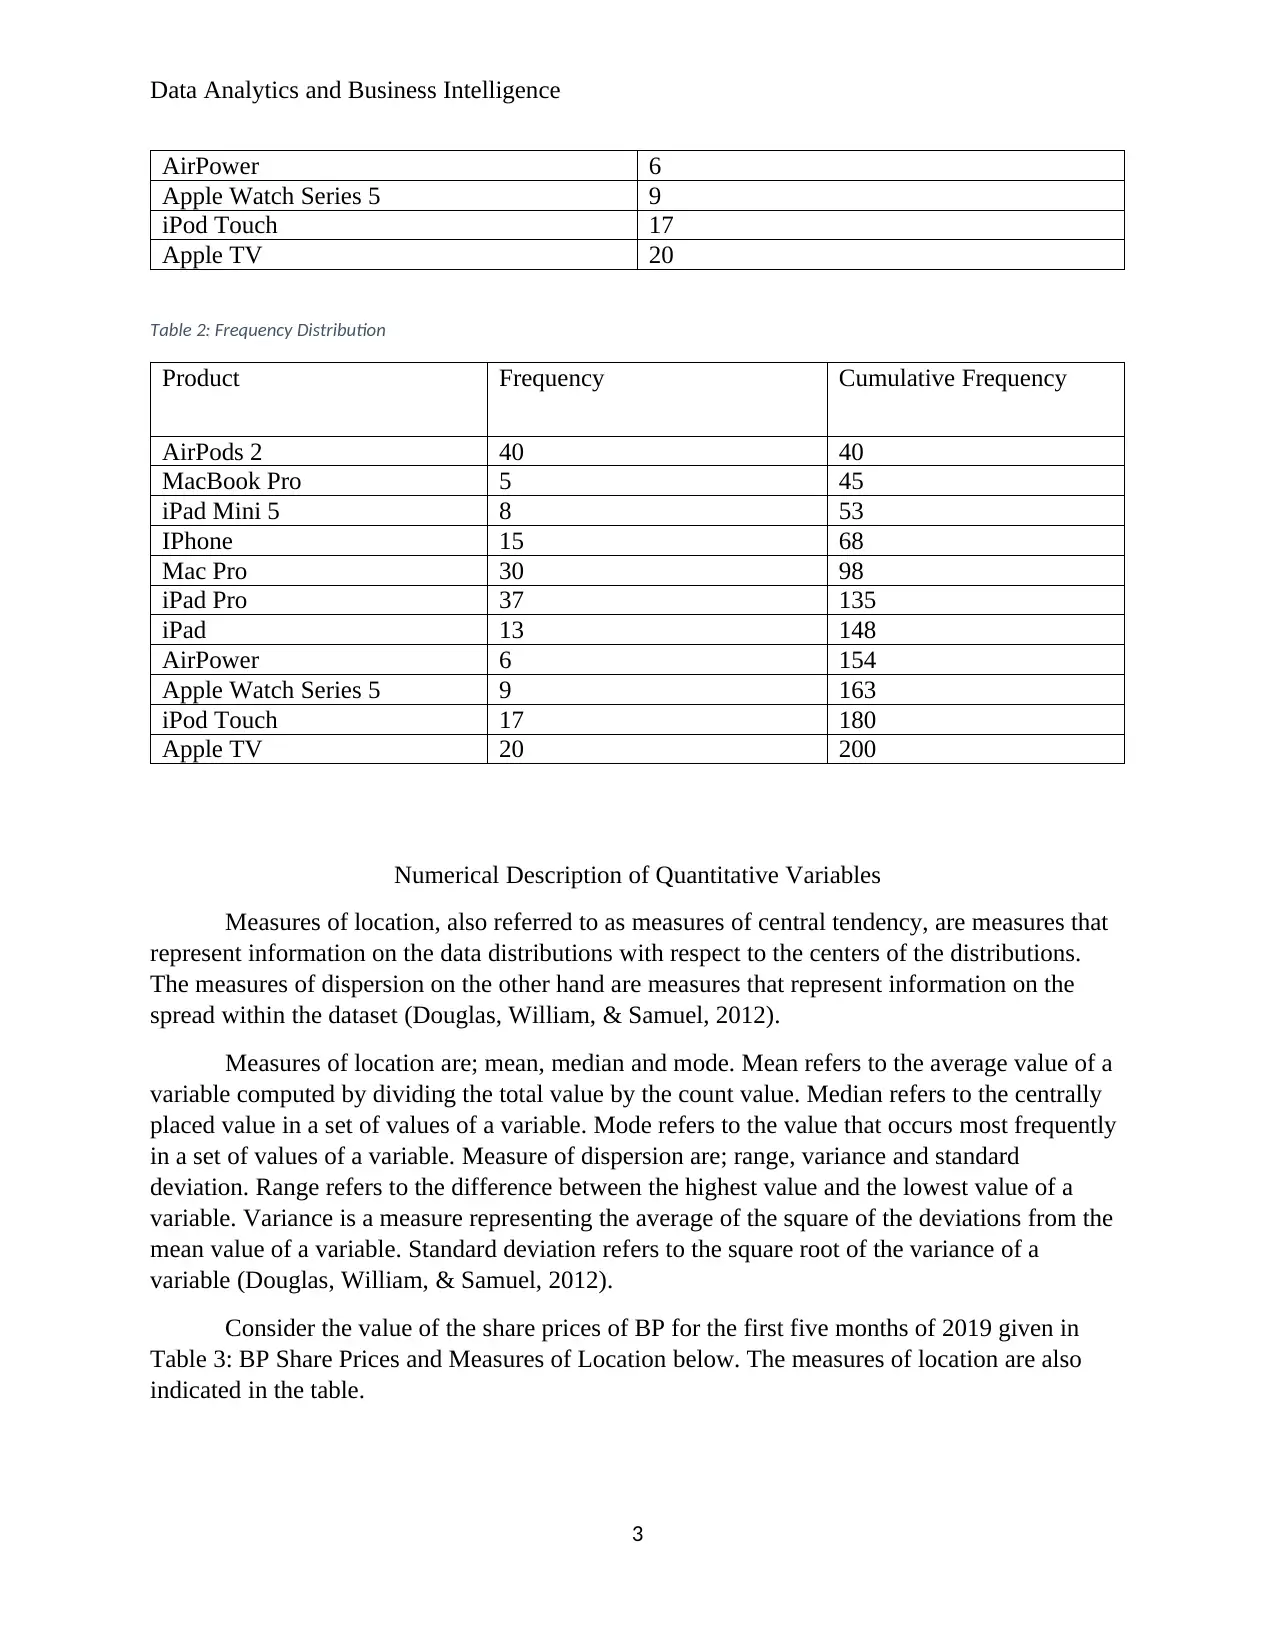
AirPower 6
Apple Watch Series 5 9
iPod Touch 17
Apple TV 20
Table 2: Frequency Distribution
Product Frequency Cumulative Frequency
AirPods 2 40 40
MacBook Pro 5 45
iPad Mini 5 8 53
IPhone 15 68
Mac Pro 30 98
iPad Pro 37 135
iPad 13 148
AirPower 6 154
Apple Watch Series 5 9 163
iPod Touch 17 180
Apple TV 20 200
Numerical Description of Quantitative Variables
Measures of location, also referred to as measures of central tendency, are measures that
represent information on the data distributions with respect to the centers of the distributions.
The measures of dispersion on the other hand are measures that represent information on the
spread within the dataset (Douglas, William, & Samuel, 2012).
Measures of location are; mean, median and mode. Mean refers to the average value of a
variable computed by dividing the total value by the count value. Median refers to the centrally
placed value in a set of values of a variable. Mode refers to the value that occurs most frequently
in a set of values of a variable. Measure of dispersion are; range, variance and standard
deviation. Range refers to the difference between the highest value and the lowest value of a
variable. Variance is a measure representing the average of the square of the deviations from the
mean value of a variable. Standard deviation refers to the square root of the variance of a
variable (Douglas, William, & Samuel, 2012).
Consider the value of the share prices of BP for the first five months of 2019 given in
Table 3: BP Share Prices and Measures of Location below. The measures of location are also
indicated in the table.
3
Data Analytics and Business Intelligence
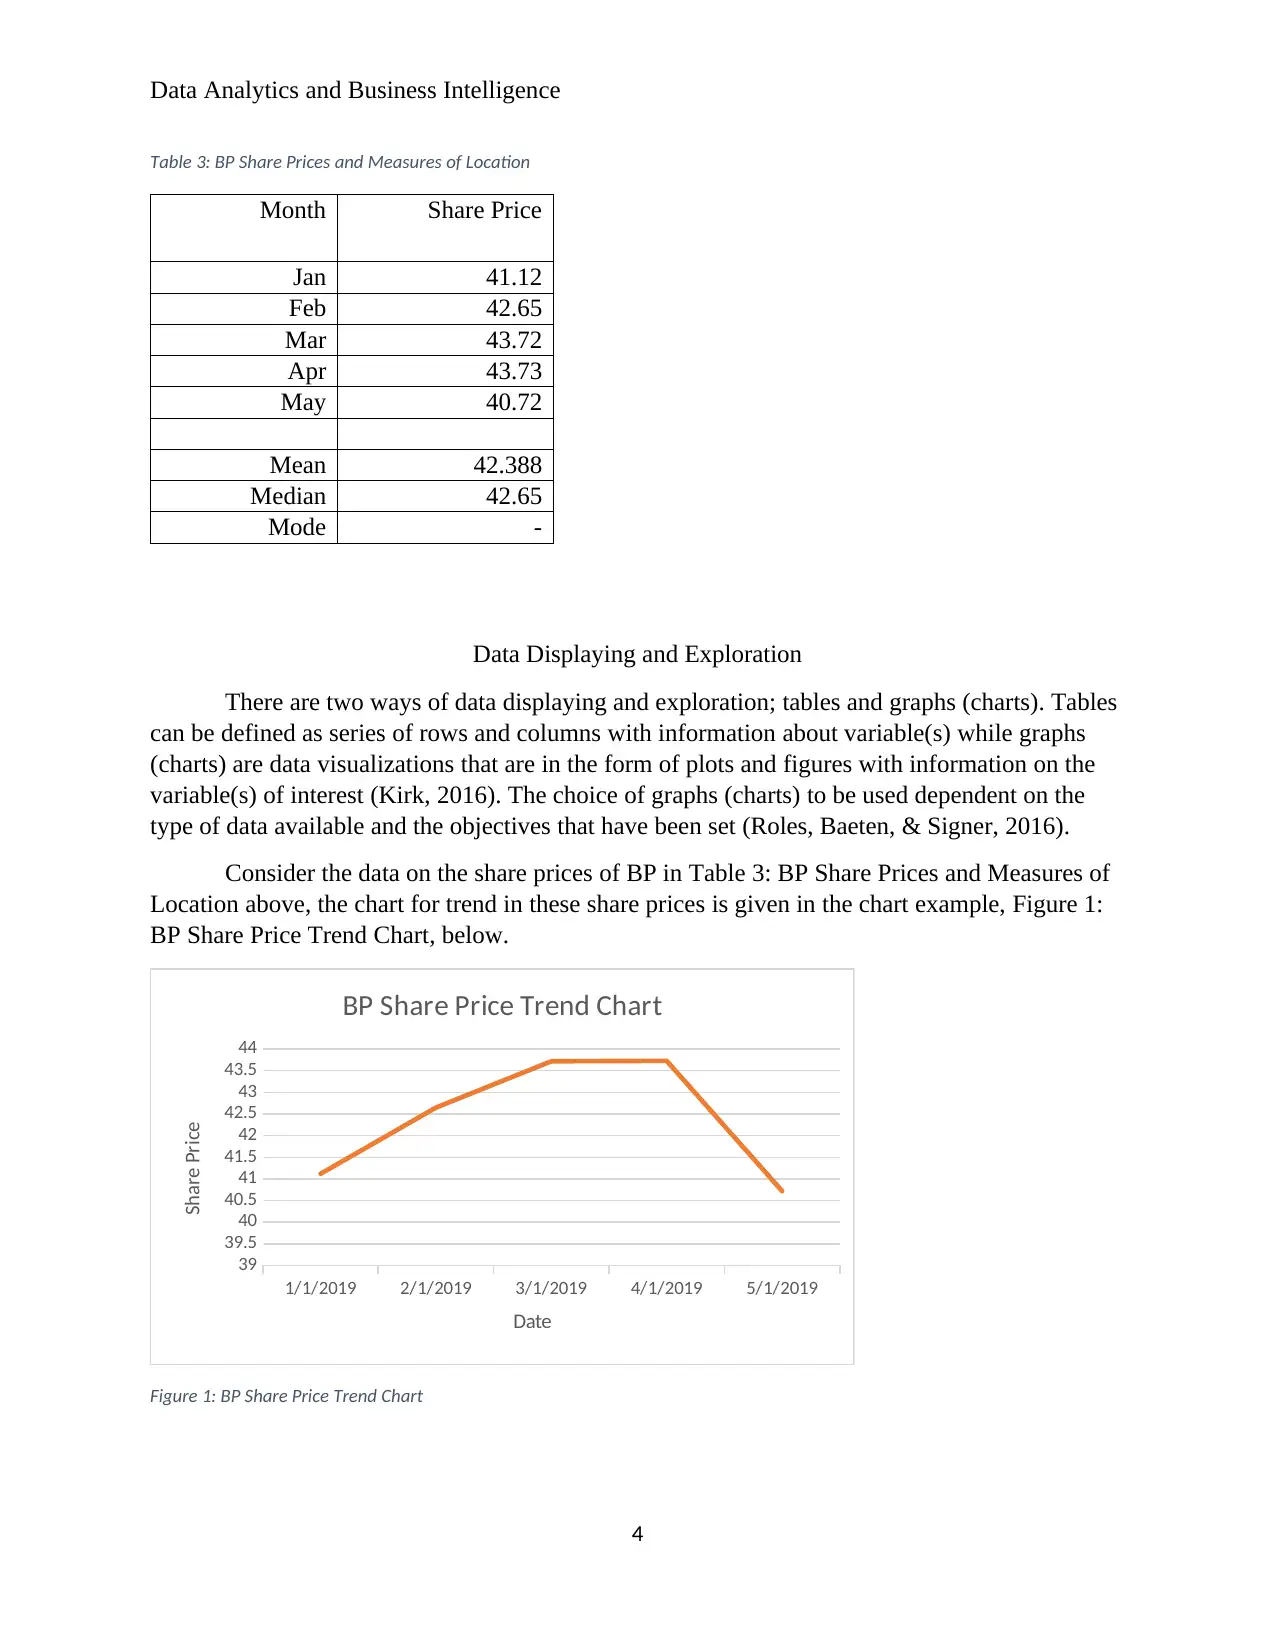
Table 3: BP Share Prices and Measures of Location
Month Share Price
Jan 41.12
Feb 42.65
Mar 43.72
Apr 43.73
May 40.72
Mean 42.388
Median 42.65
Mode -
Data Displaying and Exploration
There are two ways of data displaying and exploration; tables and graphs (charts). Tables
can be defined as series of rows and columns with information about variable(s) while graphs
(charts) are data visualizations that are in the form of plots and figures with information on the
variable(s) of interest (Kirk, 2016). The choice of graphs (charts) to be used dependent on the
type of data available and the objectives that have been set (Roles, Baeten, & Signer, 2016).
Consider the data on the share prices of BP in Table 3: BP Share Prices and Measures of
Location above, the chart for trend in these share prices is given in the chart example, Figure 1:
BP Share Price Trend Chart, below.
1/1/2019 2/1/2019 3/1/2019 4/1/2019 5/1/2019
39
39.5
40
40.5
41
41.5
42
42.5
43
43.5
44
BP Share Price Trend Chart
Date
Share Price
Figure 1: BP Share Price Trend Chart
4
Secure Best Marks with AI Grader
Need help grading? Try our AI Grader for instant feedback on your assignments.
Data Analytics and Business Intelligence
Probability
Probability is the measure of the chance of an event occurring (Barbara & Susan, 2014).
Probability has several concepts; The classical approach to probability assumes that every event
has an equal likely chance of occurring. Mutual exclusivity in terms of probability refers to
events that are such that only a single event in a set of events can occur at a time. In cases where
there is guarantee that at least one of the events in a set of events has to occur, then this case is
referred to as a completely exhaustive set (Douglas, William, & Samuel, 2012).
The concept of the Law of Large Numbers states that as the number of trials of an
experiment increases, the empirically determined probability of an event tends to its true
probability. The concept of joint probability considers probability for events that occur together
at the same time while the concept of conditional probability considers probability of an event
occurring provided that another event occurs. The prior probability considers the probability of
an event based on the currently available information while posterior probability considers
probability after more information has been provided (Douglas, William, & Samuel, 2012).
An example is the probability of a customer purchasing an iPhone at a phone store; say
0.78 probability of a customer purchasing an iPhone at a phone store.
Case
Consider the case of Apple; where descriptive statistics is applied in determining the
average share price over a given period of time. The inferential statistics is applied in
determining the nature of the effect of price of Apple products on its share price. Frequency
tables and frequency distributions are applied in the analysis of the sales at Apple stores across
the world to determine the count of various sold products.
The measure of location and dispersion are computed for the share prices to inform on
the behavior of the Apple share prices. This is in addition to the trend charts that are developed
to track the movements of the share prices. In terms of probability, the probability of a customer
buying an iPhone given there are other phone brands in the same store provides Apple with
valuable information on the policy on setting up Apple Stores in different destinations.
5
Data Analytics and Business Intelligence
References
Barbara, I., & Susan, D. (2014). Introductory Statistics (1st ed.). New York: OpenStax CNX.
Creswell, J. W. (2014). Research Design: Qualitative, Quantitative and Mixed Approaches (4th
ed.). Michigan: SAGE Publications, Inc.
Douglas, L. A., William, M. G., & Samuel, W. A. (2012). Statistical Techniques in Business and
Economics (15th ed.). New York: McGraw Hill Irwin .
Everitt, B. S., & Skrondal, A. (2010). Cambridge Dictionary of Statistics (4th ed.). London:
Cambridge University Press.
Howitt, D., & Cramer, D. (2010). Introduction to Descriptive Statistics in Psycology, 5th
Edition. New York: Prentice Hall.
Kirk, A. (2016). Data Visualization: A Handbook for Data Driven Design (2nd ed.). Thousand
Oaks, CA: Sage Publications, Ltd.
Norman, G. (2010). Likert Scales, Levels of Measurement and the Laws of Statistics. Advances
in Health Science Education , 15(5), 625-632.
Roles, R., Baeten, Y., & Signer, B. (2016). Interactive and Narrative Data Visualization for
Presentation-Based Knowledge Transfer. Communication in Computer and Information
Science, 4(6), 739.
6
1 out of 6
Your All-in-One AI-Powered Toolkit for Academic Success.
+13062052269
info@desklib.com
Available 24*7 on WhatsApp / Email
![[object Object]](/_next/static/media/star-bottom.7253800d.svg)
Unlock your academic potential
© 2024 | Zucol Services PVT LTD | All rights reserved.